Analyst Summary
For internal analysts team eyes only
Document Information
| Document Title | Salifort Motors - Analyst's Summary - for internal use only |
| Author | Rod Slater |
| Version | 1.0 |
| Created | 01-11-2023 |
| Modified | 16-11-2023 |
Client Details
| Client Name | Salifort Motors |
| Client Contact | Mr HR Team |
| Client Email | hr@salifortmotors.it |
| Client Project | HR Team Data Driven Solutions from Machine Learning Models |
Initial EDA
Columns Renamed
| Old Column Name | New Column Name |
|---|---|
| satisfaction_level | satisfaction |
| last_evaluation | last_eval |
| average_monthly_hours | avg_mnth_hrs |
| time_spend_company | tenure |
| Work_accident | accident |
| Department | dept |
| promotion_last_5years | promotion |
Missing Values
There were no missing values in the dataset
Data that would assist & assumptions
- We don't have any information on employee start and end date. We can carry out a more thorough analysis if we had this information.
- We don't have employee leaving reason : dismissed, end of contract, resigned, redundancy, other.
- We also do not have employee position, so for example we are unable to calculate the employee to manager ratio for each department
Since all of these pieces of information can have a considerable bearing on analysis of left = 1 or not we have to acknowledge that we are working with limited dataset and can only provide guideline insights, therefore certain assumptions have been made to support those insights.
In reality, further investigation with the client's domain experts would hopefully enable us to source this information. Where assumptions have been made, these are clearly identified.
Outliers
824 outlier rows were removed using tenure, this represented around 7% of the total data rows. Removal of the outliers is only necessary for the Logistical Regression modelling.
Duplicated Rows
Duplicated rows equals 3008 rows, about 20% of the total data.
| Pre Dedupe Rows | 14999 |
| Post Deduplication Rows | 11991 |
| Duplicate rows removed | 3008 |
There was a class imbalanced in the duplicated data, using left as the outcome feature:
Left = |
left Count | left % of total |
| 1 | 1580 | 53% |
| 0 | 1428 | 47% |
Data Engineering
Features removed
The accident feature was removed pending further investigation.
The % of staff who recorded an accident was around 15%, ten times higher than the national average. For example in 2013 and 2014 the accident rate was between 23 % and 27%. Is this a dangerous place to work ?
Features Engineered
- salary - was ordinal encoded 0 = low, 1= medium, 2 = high
- dept - was dummy encoded into binary columns
- avg_hrs_mnth - as binary encoded to a new feature called overworked on avg_mnth_hrs > 175
Datasets
Two datasets were modelled, to provide an educational comparison that the reduced dataset makes on model performance. It turns out, not a lot and the lower the correlation, the less effect it has on the outcome, who would have thought?
data_cleaned_NoOl_FE_AllFeat.csv - Feature engineered, all features in the data set.
data_cleaned_NoOl_FE_NoDept.csv - Feature engineered, the dummy encoded department information was removed from the dataset.
Exploratory Data Analysis
Data overview
- 11,991 employee records (DeDuped)
- 11,555 Employees
- 436 Managers
- 10,000 current employees (left = 0)
- 9,616 current employees
- 384 current managers
- 1,991 employees who have left (left = 1)
- 16.6% of Total employees
- 1,939 employees have left (20.16 of total workforce)
- 52 Managers have left (13.54% of total managers)
Initial Pairplot observations
Key features to investigate further :
- avg_mnth_hrs
- number_project
- satisfaction
- promotion
- tenure
- last_eval
- salary
Correlation mean scores of Key features
| all features | focus features | left = 1 focus | |
| avg_mnth_hrs | 9.17% | 20.93% | 40.69% |
| last_eval | 9.06% | 21.23% | 44.42% |
| number_project | 8.81% | 20.63% | 37.64% |
| tenure | 8.11% | 16.63% | 43.21% |
| promotion | 6.27% | 14.77% | 11.65% |
| salary | 5.66% | 14.23% | 12.66% |
| accident | 4.84% | 13.07% | 12.95% |
| dept_management | 3.80% | - | - |
| left | 3.32% | - | - |
| satisfaction | 2.80% | 11.15% | 16.53% |
| dept_marketing | 1.75% | - | - |
| dept_accounting | 1.63% | - | - |
| dept_RandD | 1.44% | - | - |
| dept_hr | 1.31% | - | - |
| dept_product_mng | 1.10% | - | - |
| dept_IT | 0.41% | - | - |
| dept_support | -0.97% | - | - |
| dept_technical | -1.80% | - | - |
| dept_sales | -3.19% | - | - |
Key Observations
avg_mnth_hrs
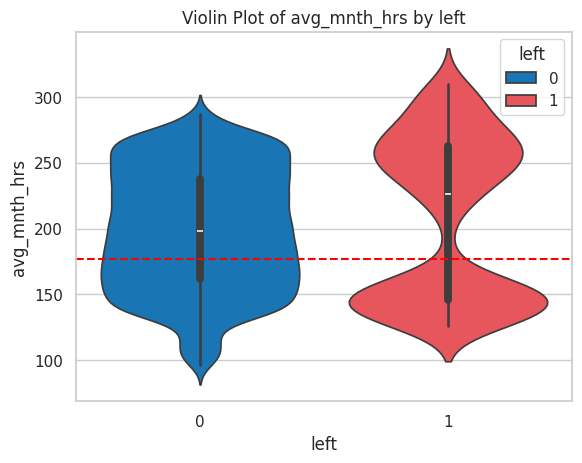
- 34% of staff who left worked a normal 8 hour day.
- 66% of staff who left worked more than 8 hours a day.
last_eval
- 80% of those who left scored above 0.5 (Medium) on their last evaluation.
- 52% who scored high (>0.70) left the company
- 88% of all staff scored 0.51 or above.
- With a very low promotion rate, high scoring employees have no career development path to pursue
num_project
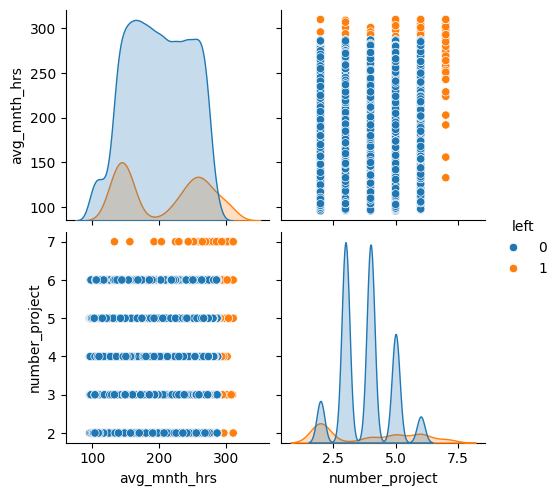
The average of number of projects an employee worked on was 4.
76% of employees who stayed, worked on four or less projects
55% of those who left, worked on four or more projects
98% of those who left, worked on four or more projects, or 2 projects.
Of total employees who worked on 2 projects, 54% left employment
Of total employees who worked on 6 or more projects, 60% left employment
The number of projects an employee works on appears to have a high correlation to employees leaving if they are working on too many projects, or too few. This also This also correlates to working hours, where a high percentage of employees working more than 175 hrs a month are leaving the company
tenure
- The mean employee tenure is 3.3 years
We don't really have enough data to comment on tenure, however if we had start date and end date of employees, we could make additional observations.
If we also had the reason for leaving, the analysis could be a lot more meaningful, therefore for the purposes of this Capstone Project, certain assumptions will be made.
Promotion
There appears to be a very low level of promotion within the client's business.
Only 1.69% of employees who are currently employed have received a promotion in the last five years.
Employee / Manager Ratio
In management circles, it is common knowledge that the ideal number of direct subordinates a manager should have is 7±2 that is around 8 employees, plus or minus 2. While this may not apply in all industries and situations, it's a good starting point for measuring the ratio of employees to managers.
The current ratio of employees to managers in Salifort Motors is 25:1, that is about 25 employees for each manager.
Consideration should be given to create a development path for employees to grow into management positions to continue the developmental growth previously seen.
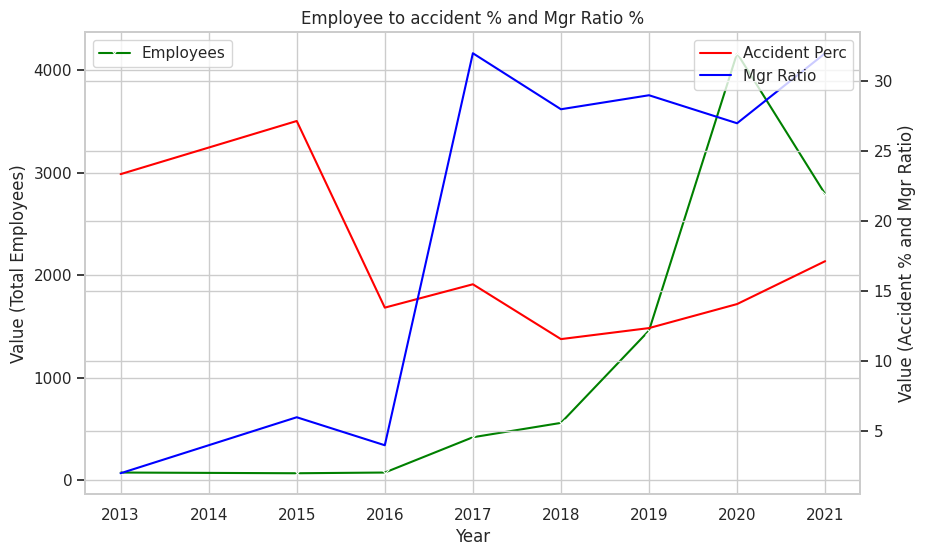
Managers to Accident Rates
As noted earlier, the accident rate % seems very high, in my mind this is questionable and requires further investigation.
Extrapolated data However, digging a little deeper, we find that the accident rate % increases as total number employees increases. There would be an expectation that we would see a more consistent ratio, not an increase in accidents.
NOTE this is an extrapolation of the tenure column to estimate employee start date, this is not real but an example of further analysis that could be carried out if we had the relevant employee start-date, end-date data.
Start date has been calculated as today-tenure=StartDate in this example
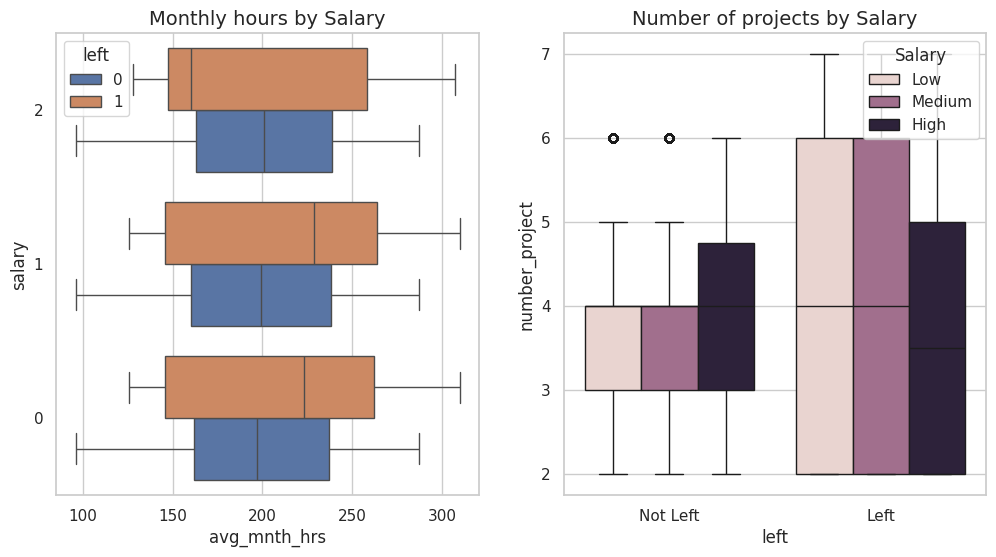
salary
The majority of staff who left were either on low or medium salary levels. This is why employees choose to work and if compensation is below market rates, employees will seek better opportunities.
satisfaction
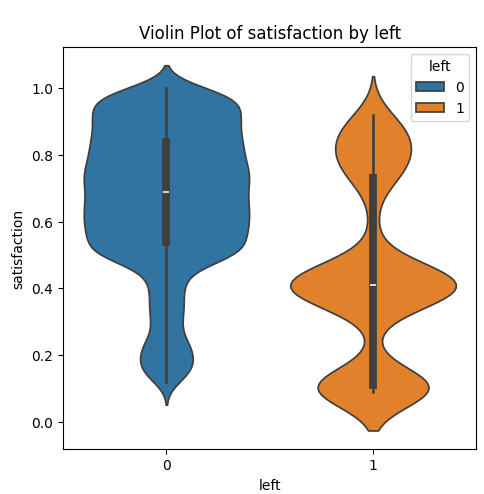
Employees who left had lower mean and medium scores than those that stayed.
- 74% of employees who left, self reported a low or medium
satisfaction level (1,460 of 1,991)
- Compared to 48% of staff who stayed, reporting low to medium satisfaction
- 26% of staff who left, self reported low satisfaction vs 10% of staff who stayed
- 46% of staff who left, self reported medium satisfaction vs 38% of staff who stayed
- 27% of staff who left, self reported high satisfaction vs 52% of staff who stayed
dept
27% of all employees that left were in sales (550 employees left). This is not surprising, sales is a tough role, however improving recruitment practices to identify better candidates and staff training could help improve staff retention.
The next largest attrition department is Technical at 18.71% (390 employees who left) followed by Support at 15.19% (312 employees who left).
62% of employees who left worked for one of these three departments. These three departments also represent 61% of all employees.
R&D and Management have the lowest turnover at 12.25% and 11.95% compared to the average of other departments which range from 17% - 19%
accident
accident stands out as an outlier. 15% of all employees had an accident recorded against them.
- This accident percentage is 6.5 times the national average of 2.3% [^1]. This
- column will be removed it seems wrong and needs further investigation before
- considering it for inclusion in the model.
[^1] https://www.bls.gov/news.release/pdf/osh.pdf
Conclusions
Cost of replacing lost employees
Using a broad brush approach to addressing the employee attrition problem could be expensive. If this approach was applied wholesale to all employees who left:
| salary | left | count | |
|---|---|---|---|
| high | 0 | 942 | |
| high | 1 | 48 | |
| low | 0 | 4,566 | |
| low | 1 | 1,174 | |
| medium | 0 | 4,492 | |
| medium | 1 | 769 |
The estimated cost of employees leaving (assuming it costs 30% of annual salary to replace them) is around $42 million.
If the suggested cost to replace an employee is 50% of annual salary, this cost increases to $71 million.
The costs of replacing employees (left = 1)
Assuming a nominal cost of 50% of total annual salary to replace a member of staff
| Cost of staff LEFT (assuming replacement costs 50% of total salary) | |||
|---|---|---|---|
| # of Staff | Cost Per Head | Est Cost | |
| Estimate High Salary Left Cost | 48 | 75,000 | 3,600,000 |
| Estimate Medium Salary Left Cost | 769 | 50,000 | 38,450,000 |
| Estimate Low Salary Left Cost | 1,174 | 25,000 | 29,350,000 |
| Estimate replacement cost | 1,991 | 71,400,000 | |
The costs (and savings) by applying a 30% pay increase to everyone who left
(obviously before they left)
| XGBoost staff will leave predictions x 30% pay increase | |||
|---|---|---|---|
| # of Staff | Cost Per Head | Est £ Cost | |
| Estimate High Salary Left Cost | 48 | 45,000 | 2,160,000 |
| Estimate Medium Salary Left Cost | 769 | 30,000 | 23,070,000 |
| Estimate Low Salary Left Cost | 1,174 | 15,000 | 17,610,000 |
| Estimate TOTAL Salary Left Cost | 1,991 | 42,840,000 | |
Applying Machine learning to staff retention
If we use the machine learning model prediction, we can identify at risk employees before it's too late, for a substantially lower cost than applying salary increases wholesale across the business.
| XGBoost Model Predictions of salary cost increases | |||
|---|---|---|---|
| # of Staff | Cost Per Head | Est £ Cost | |
| Estimate High Salary Left Cost | 12 | 75,000 | 900,000 |
| Estimate Medium Salary Left Cost | 33 | 50,000 | 1,650,000 |
| Estimate Low Salary Left Cost | 67 | 25,000 | 1,675,000 |
| Estimate TOTAL Salary Left Cost | 112 | 4,225,000 | |
Model Performance with real data
Applying the ML Model to the HR_Dataset for all employees give us these results:
ML Model Predictions for ALL Employees
This assumes all employees who left are still employees and the ML model was applied to this data.
| Count of employees with leave probability above high_risk_threshold | 1,763 |
| Percentage of employees with leave probability above high_risk_threshold | 15.79% |
| Count of employees with leave probability above medium_risk_threshold | 1,780 |
| Percentage of employees with leave probability above medium_risk_threshold | 15.94% |
Using 1,991 employees who have left as the baseline, this means the ML Model correctly predicted as high risk or above medium risk at 89% of the people who left. That is the model would predict nearly 90% of the staff who left, before they left. The 11% would be employees who left that did not fit the model.
ML Model applied to CURRENT employees
Using the same model applied to current employees:
Summary for CURRENT Employees
| Count of employees with leave probability above high_risk_threshold | 48 |
| Percentage of employees with leave probability above high_risk_threshold | 52% |
| Count of employees with leave probability above medium_risk_threshold | 59 |
| Percentage of employees with leave probability above medium_risk_threshold | 64% |
Where the model is predicting 59 employees are currently at risk of leaving with a probability > 50% or 48 employees are at risk of leaving with a probability > 70%, the first step is to talk to the employee.
Conclusion and warnings
Having detailed all of this, it's crucial to keep in mind the principle that “correlation does not imply causation.” While ML models offer powerful predictive capabilities based on data patterns, they inherently lack the depth to discern causation in complex human behaviors.
Humans are complicated, employees even more so
Imagine a scenario where it is observed that there is a strong correlation between the usage of office snacks and increased employee engagement. It would be a mistake to assume that providing more snacks directly boosts engagement. The underlying causation might be a positive workplace culture that encourages interaction and collaboration, leading to both higher snack consumption and increased engagement.
Similarly, with employee turnover prediction, the model can identify patterns and correlations, but it's essential to remember that correlation alone doesn't unveil the reasons behind an employee's decision to leave. It might hint at factors such as work dissatisfaction, but it won't reveal the underlying causes.
It is essential that building strong relationships, competitive compensation, and genuine care for employees remains paramount. While ML models can enhance the understanding, they cannot replace the human touch in addressing individual concerns and motivations. A well-compensated and engaged workforce is not merely a statistical outcome; it reflects the tangible efforts that must be invested in creating a positive work environment.
As you integrate ML into your HR strategies, it should be viewed as a complementary tool that works hand-in-hand with existing and new practices. The commitment to fostering a workplace where employees feel valued and heard will always be at the core of success in retaining top talent.
scroll to top