Salifort Motors HR Summary
Document Information
| Document Title | Salifort Motors - HR Summary |
| Author | Rod Slater |
| Version | 1.0 |
| Created | 01-11-2023 |
| Modified | 16-11-2023 |
Client Details
| Client Name | Salifort Motors |
| Client Contact | Mr HR Team |
| Client Email | hr@salifortmotors.it |
| Client Project | HR Team Data Driven Solutions from Machine Learning Models |
Table of Contents
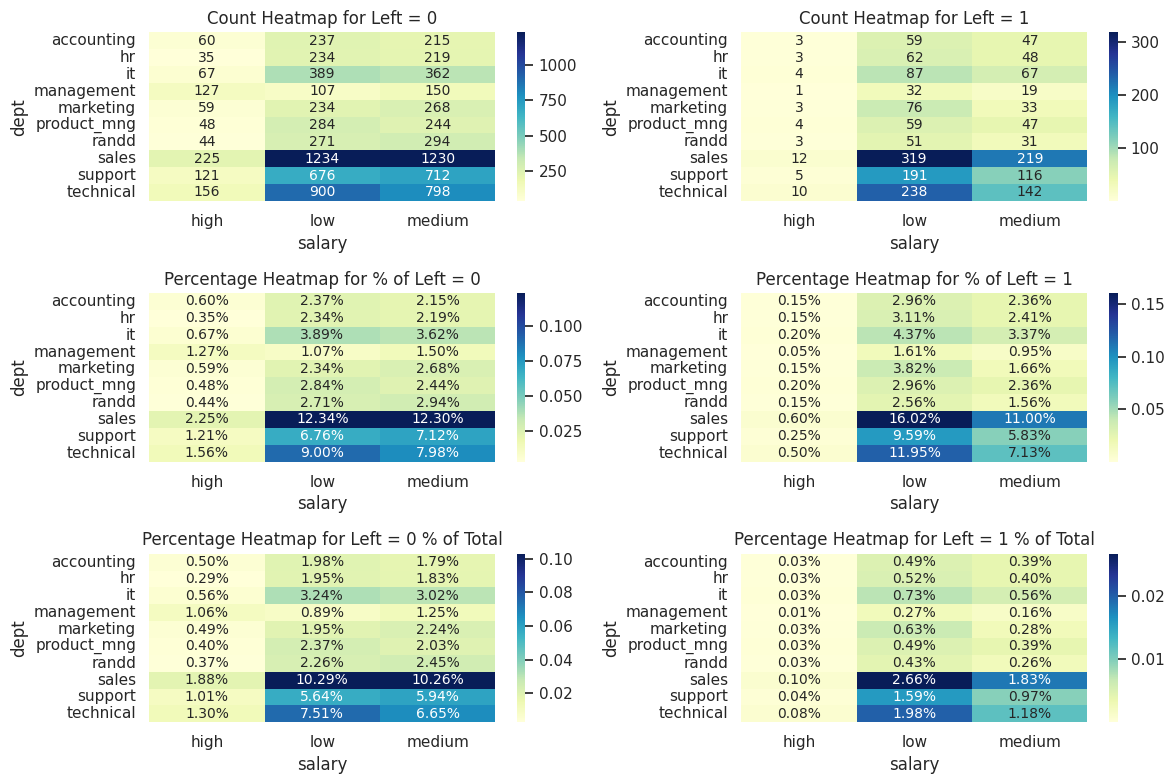
Additional Visualisations
This notebook details a number of different visualisations of the data by department and compared to company average.
This can be used during discussions with team managers
HR Summary Notebook for reference during team manager discussions
Results of analysis
Following a comprehensive analysis of the data provided by the HR department on employees who have left the organization, I have identified several key factors contributing to employee attrition. It is crucial to address these issues to enhance employee satisfaction, engagement, and retention within the company.
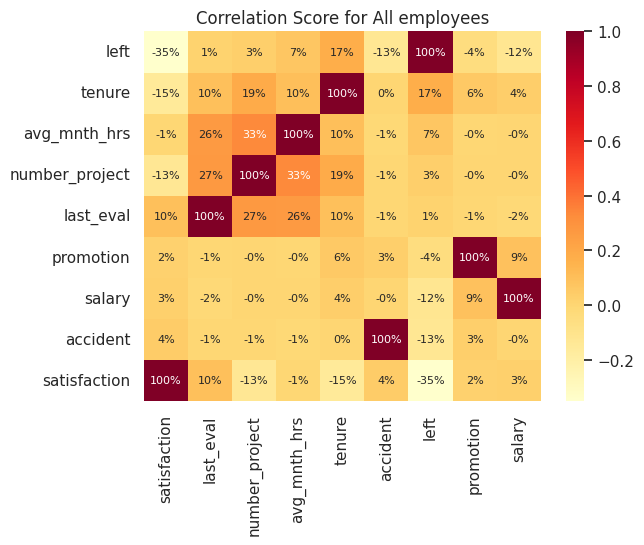
Key correlations of all employees
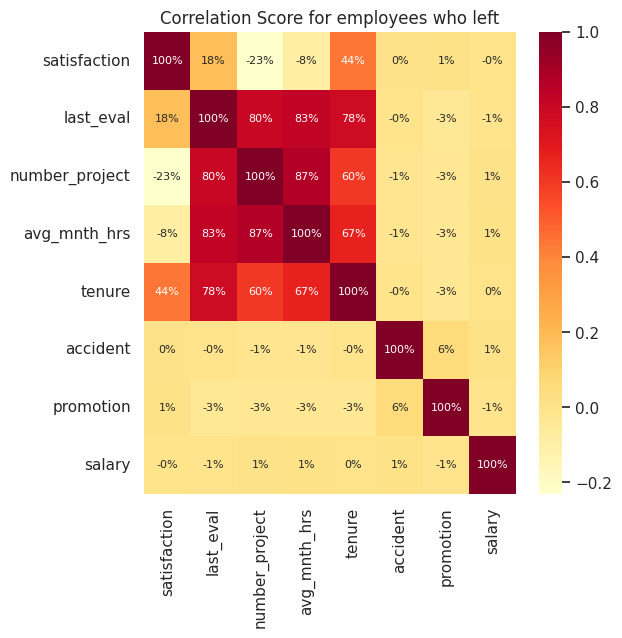
Key correlations of employees who left
Observations from the data
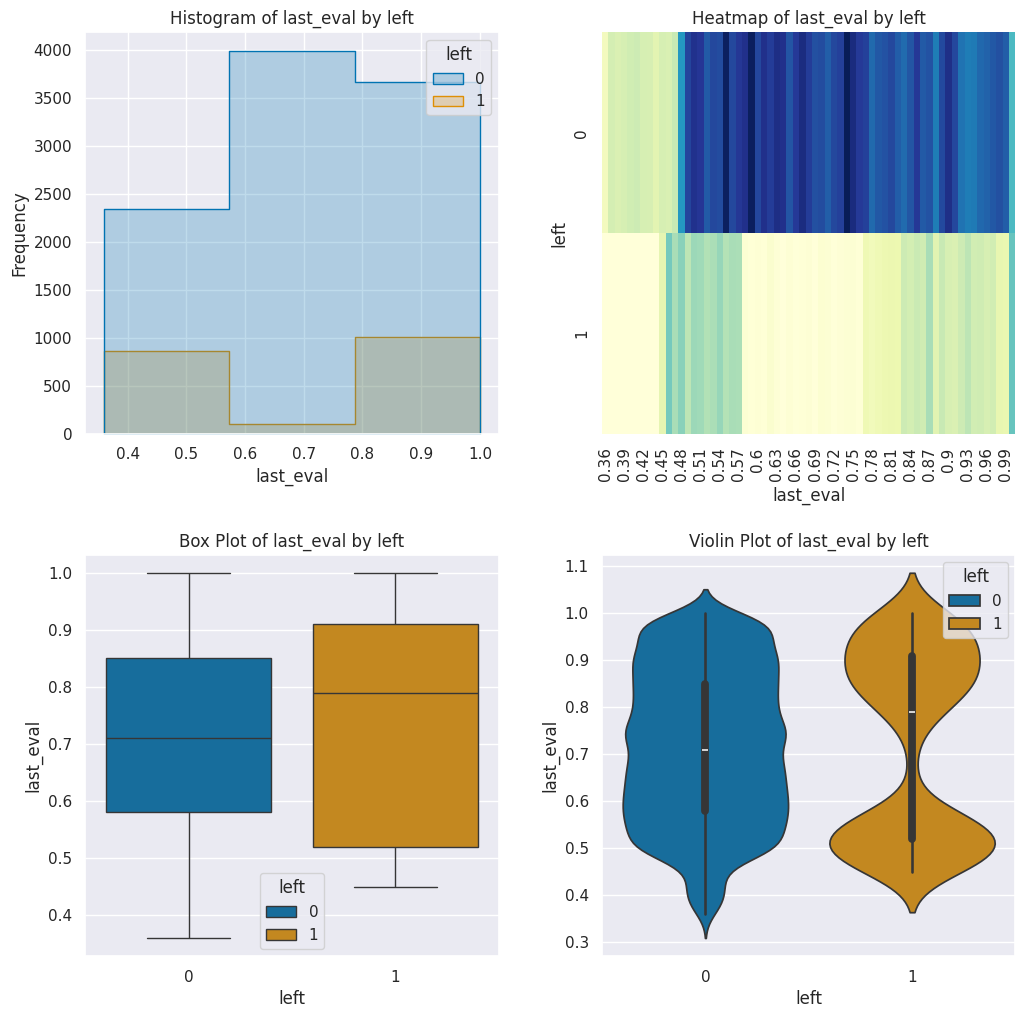
EDA Observations - last_eval
Those who left fall generally into one of two groups either low scoring or high scoring with 28% of low scoring employees leaving and 17% of high scoring employees leaving. 46% of employees who left had a low or medium score, there's also a strong correlation to hours worked as seen on the correlation plot, where those who left also tend to work more hours.
- There's a high correlation with
satisfaction,number_project,avg_mnth_hrsandtenure - 20% of those who left had a low
last_evalscore vs 10% of total employees who stayed - 25% of those who left had a medium
last_evalscore vs 38% of total employees who stayed - 54% of those who left had a high
last_evalscore vs 51% of total employees who stayed
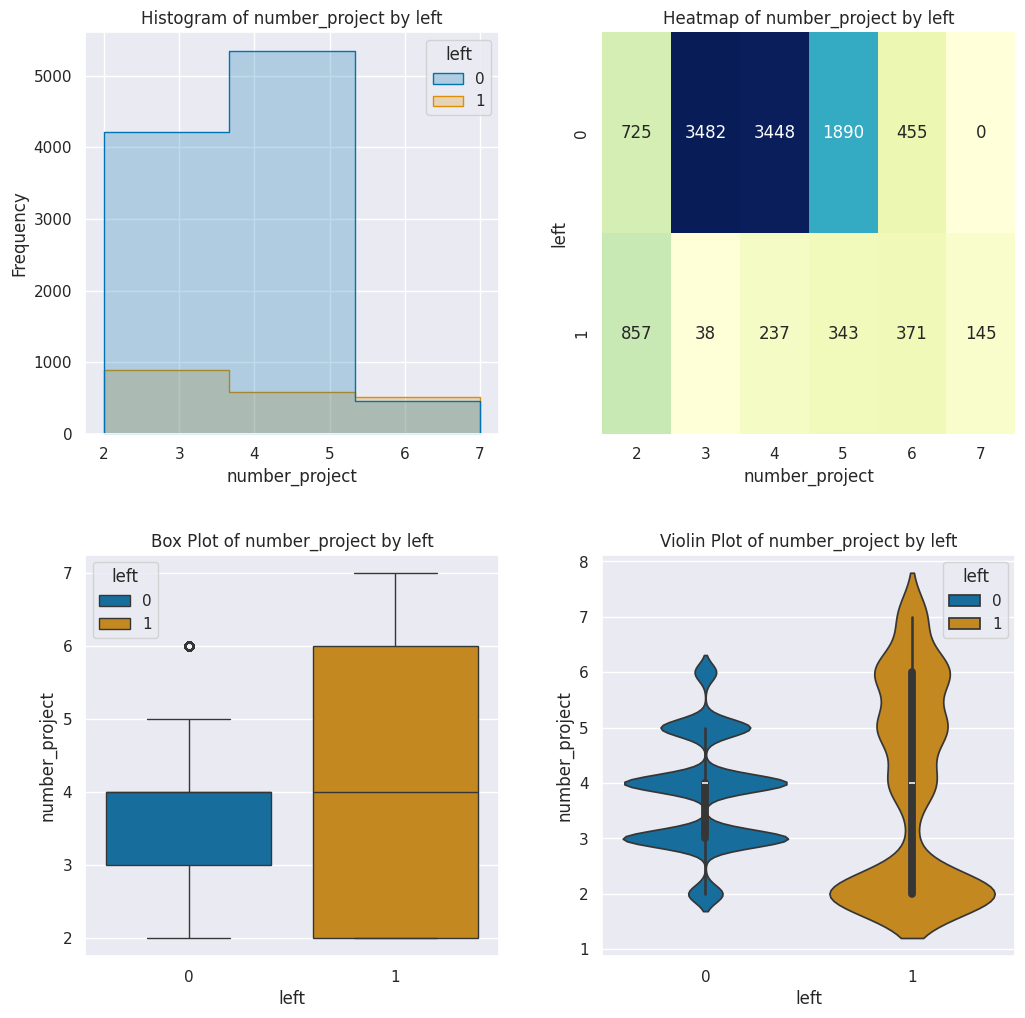
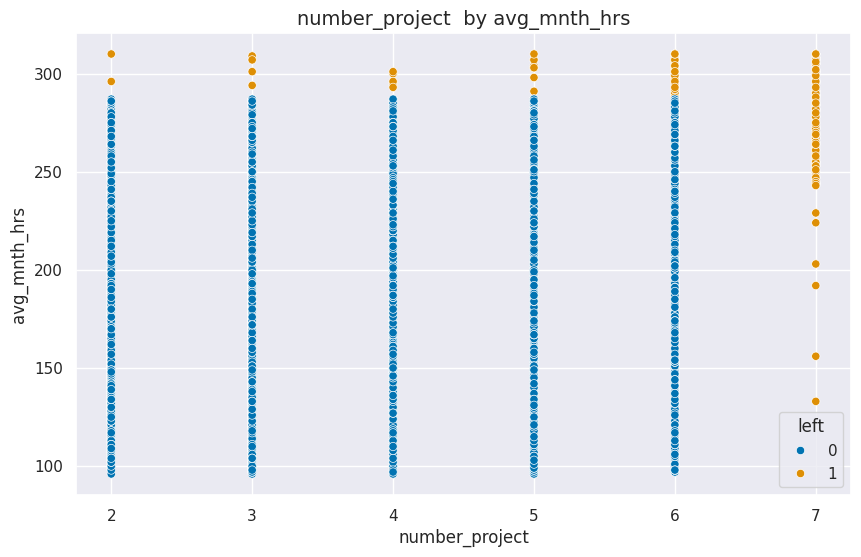
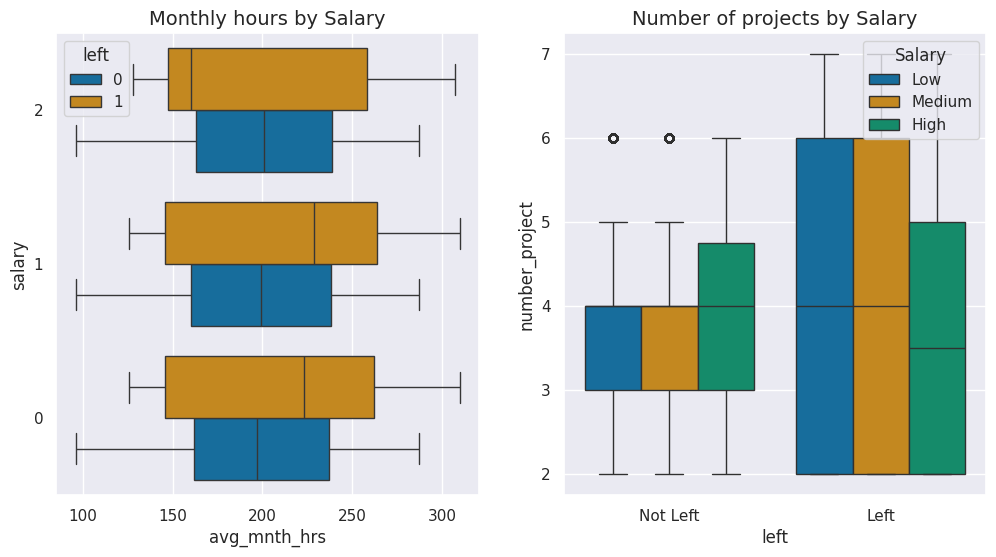
EDA Observations - number_project
Caveats - The number of projects is a simple metric that does not take into account either the complexity or duration of the project. A member of staff could only have worked on one project, but the complexity and duration of the project would not be taken into account with the available data. There is also a high correlation to the number of hours worked.
People who left are mostly in the low and medium salary ranges
People who left are estimated to cost the business £42M (assuming 30% cost of annual salary to replace)
45% of employees who worked on 2 or less projects left
100% of employees who worked on seven projects left the company
26% of employees who worked on 5 or more projects left the company
50% of employees who left, worked on either 2 or less or more than 5 projects
Highest retention was with employees who worked on between 3-5 projects where 95% of the staff were retained.
Lowest retention was with employees who worked on 2 projects, 46% of the staff were retained or 6+ projects where 3% of the staff were retained.
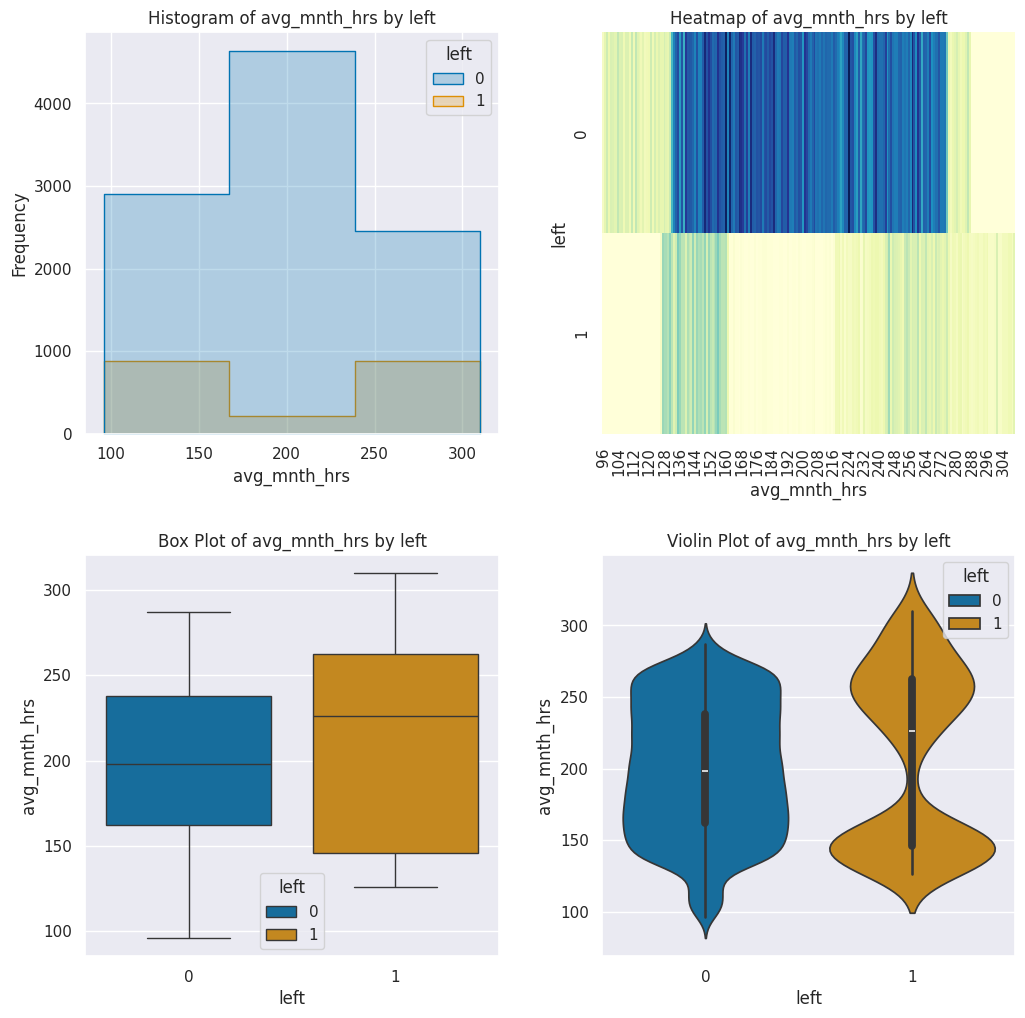
avg_mnth_hrs
- 30% of employees who left, worked LESS than an average of 150 hours a month (average less than 7 hours a day)
- 54% of employees who left, worked MORE than an average of 200 hours a month (average more than 9 hours a day)
- 100% of employees who worked 300 or more hours, left employment
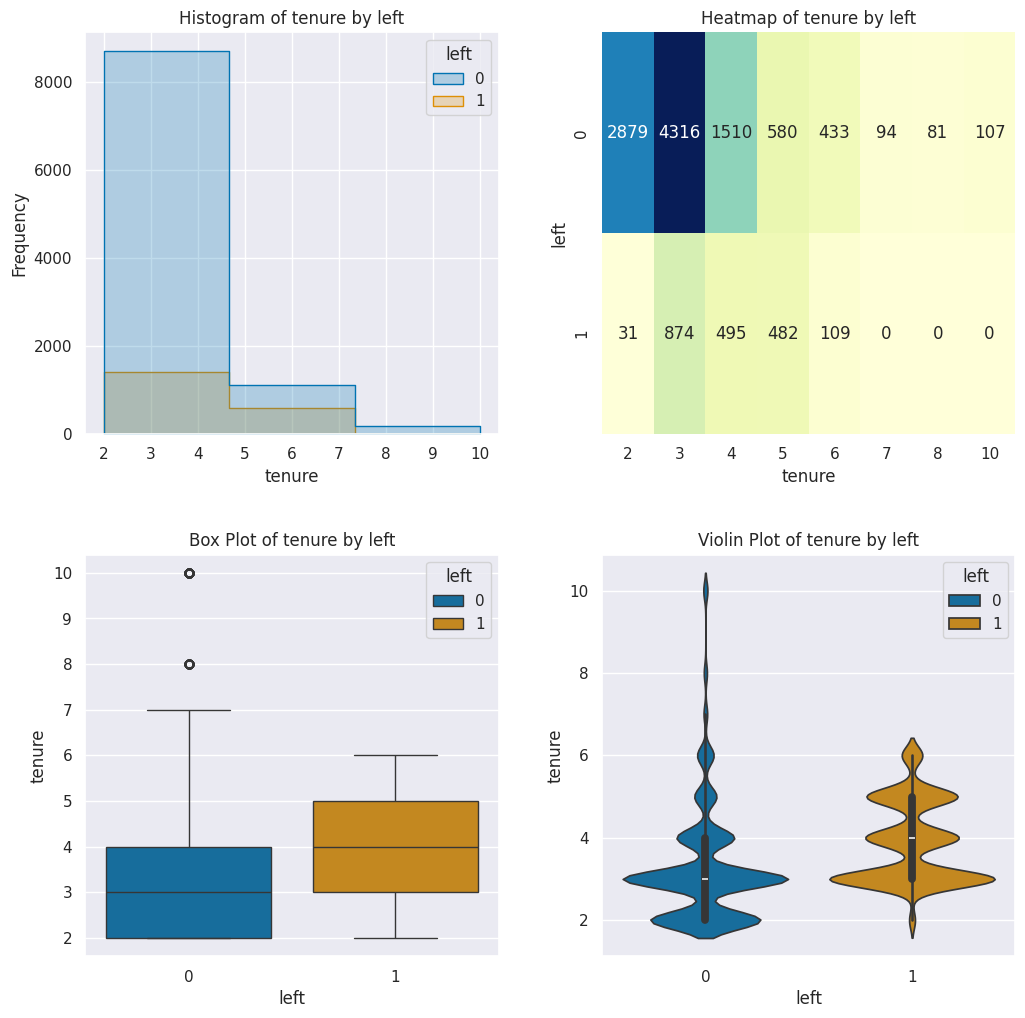
EDA Observations - tenure
- 93% of staff who left had a tenure of 3 & 5 years
- 43% of staff who left had a tenure of 2 years or less (847)
- 684 outlier records identified = about 7% of total record count
- 87% of staff have been employed for 4 years or less and in theory would not qualify for promotion_last_5_years, maybe, we don't have enough data to be sure
Employees vs management to support them
We are making assumptions here!
We would need some additional information in the dataset to identify the start year for each employee and which department managers belong to.
In management circles, it is common knowledge that the ideal number of direct subordinates a manager should have is 7±2 that is around 8 employees,plus or minus 2.
Employee to Manager Ratio
Currently within Salifort Motors, there are 9616 current employees (not management) and 384 Managers (not employees). This puts the employee manager ratio at 23 employees for every manager.
Conventional management thinking of 8 employees per manager, the client would need to recruit/develop a further 800+ managers to bring the employee to manager ratio down to more conventional levels.
This also links to the promotion field where the % of employees who have received promotions in the last five years is very low (1.6%) and the opportunity to grow management resources within the business is high.
Consideration should be given to the development path for employees to move into management.
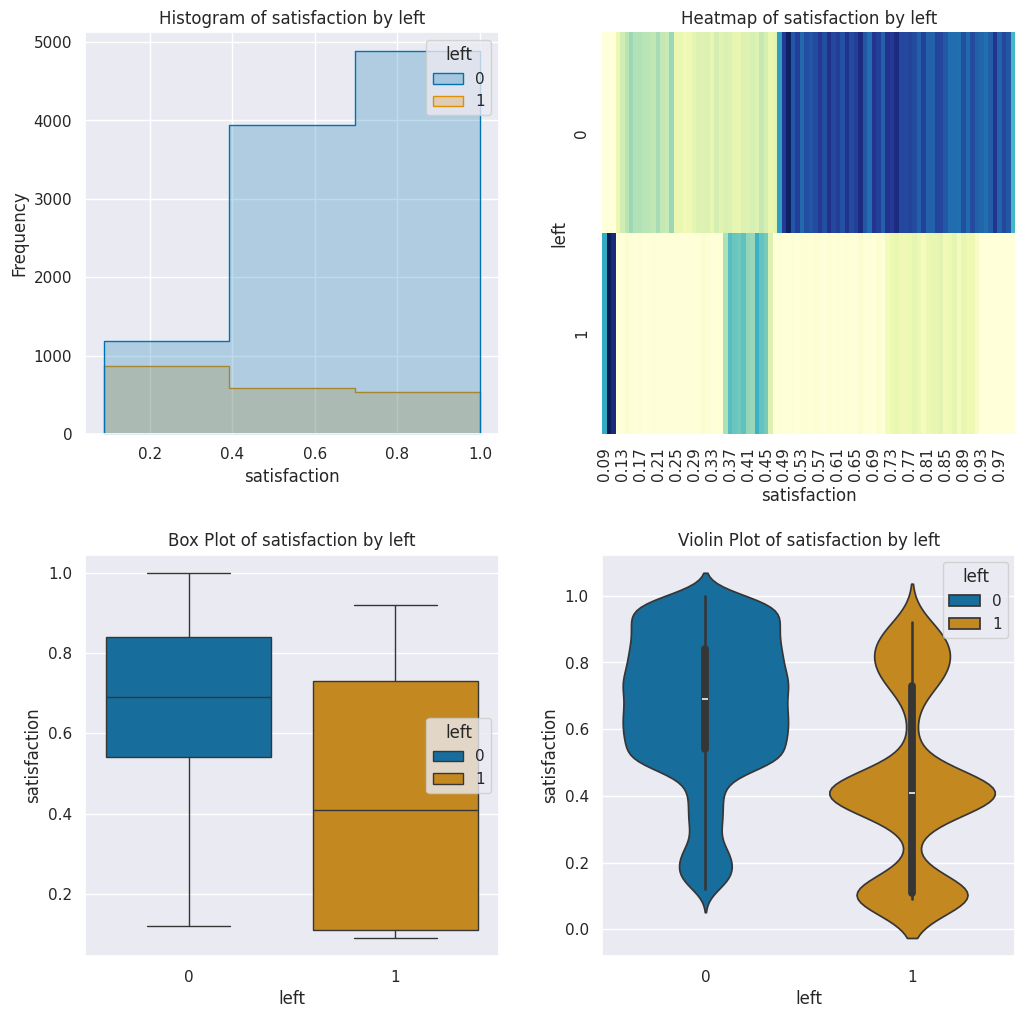
EDA Observations - satisfaction
The feature is not collinear with any others.
Employees who left had lower mean and medium scores than those that stayed.
- 74% of employees who left, self reported a low or medium
satisfaction level (1,460 of 1,991)
- Compared to 48% of staff who stayed, reporting low to medium satisfaction
- 26% of staff who left, self reported low satisfaction vs 10% of staff who stayed
- 46% of staff who left, self reported medium satisfaction vs 38% of staff who stayed
- 27% of staff who left, self reported high satisfaction vs 52% of staff who stayed
EDA Observations - accident
15% of all employees had an accident recorded against them.
This accident percentage is 6.5 times the national average of 2.3% [^1]. This column will be removed data seems questionable and needs further investigation before considering it for inclusion in the model, but with a low % of employees affected, I doubt it will have much impact on the model.
There were 1850 accident incidents in the data, which is 15% of the total staff.
People who stayed recorded 1,745 accidents (94% of accidents were from people who stayed)
- 17% of all staff who stayed recorded an accident
People who left recorded 105 accidents (6% of accidents were from people who left)
- 6% of all staff who left recorded an accident
[^1] In 2022, the rate of injury cases was 2.3 cases per 100 FTE workers, unchanged from 2021. US Bureau Labour of Statistics, US Department of Labour - https://www.bls.gov/news.release/pdf/osh.pdf
EDA Observations - promotion
93% of staff have a tenure of five or less than 5 years.
- of the 10,000 current staff, 1.95% have received a promotion in the last 5 years
- 99.6% (1,983) of staff who left did not receive a promotion in the last five years
- 4% (8) of staff who left, received a promotion in the last 5 years
- There was one employee who left with a tenure 5 years or greater
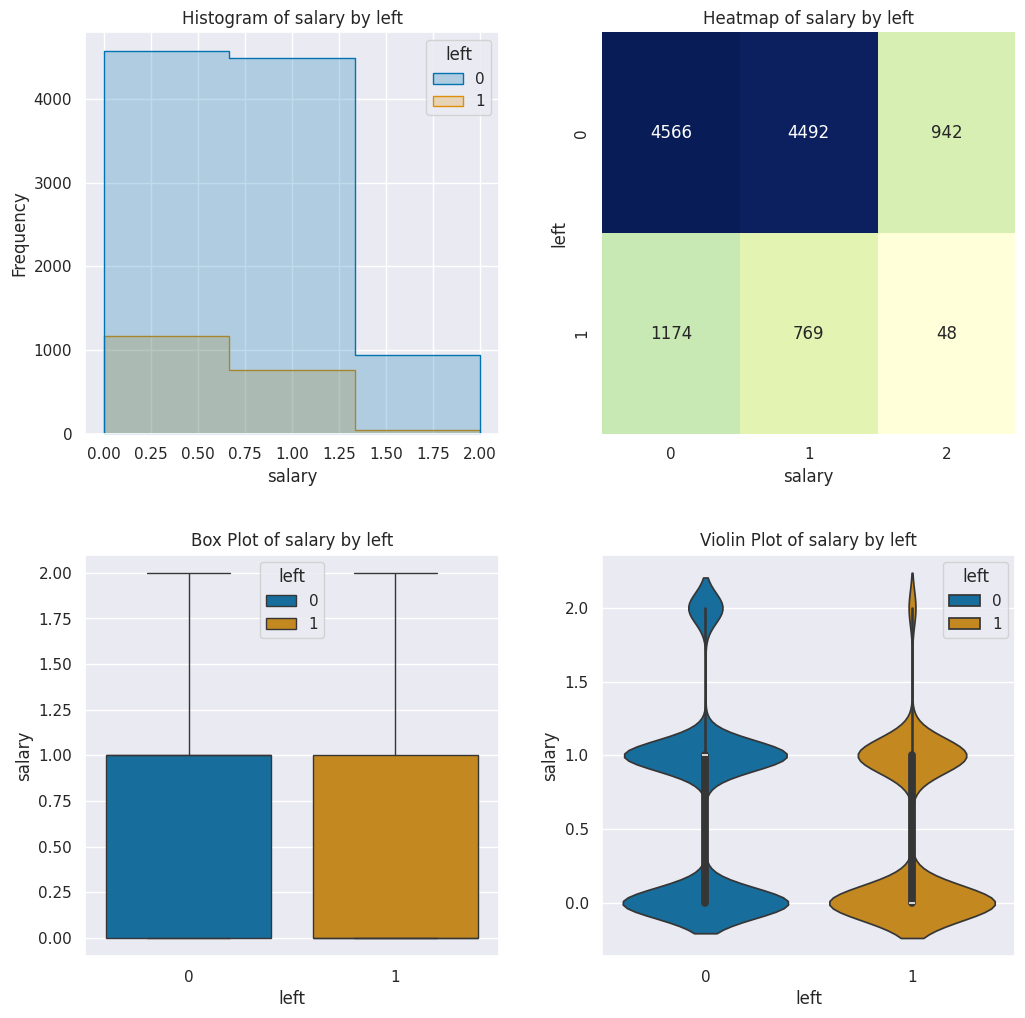
EDA Observations - salary
- 59% of staff who left were on a low salary
- 98.6% of staff who left were on a low or medium salary
General Recommendations
Compensation and Benefits
One prominent factor associated with employee departure is low pay. It is evident that a significant number of departing employees expressed dissatisfaction with their compensation packages. I recommend a thorough review of the current salary structures to ensure they align with industry standards and adequately reward employees for their contributions.
Working Conditions
Long working hours and varying project loads have emerged as significant contributors to employee turnover. Striking a balance between workload and work-life balance is essential. Addressing these concerns may involve optimizing project allocation, setting realistic deadlines, and promoting a healthier work environment.
Recognition and Appreciation
The data indicated a lack of recognition from management as a key reason for an employees departure. Implementing regular acknowledgment programs and fostering a culture of appreciation and care can significantly boost morale and job satisfaction.
Job Satisfaction
Self-reported low job satisfaction is a recurring theme among departing employees. Conducting employee surveys and feedback sessions can provide valuable insights into specific areas that require improvement, allowing the organization to tailor interventions to meet employee needs.
Career Growth Opportunities
The absence of promotions and limited career growth opportunities has been identified as a concern. Initiatives such as mentorship programs, skill development workshops, and transparent career progression paths can help retain valuable talent within the organization.
In conclusion, addressing these key factors is imperative for fostering a positive work environment, retaining talented employees, and ultimately improving organizational performance. I recommend a strategic action plan that includes targeted interventions to mitigate these challenges and enhance overall employee satisfaction.
Thank you for your attention to these critical matters. I am available for further discussion and collaboration to implement these recommendations effectively.
About the ML model
The model is based on a machine learning algorithm call XGBoost.
ML Model Predictions Summary for CURRENT Employees
| probabilities > high_risk_threshold 90% | |
|---|---|
| Count of employees with leave probability above 90% | 12 |
| Percentage of employees with leave probability above 90% | 0.13% |
| probabilities > medium_risk_threshold 70% | |
| Count of employees with leave probability above 70% | 33 |
| Percentage of employees with leave probability above 70% | 0.36% |
| probabilities > predict_risk_threshold 50% | |
| Count of employees with leave probability above 50% | 67 |
| Percentage of employees with leave probability above 50% | 0.72% |
If we apply the model to employees who have already left, effectively testing the model against known data, we can see that 72% of employees who left would have been flagged by the ML model as at high risk, and action perhaps could have been taken before the inevitable. If we lower the risk threshold to medium risk at 70%, then over 90% of these employees would have been flagged and if we look to those flagged above low risk at 50%, 91% of employees would have been flagged.
To put some perspective around this, the level of accuracy demonstrated by the model is significantly better than a random guess.
ML Model Predictions Summary for LEFT Employees
| probabilities > high_risk_threshold 90% | |
|---|---|
| Count of employees with leave probability above 90% | 1,360 |
| Percentage of employees with leave probability above 90% | 72.26% |
| probabilities > medium_risk_threshold 70% | |
| Count of employees with leave probability above 70% | 1,712 |
| Percentage of employees with leave probability above 70% | 90.97% |
| probabilities > predict_risk_threshold 50% | |
| Count of employees with leave probability above 50% | 1,731 |
| Percentage of employees with leave probability above 50% | 91.98% |
| % of employees left that were predicted | XGBoost Predicted to leave > (50% )/ % of employees who left | 86.94 % |
Demonstration of the ML Model
This requires a live setup. Kaggle to the rescue!
Predictions Files
Team Report Template
scroll to top