Jump to section
Food Standards Agency - Food Alerts Analysis
![]()
Last Updated: Sunday, February 08, 2026 09:24 AM - Data up to Saturday, 07 February, 2026
Abstract
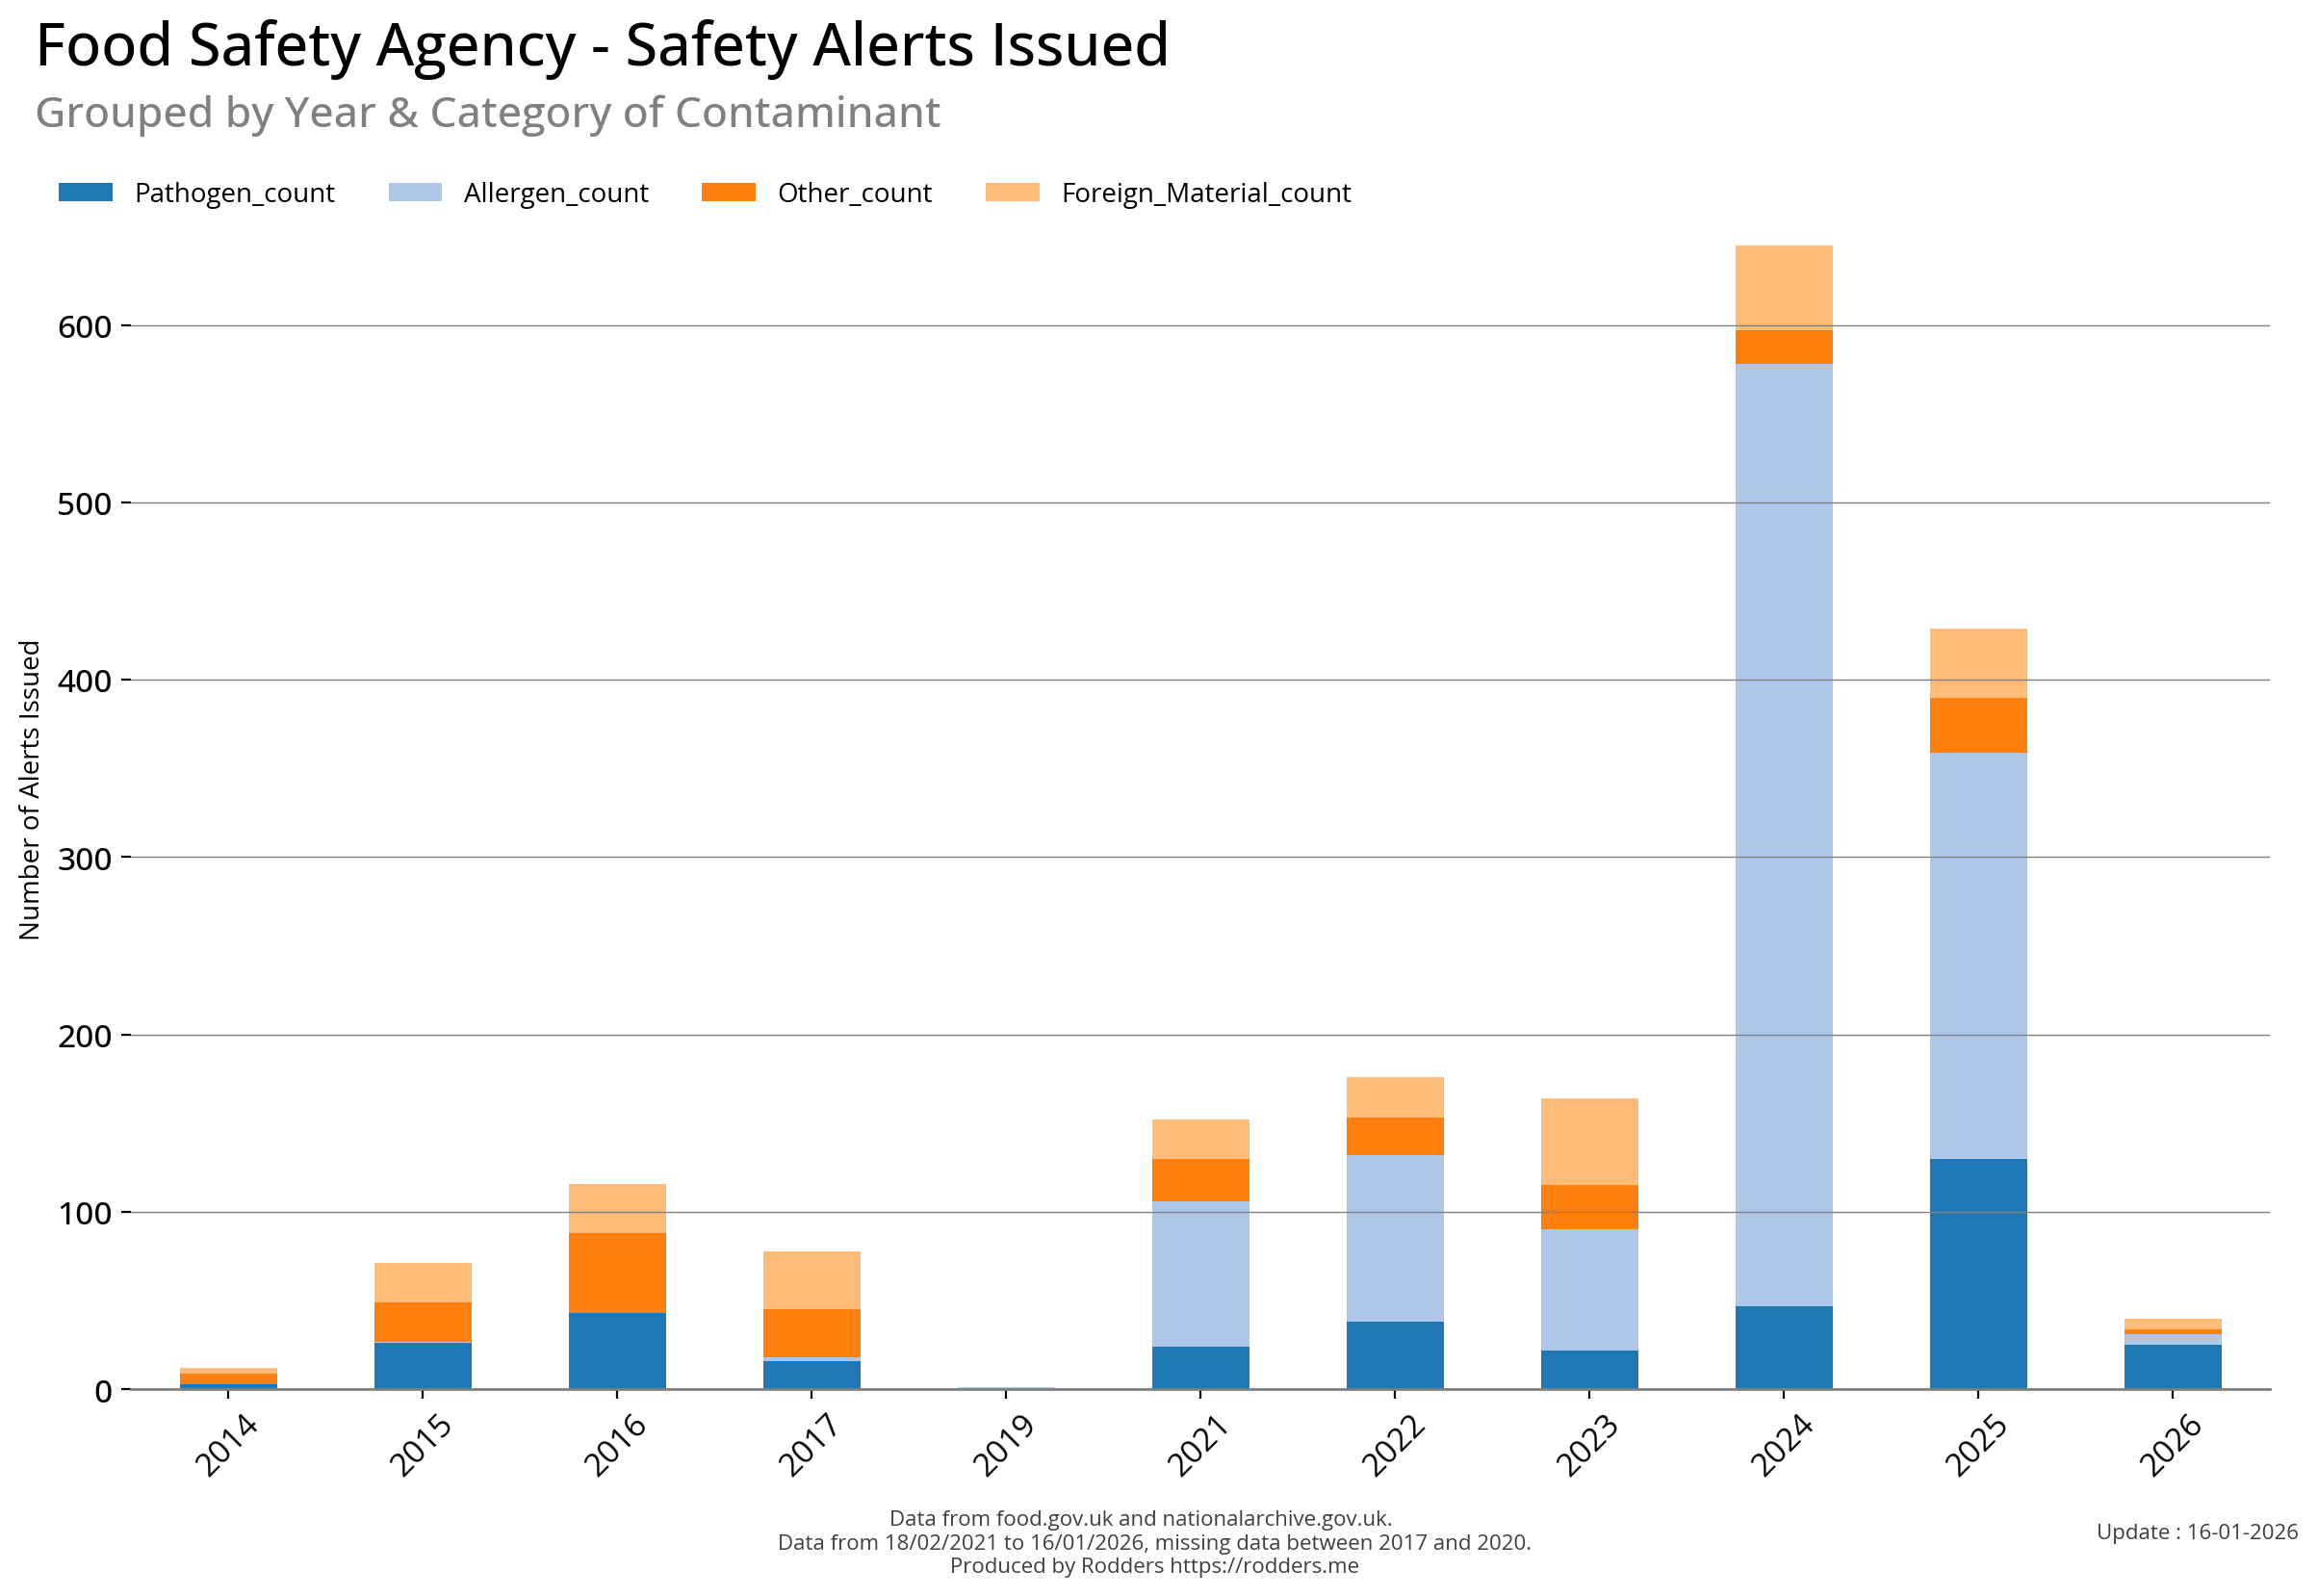
This report presents a comprehensive review of the food safety alerts issued by the UK Food Standards Agency. The analysis provides insights into the frequency, types, and relevant information about each alert, covering an eight year period. The study aims to raise awareness about the importance of monitoring and responding to food safety incidents, highlighting the need for effective public health measures to prevent outbreaks and protect consumers. By analysing the characteristics and trends of these alerts, this report contributes to the understanding of food safety risks and informs policy decisions aimed at promoting a safer food environment.
![]()
Summary Analysis - Food Safety Alerts from food.gov.uk
Food safety is a critical concern that affects public health worldwide. In the United Kingdom, ensuring the quality and safety of the food supply is a top priority for both government agencies and food businesses. The Food Safety Act 1990 sets out the legal framework for food safety in the UK, while regulations such as the Food Information Regulations 2014 (FIR) and the General Food Regulations 2004 (GFR) provide detailed guidance on specific aspects of food production, processing, and sale.
Despite these efforts, foodborne illnesses continue to occur, and food safety alerts are issued regularly by government agencies and other organizations. These alerts typically involve recalls or withdrawals of contaminated or potentially harmful products from the market, and they can have significant economic and public health impacts. For example, the UK's Food Standards Agency (FSA) has a dedicated page on its website where it publishes information about food safety incidents and related recalls [1]. Similarly, the European Food Safety Authority (EFSA) provides comprehensive information on its website about foodborne outbreaks and other safety issues in the EU [2].
This analysis will examine recent food safety alerts issued by food.gov.uk. By examining these alerts, I can identify common themes and trends related to food safety, as well as areas where improvement is needed. This research aims to contribute to a deeper understanding of the complexities surrounding food safety and to inform strategies for improving public health.
References
- [1] Food Standards Agency (FSA). https://www.food.gov.uk/
- [2] European Food Safety Agency (EFSA). https://www.efsa.europa.eu/en
Note:
The number of products for which alerts are issued reported here, is a lot lower than reality. Prior to July 2024, only products mentioned in the search results alert title and sub text are included. Post July 2024, these are now being scraped.
Ingredient-Related Food Safety Alerts: A Review of the 2024 Recalls
This year has seen significant instances of food safety alerts related to ingredients. Two notable recalls have been issued against suppliers:
- FGS Ingredients, where contamination with peanut was detected in their mustard spice, which subsequently affected multiple companies' final products.
- Infinity Foods, where contamination with mustard occurred in over 40 spice/herb products, highlighting the potential for widespread impact on food safety.
A comprehensive analysis of these two recalls reveals a staggering total of 232 product recalls affecting 30 brands across various sectors, including grocers, retailers, takeaways, and restaurants. This underscores the importance of vigilance in monitoring ingredient safety to ensure consumer protection.
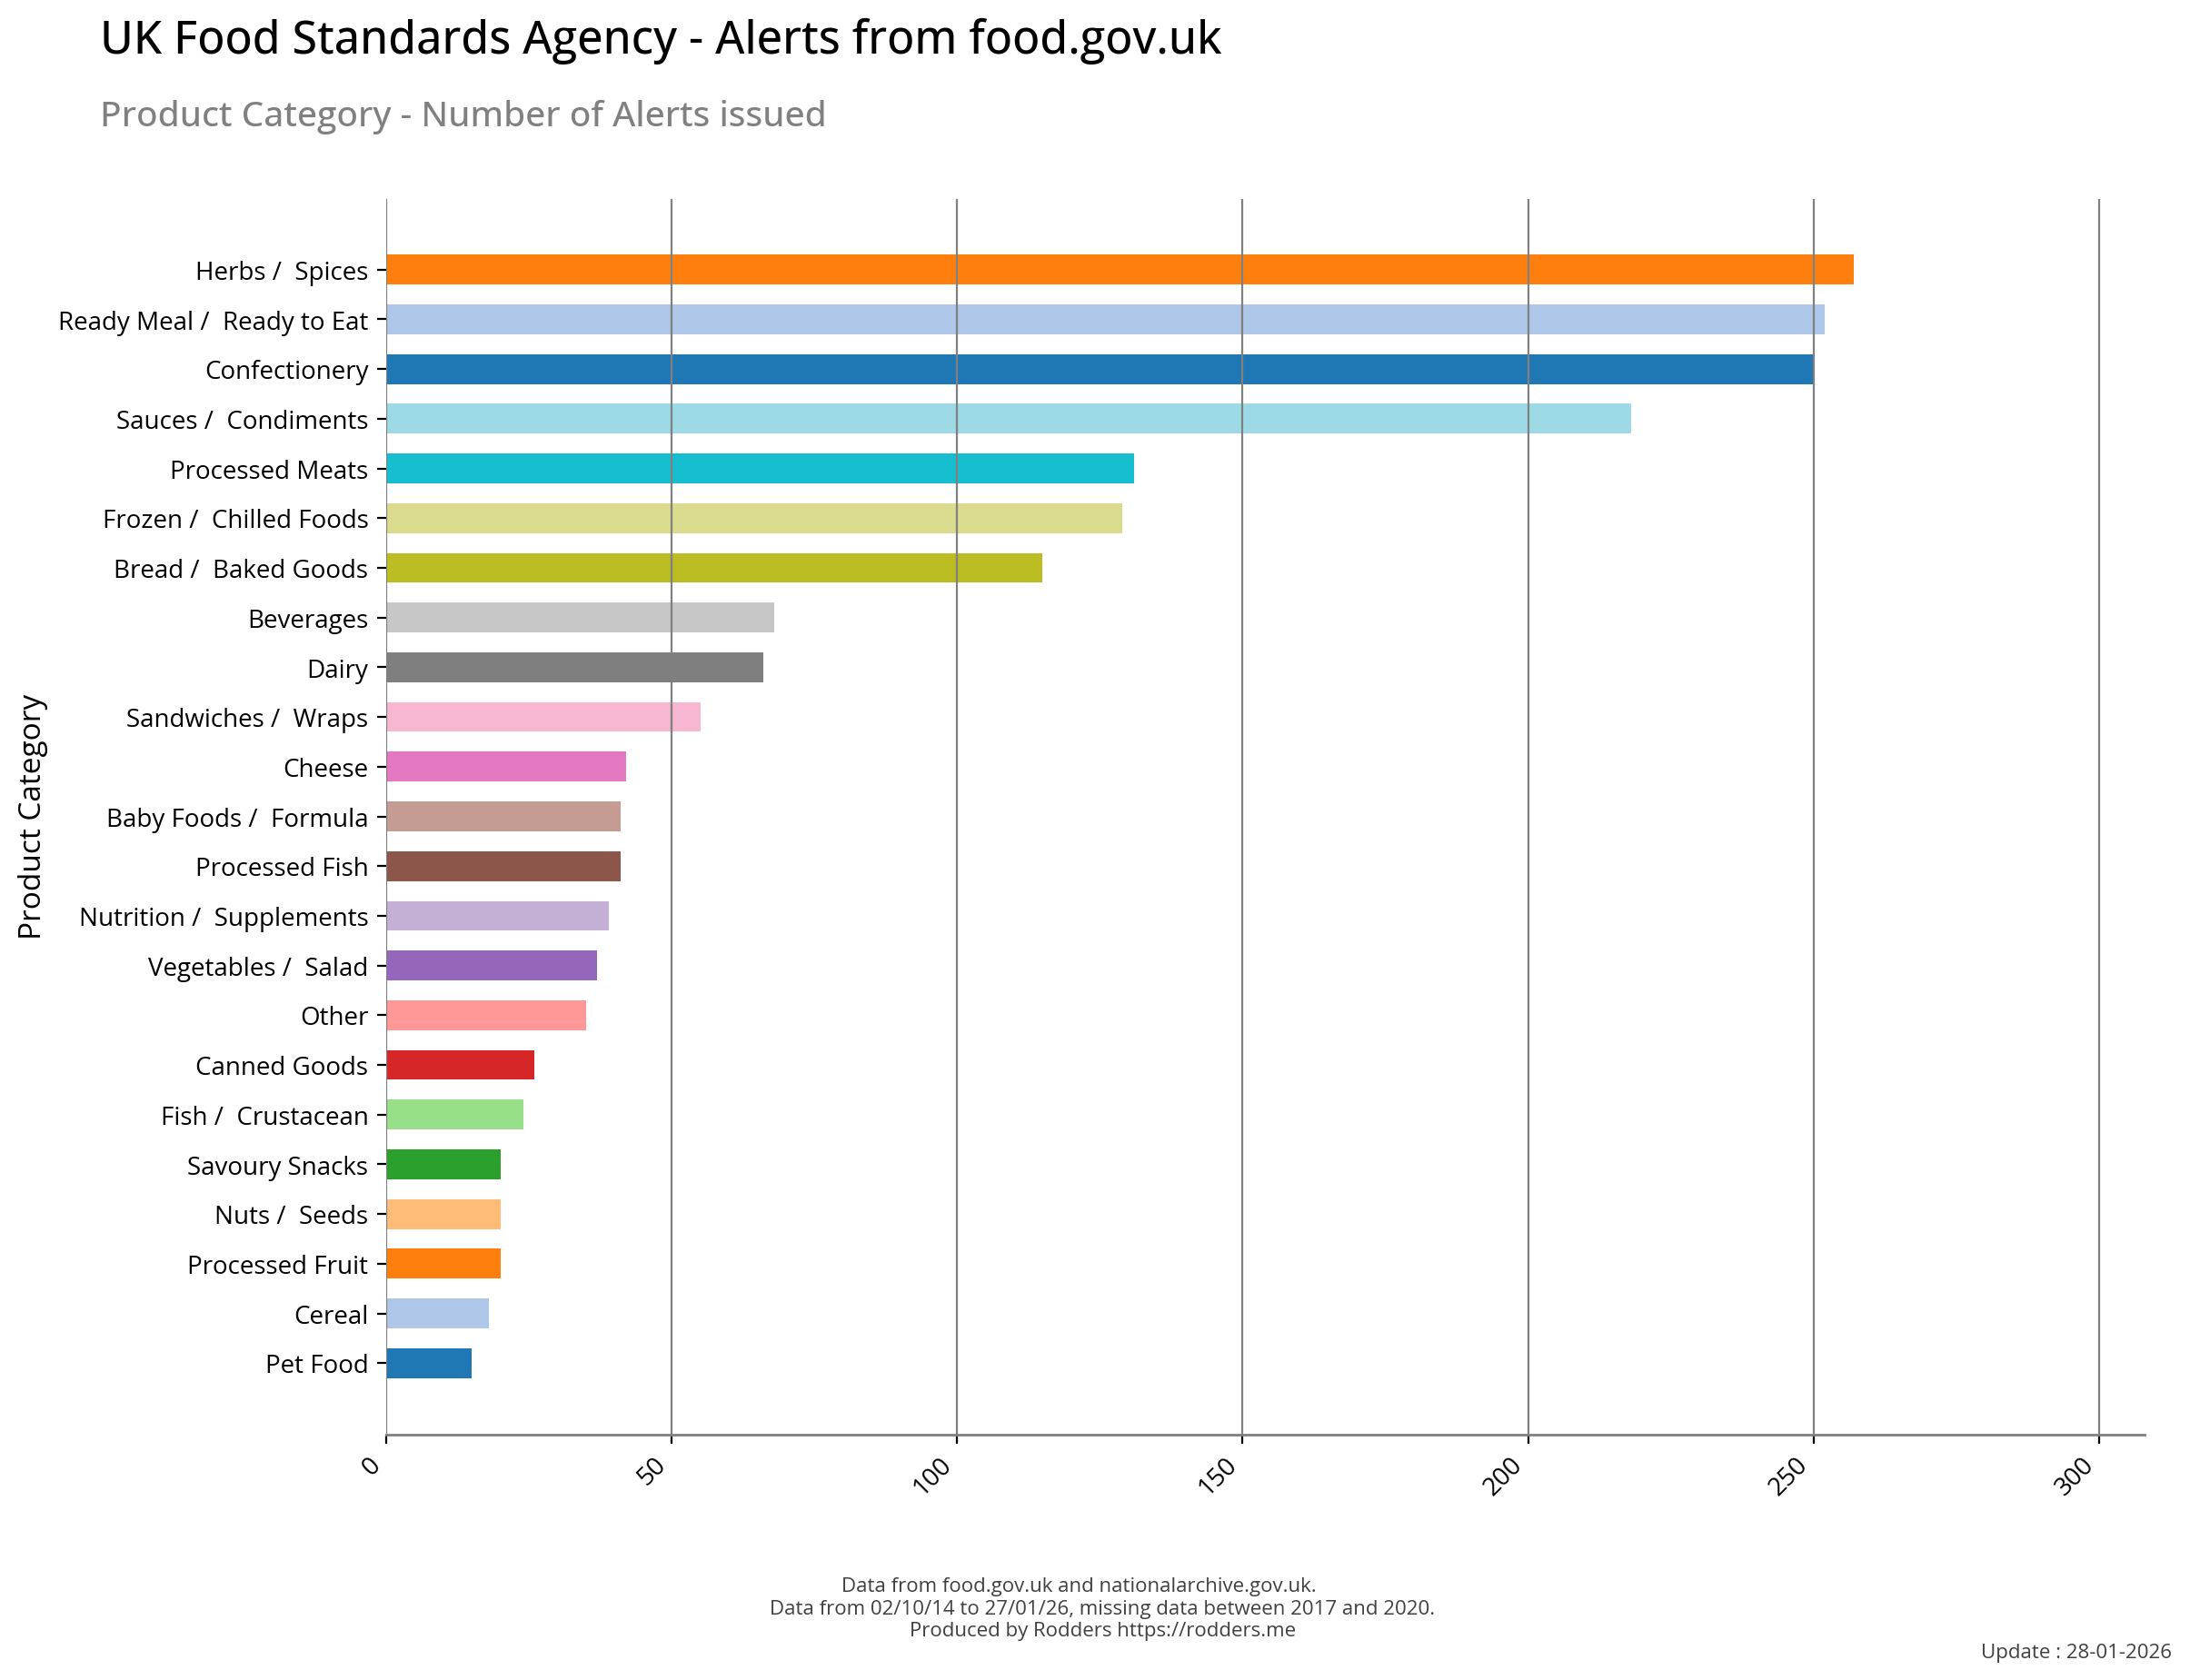
Product Categories most often contaminated
Which product categories are most often contaminated.
 |
 |
Under Other: Vegetables / Salad 5, Milk / Alt Milks 6, Processed Fruit 6, Vegetarian Meat Alternatives 3 |
Under Other: Eggs 1, Bottled Water 1, Tofu 1, Honey 1, Salad 2, Duck Processed 2, Lamb Processed 2, Cooking Oil 3, Coffee / Tea 3, Rice 4, Milk / Alt Milks 6, Fruit Processed 6, Mixed Meat Processed 8, Other Processed 9, Cereal 13, Soft Drinks 13 |
Top
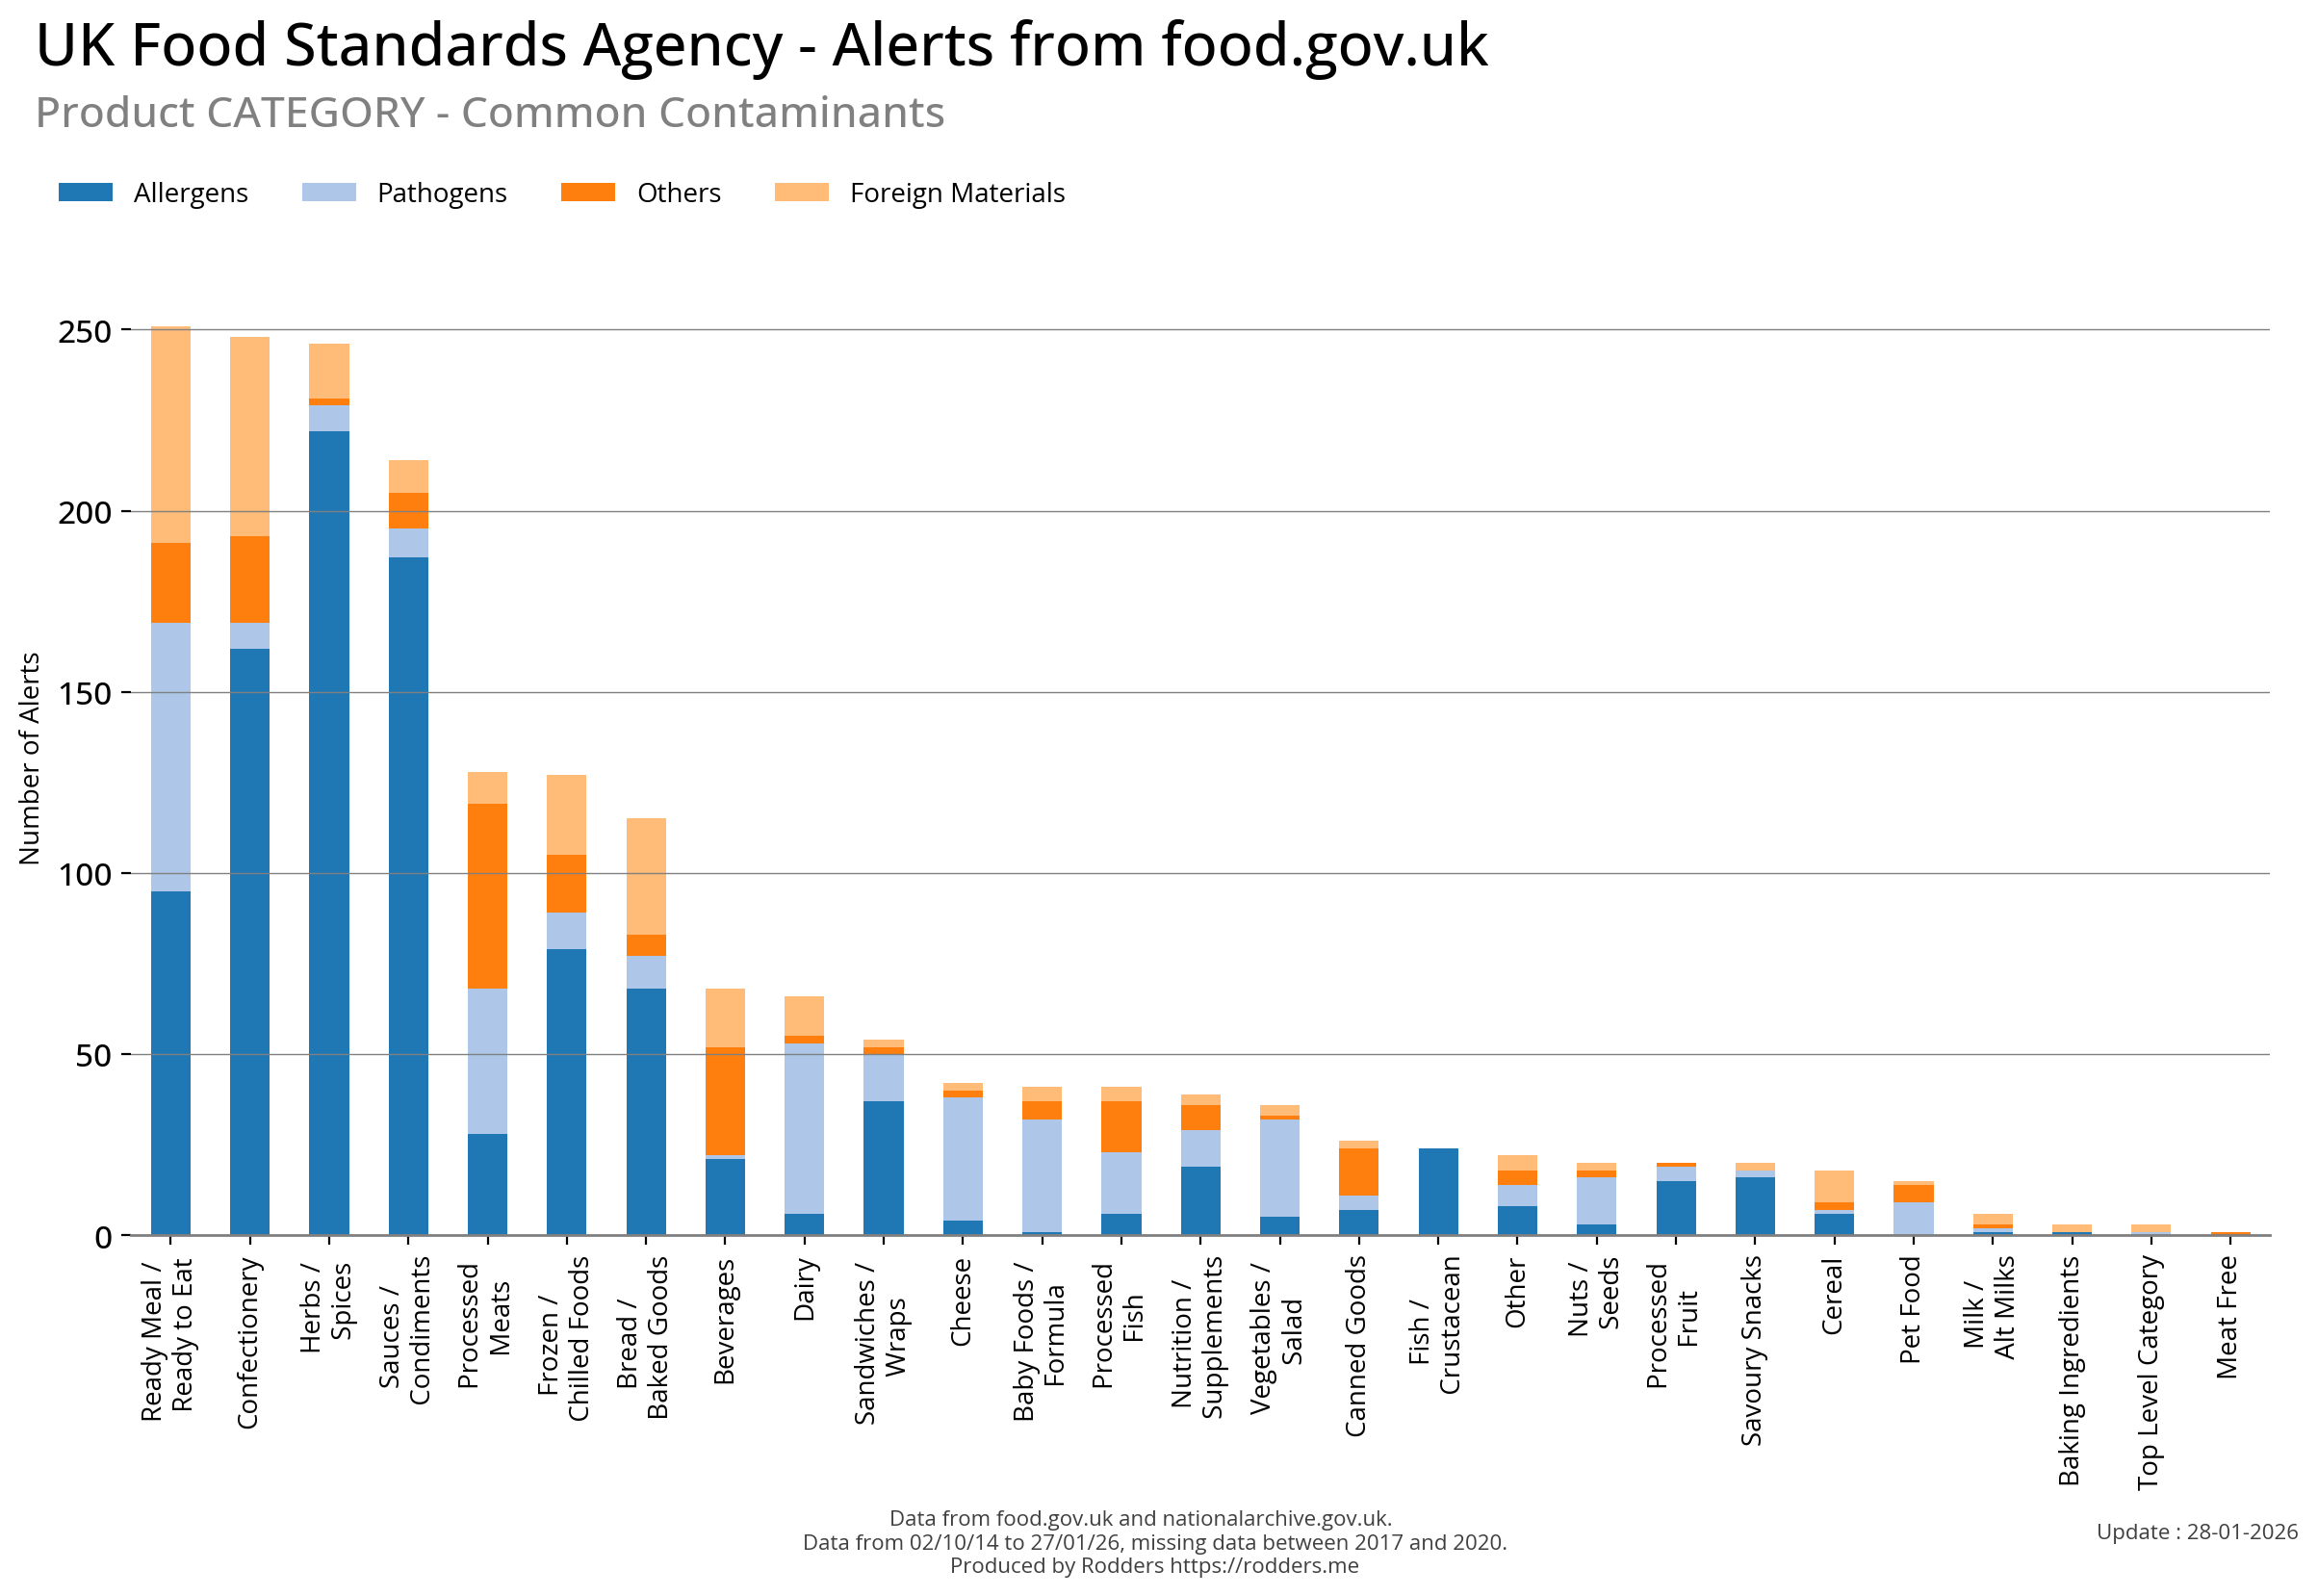
Product Category by Food Contaminants
Which contaminants are most often found in which product category.
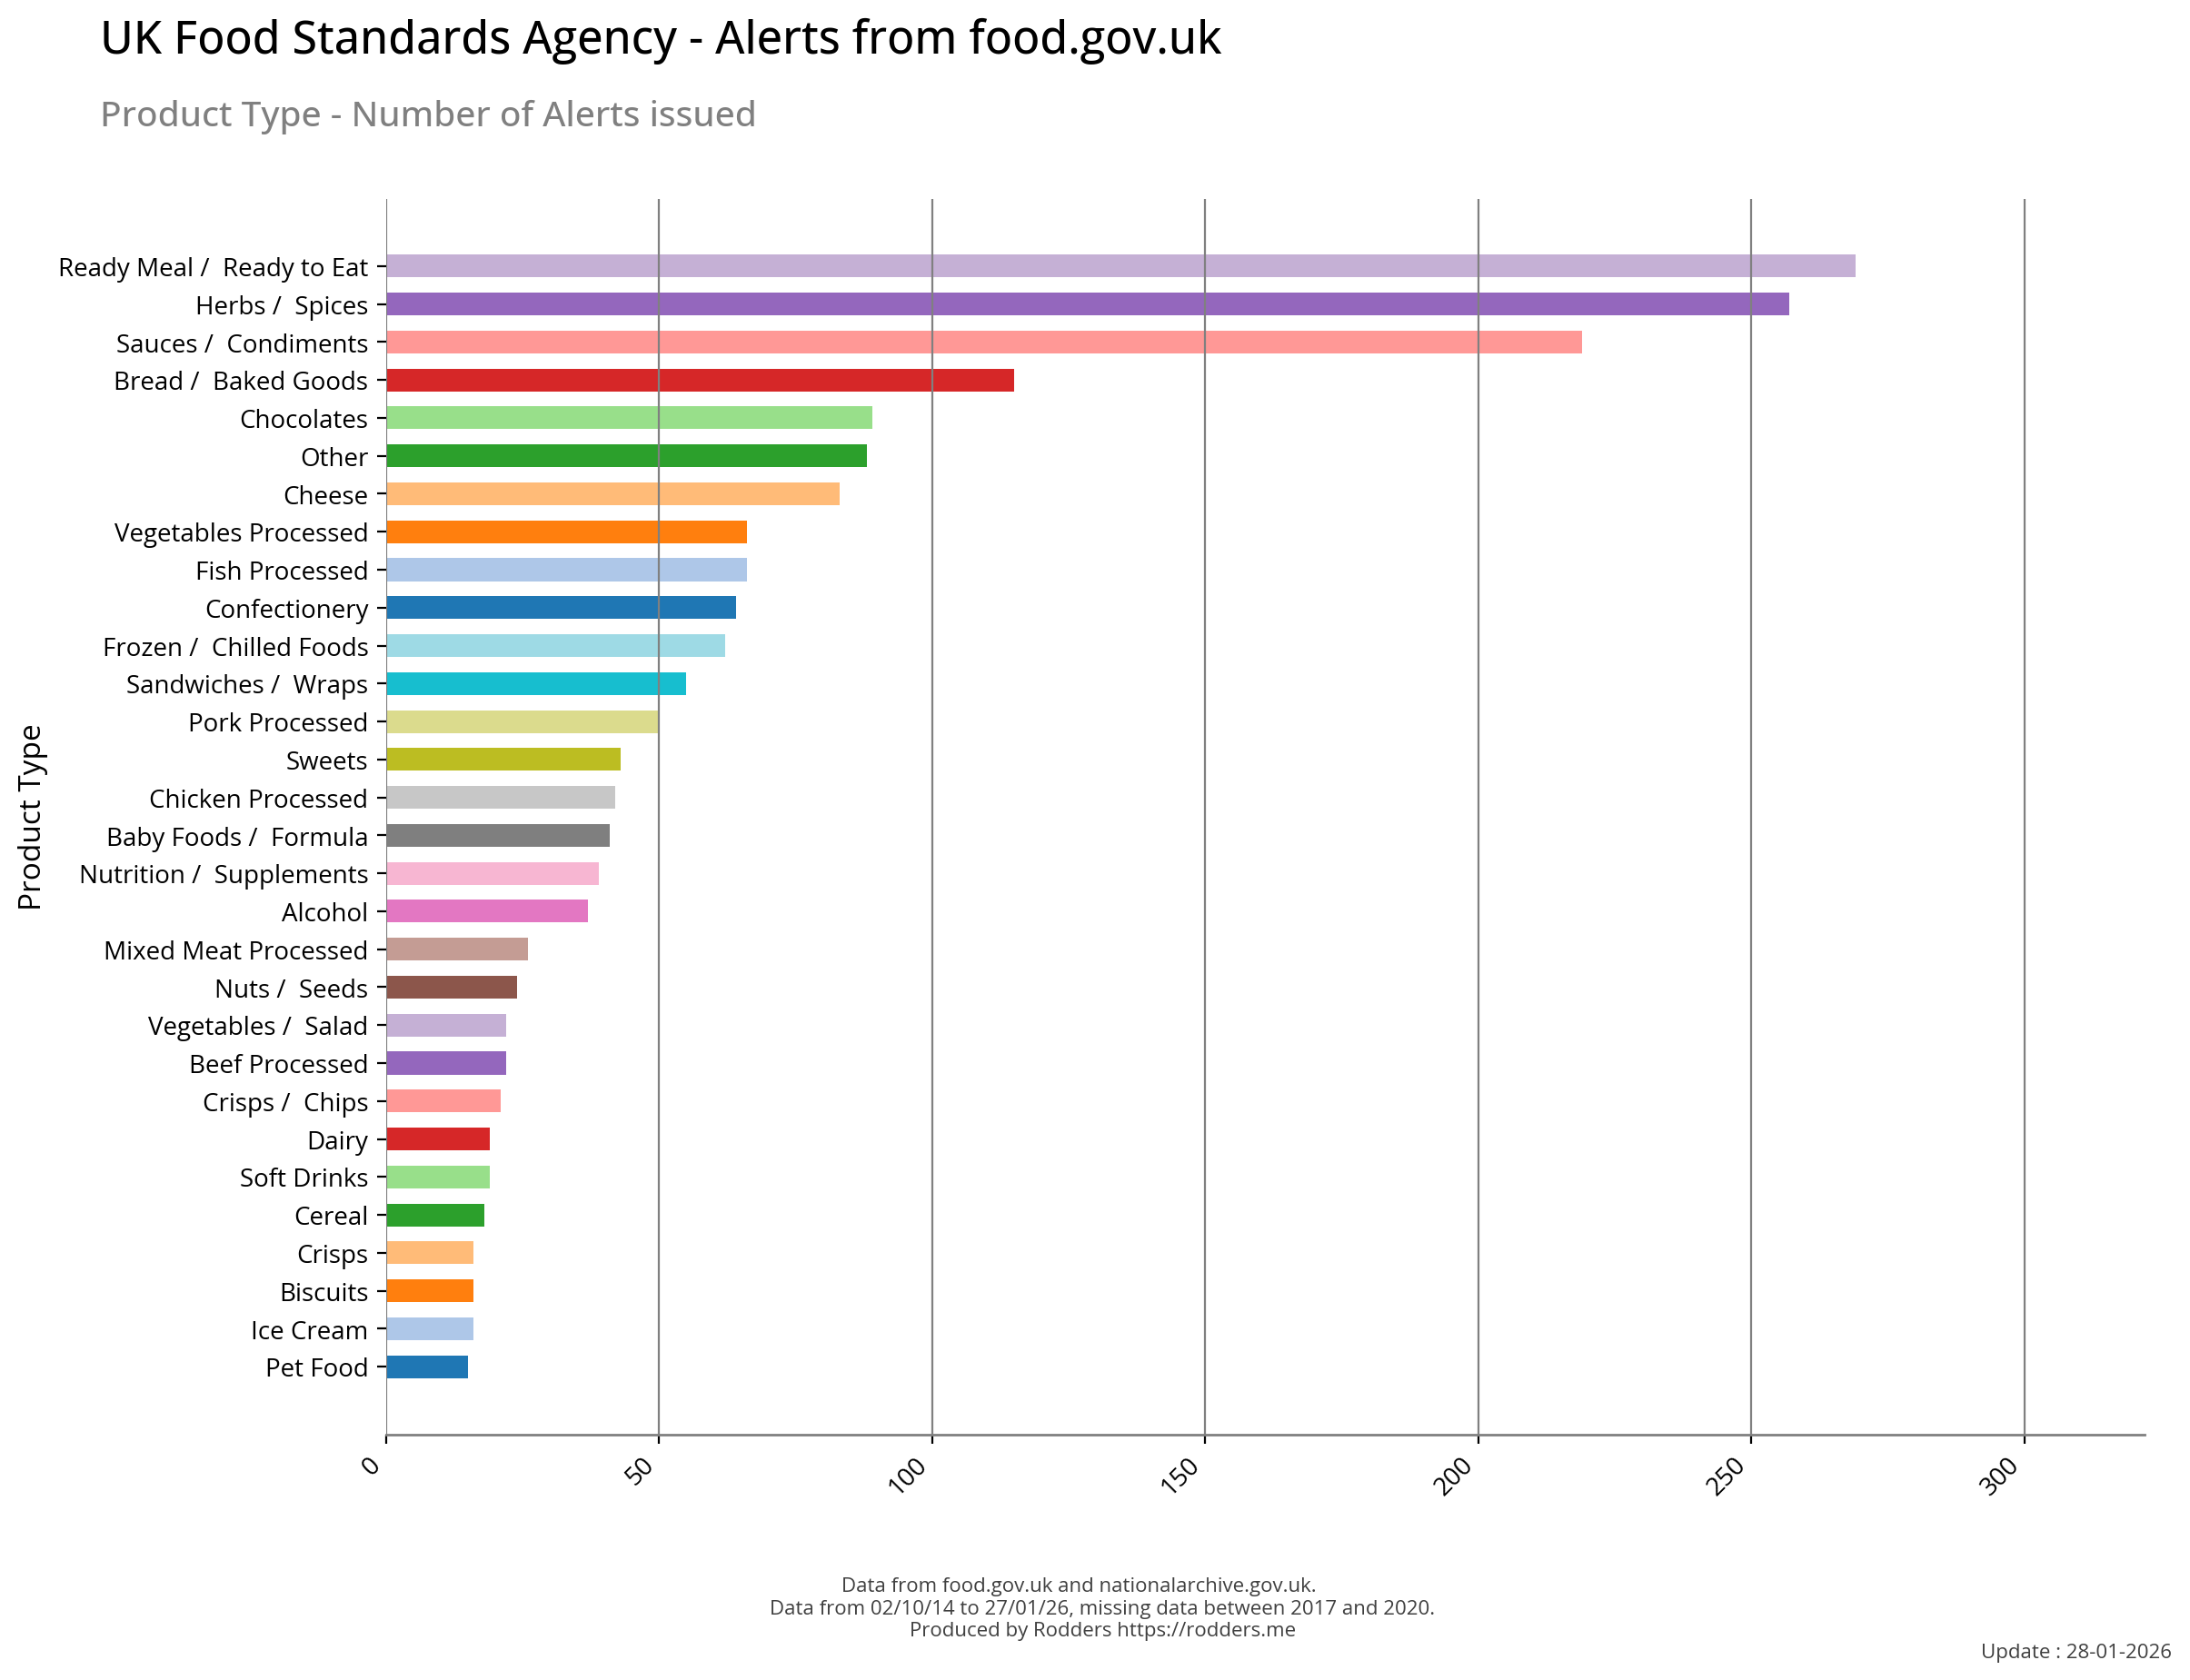
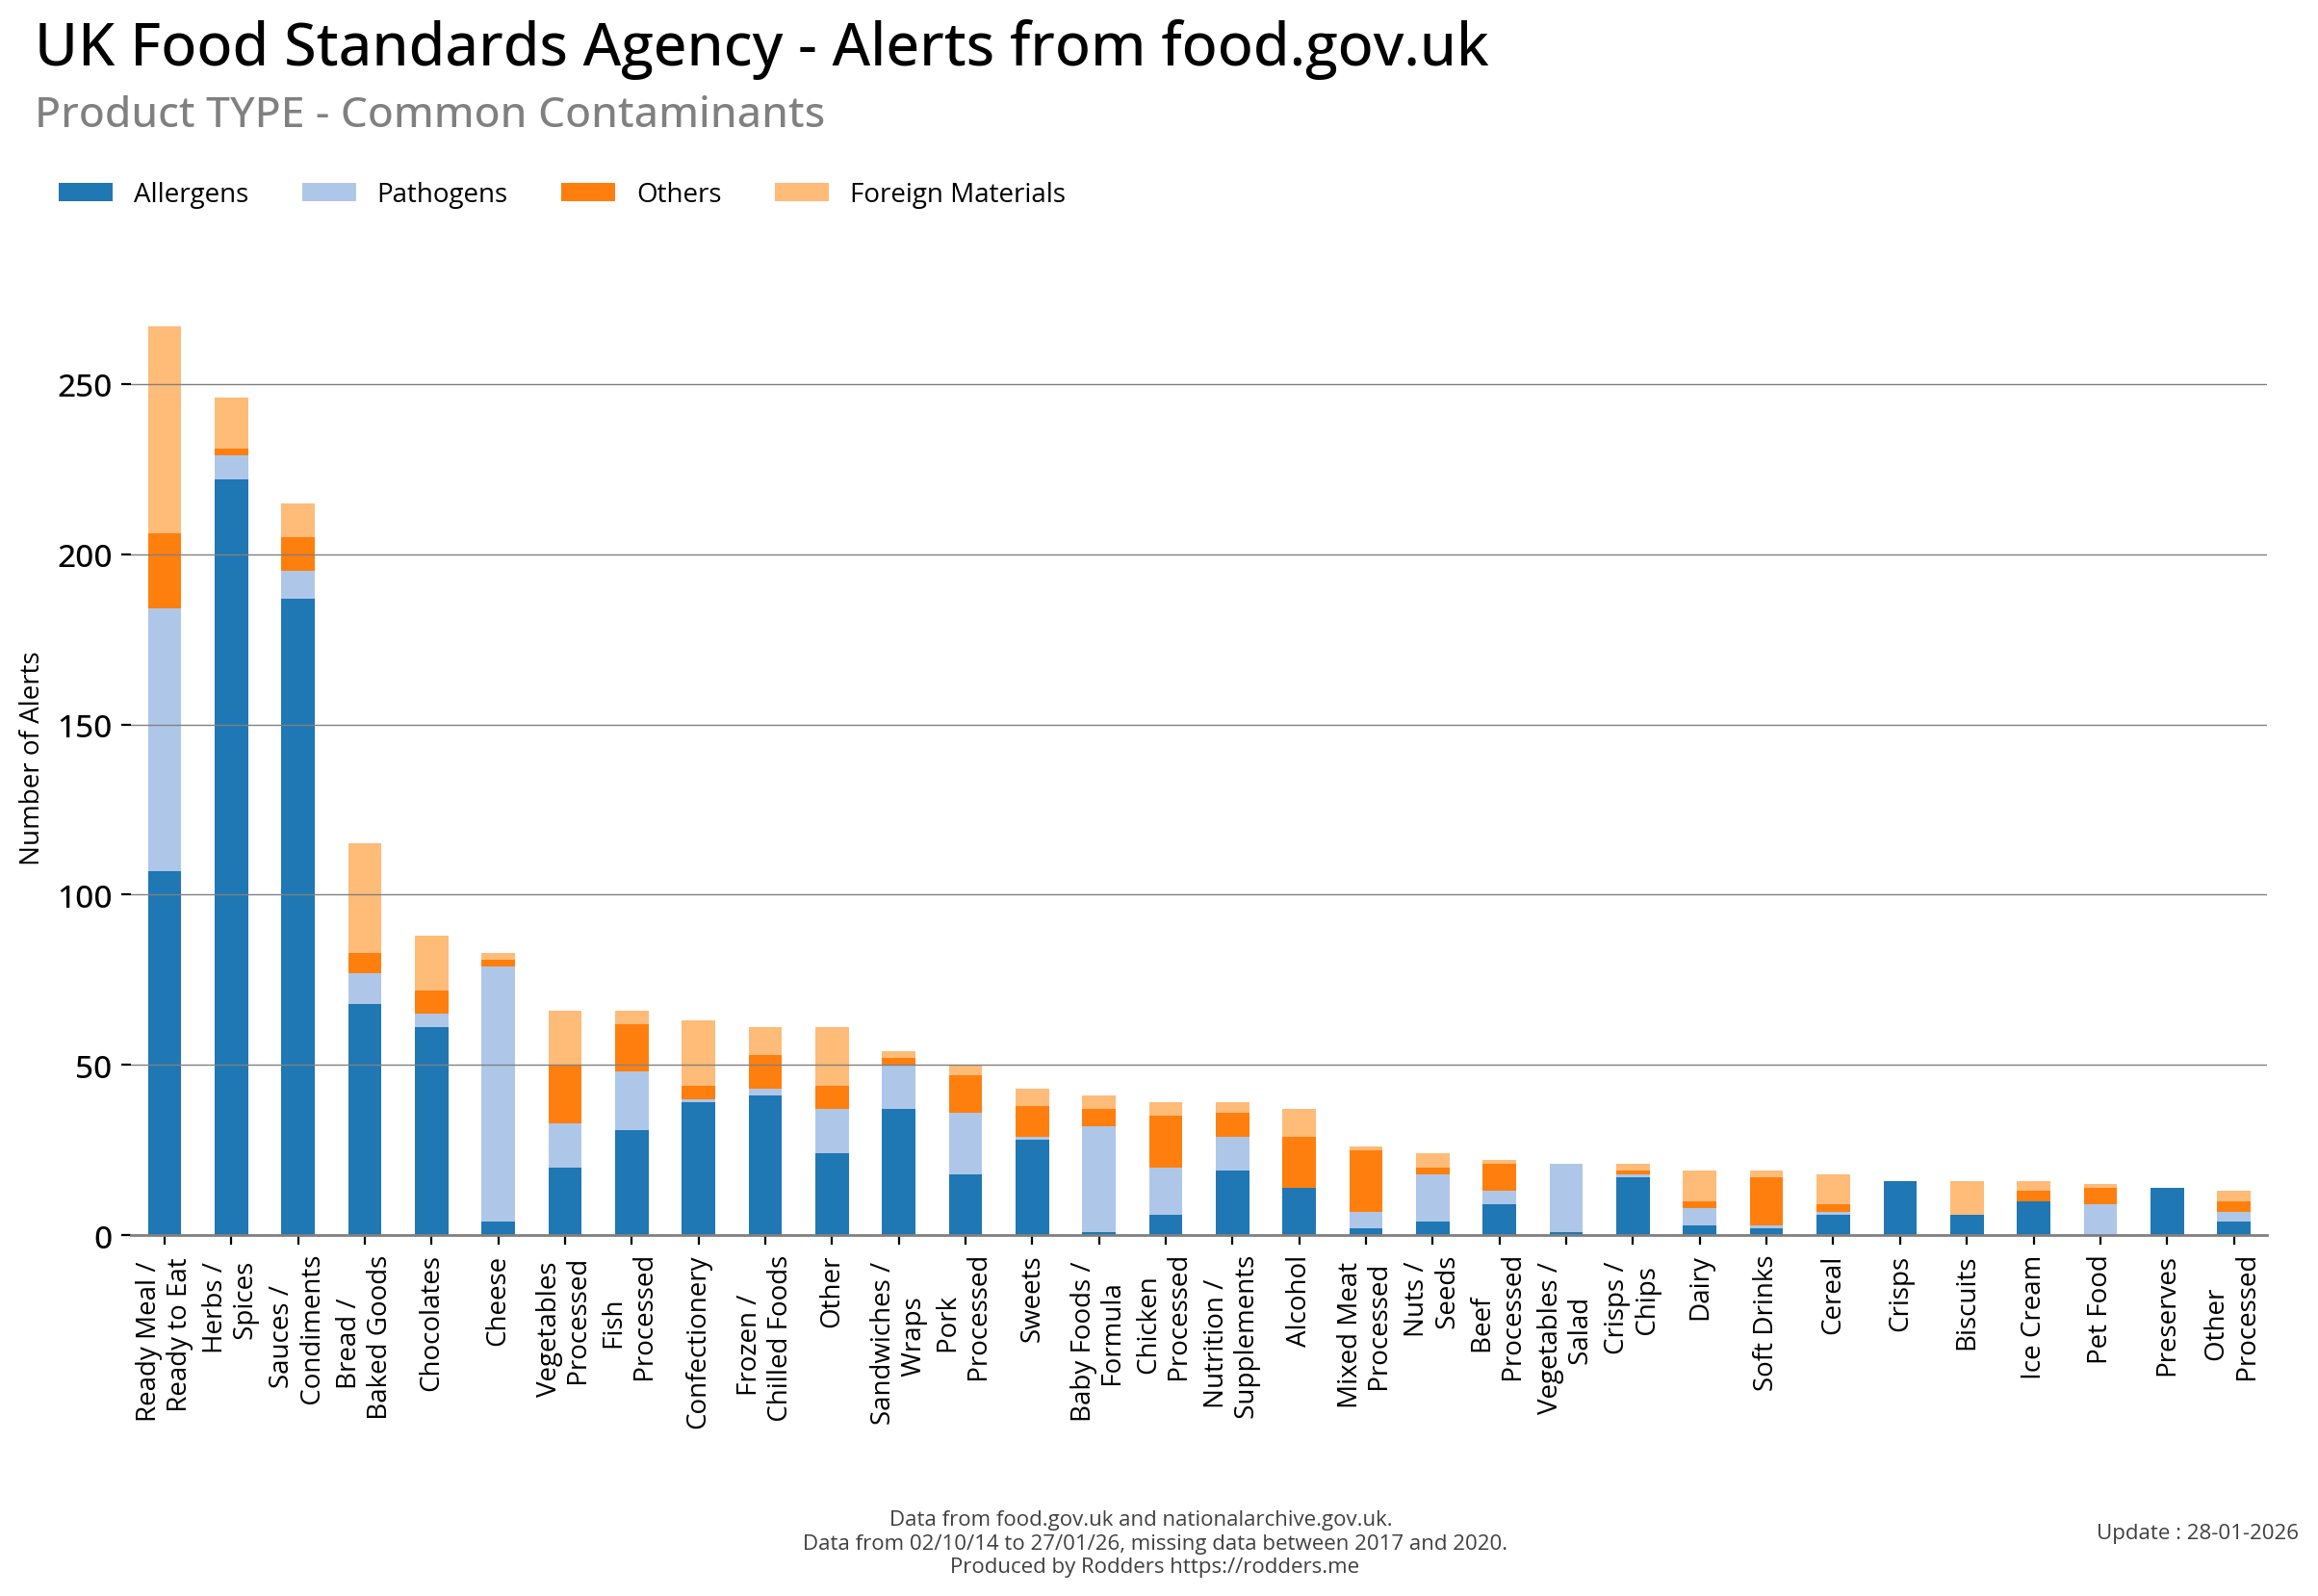
Product TYPE Contaminants
Which contaminants are most often found in which product TYPE.
Product Type breaks out the larger categories such as "Confectionery, Processed Meats" into sub categories. The consolidation into categories is largely to simplify the visualisation where a large number of entries with a low number of alerts would overly complicate the visualisation.
Product Categories / Types
| Product Category | Product Types |
|---|---|
| Beverages | Alcohol, Bottled Water, Coffee / Tea, Soft Drinks |
| Confectionery | Sweets, Crisps, Ice cream etc. |
| Processed Meats | Pork Processed, Chicken Processed, Beef Processed, Duck Processed, Mixed Meats, Lamb Processed |
| Other | Rice, Cooking Oil, Tofu, Meat Alternatives |
Top
Top
Confectionery and Ready Meals / Ready to eat foods : Factors contributing to Food Safety alerts
The number of process steps and the number of ingredients in Confectionery and Ready Meals products could be contributing factors to the higher frequency of food safety alerts.
Here's why :
- More opportunities for contamination : When there are more process steps involved, such as mixing, cooking, and packaging, each step creates an opportunity for contamination or mishandling. This increased complexity can lead to a greater risk of introducing pathogens or other contaminants into the product.
- Higher likelihood of human error : As the number of process steps increases, so does the potential for human error. Fatigue, distractions, or lack of training can all contribute to mistakes that compromise food safety.
- Greater variety of ingredients and allergens : With more ingredients comes a greater variety of potential allergens and intolerances. This can increase the risk of adverse reactions in consumers with specific dietary needs or restrictions.
- Increased complexity in manufacturing and storage : When there are many ingredients, process steps, and product varieties involved, manufacturing and storage processes become increasingly complex. This complexity can create opportunities for contamination or mishandling during production, packaging, and distribution.
- In the case of Ready Meals, which often involve meat, dairy, or eggs, the number of ingredients and process steps might be particularly high. This could contribute to a greater risk of foodborne illnesses if proper handling and processing procedures are not followed.
Other Factors
- Wide consumption and distribution : Confectionery products like chocolates, candies, and baked goods are widely consumed and distributed globally. They're often produced in large quantities and have a long shelf life, making them more likely to reach a broader audience and increase the risk of contamination or mishandling.
- High-risk ingredients : Some confectionery products may contain high-risk ingredients like nuts, dairy, eggs, or soy, which can be allergenic or cause adverse reactions in susceptible individuals. This could lead to more alert submissions related to food allergies or intolerances.
- Complex supply chains : Confectionery products often have complex supply chains involving multiple manufacturers, distributors, and retailers. This complexity can create opportunities for contamination or mishandling at various stages of production, storage, or transportation, leading to increased alert rates.
- Ready-to-eat/Ready Meals : Convenience vs. Risk: Ready-to-eat/Ready Meals are designed for convenience, which can also increase the risk of contamination or mishandling. These products often require multiple handling and preparation steps, making it easier for pathogens to contaminate them. The fact that these products are already prepared for consumption might contribute to a higher alert rate from consumers not storing the product correctly.
- Increased regulatory scrutiny : As consumers become more health-conscious and demand greater transparency in food production, regulatory agencies like the UK's Food Standards Agency (FSA) may be more likely to issue alerts related to confectionery and Ready Meals. This could be due to the perceived risks associated with these products or increased public awareness of potential hazards.
- Higher incidence of adverse reactions : Confectionery products can contain high levels of added sugars, which have been linked to various health issues, including gastrointestinal symptoms. Similarly, Ready Meals might be more prone to contamination due to their higher moisture content and the presence of meat, dairy, or eggs, which are common sources of foodborne illnesses.
- Industry dynamics : The confectionery and Ready Meal industries may experience more frequent changes in production processes, formulations, or suppliers, which can increase the risk of contamination or mishandling. This could lead to a higher alert rate as regulators respond to these changes.
These factors are not exhaustive, but they might contribute to the high frequency of food safety alerts for confectionery and Ready Meals products.
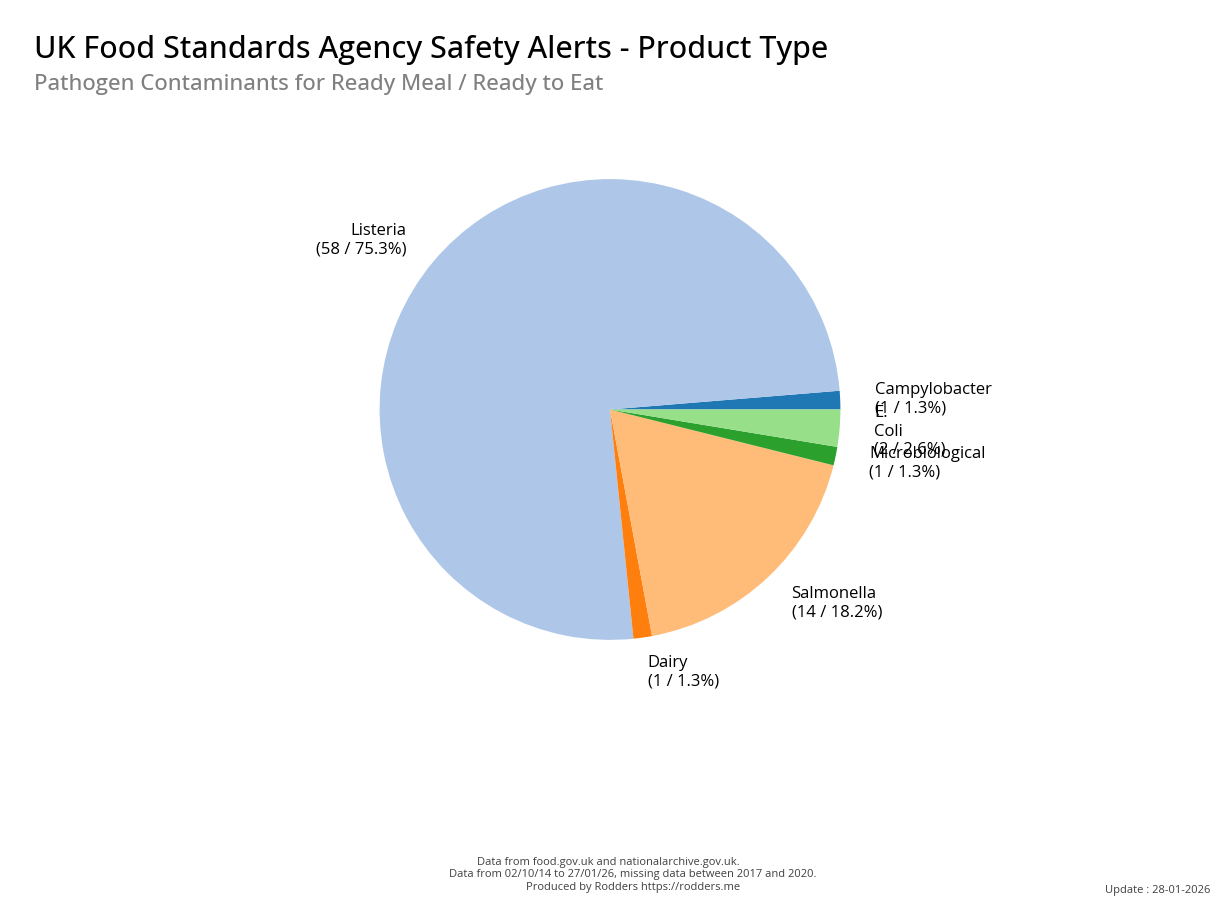
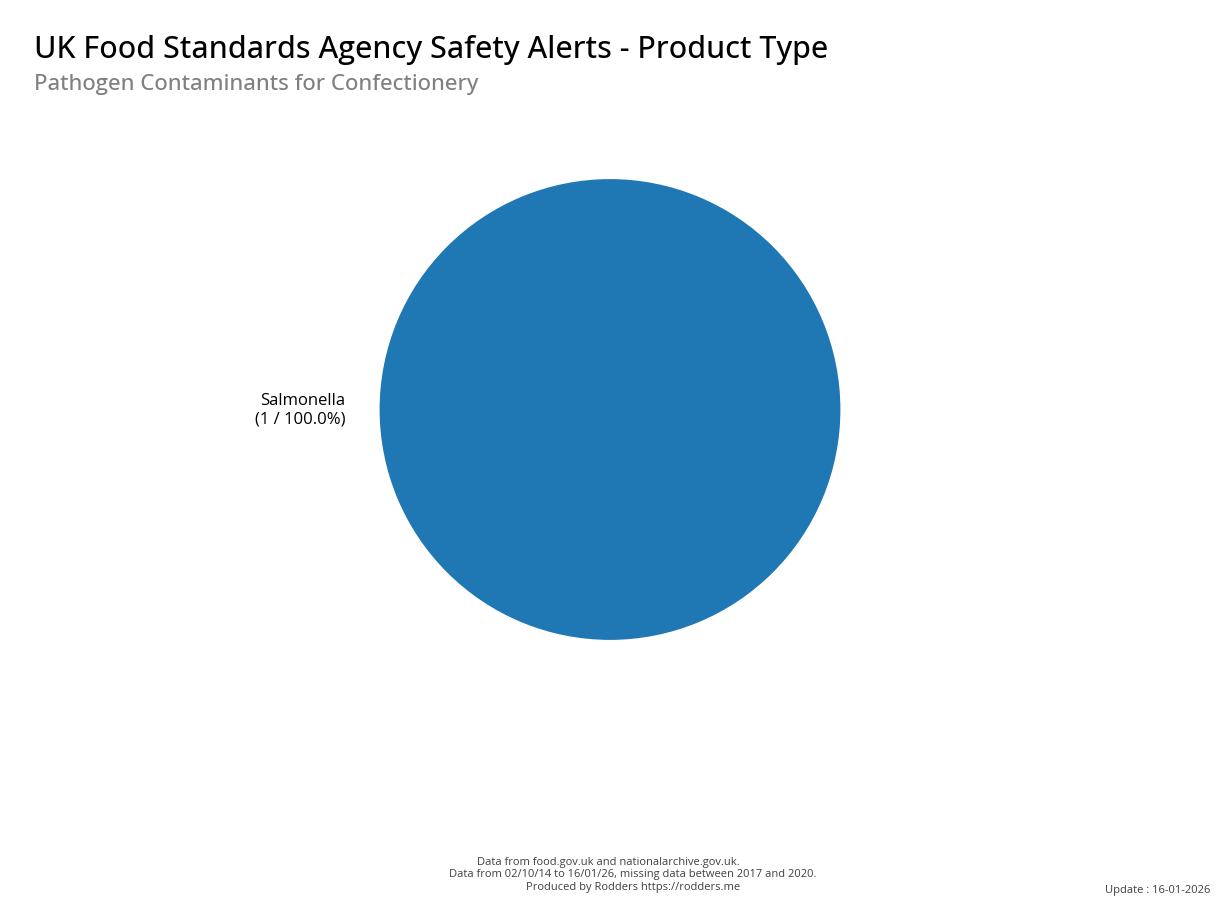
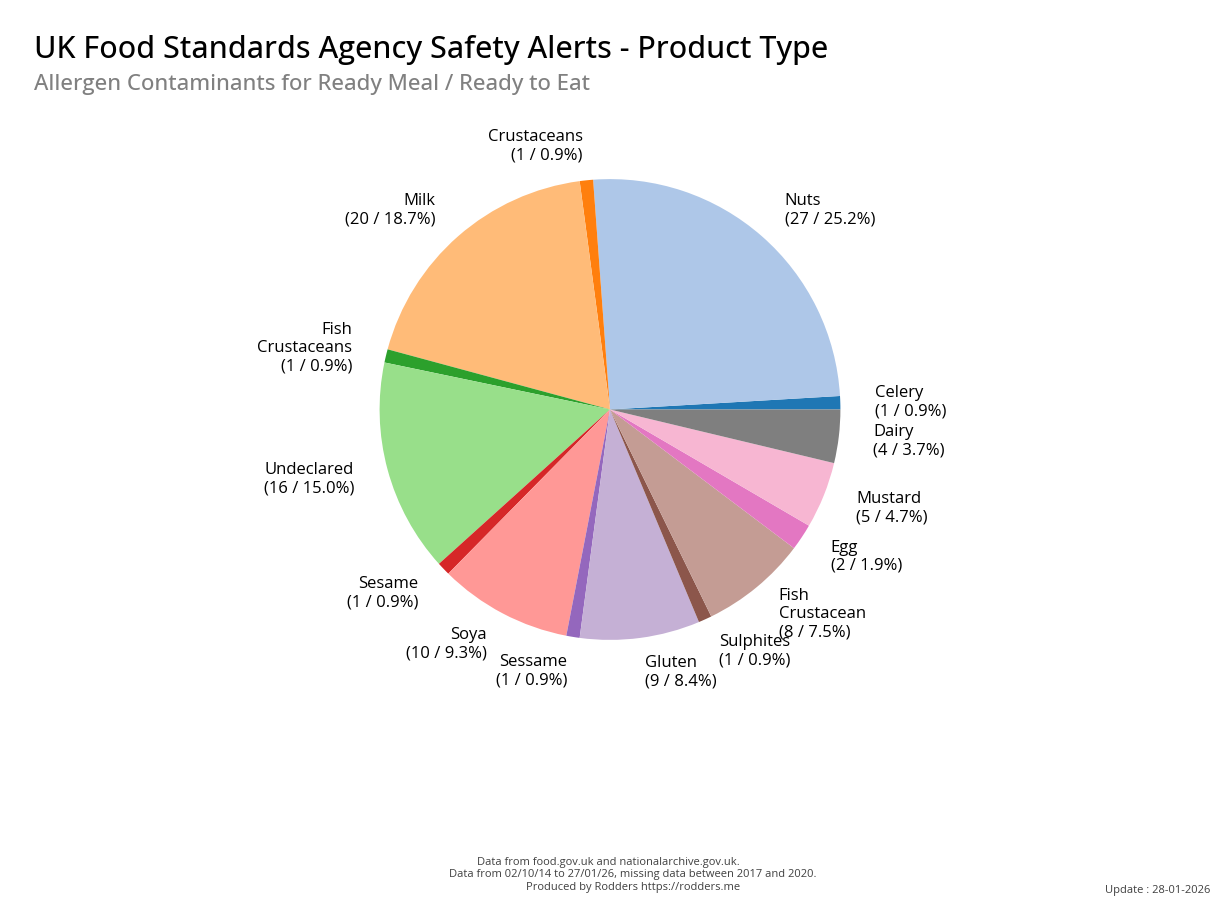
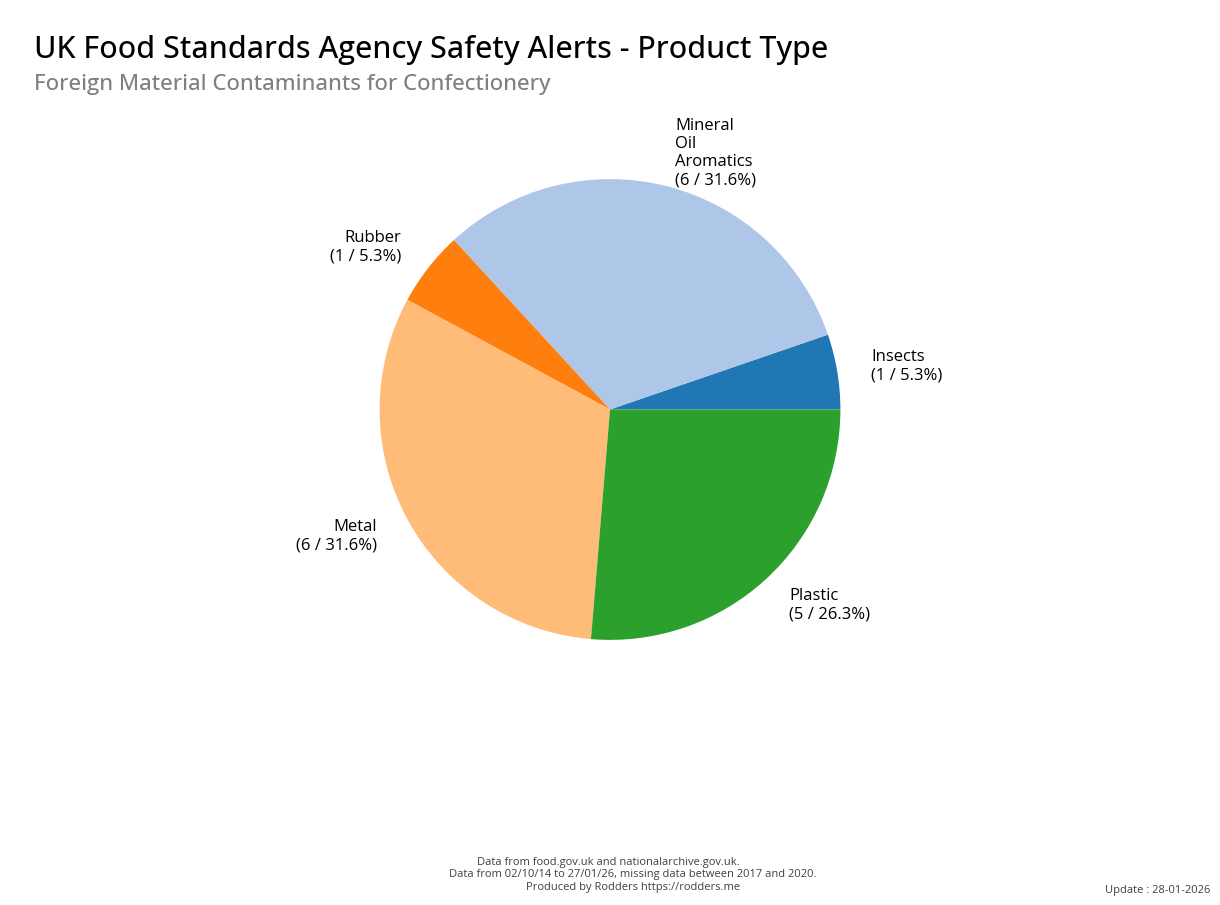
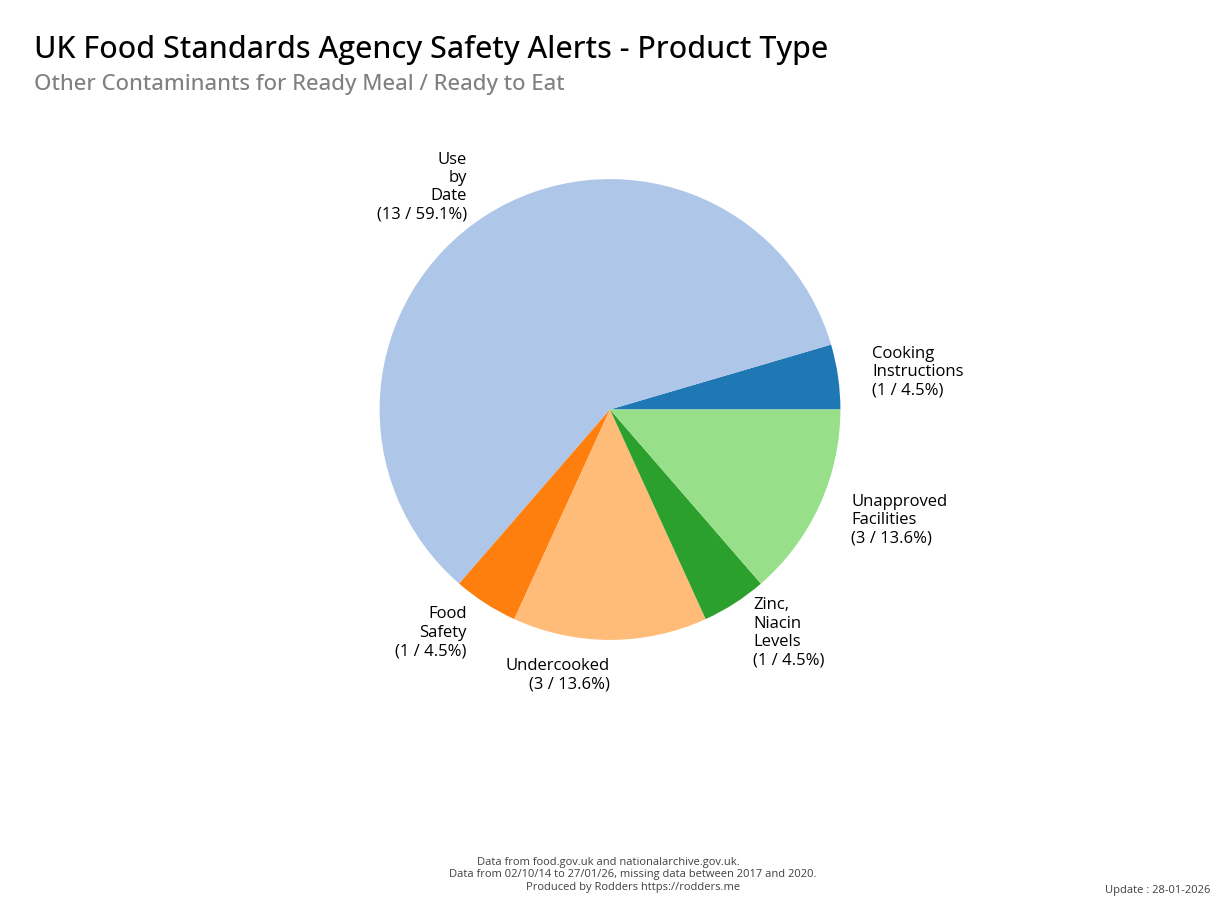
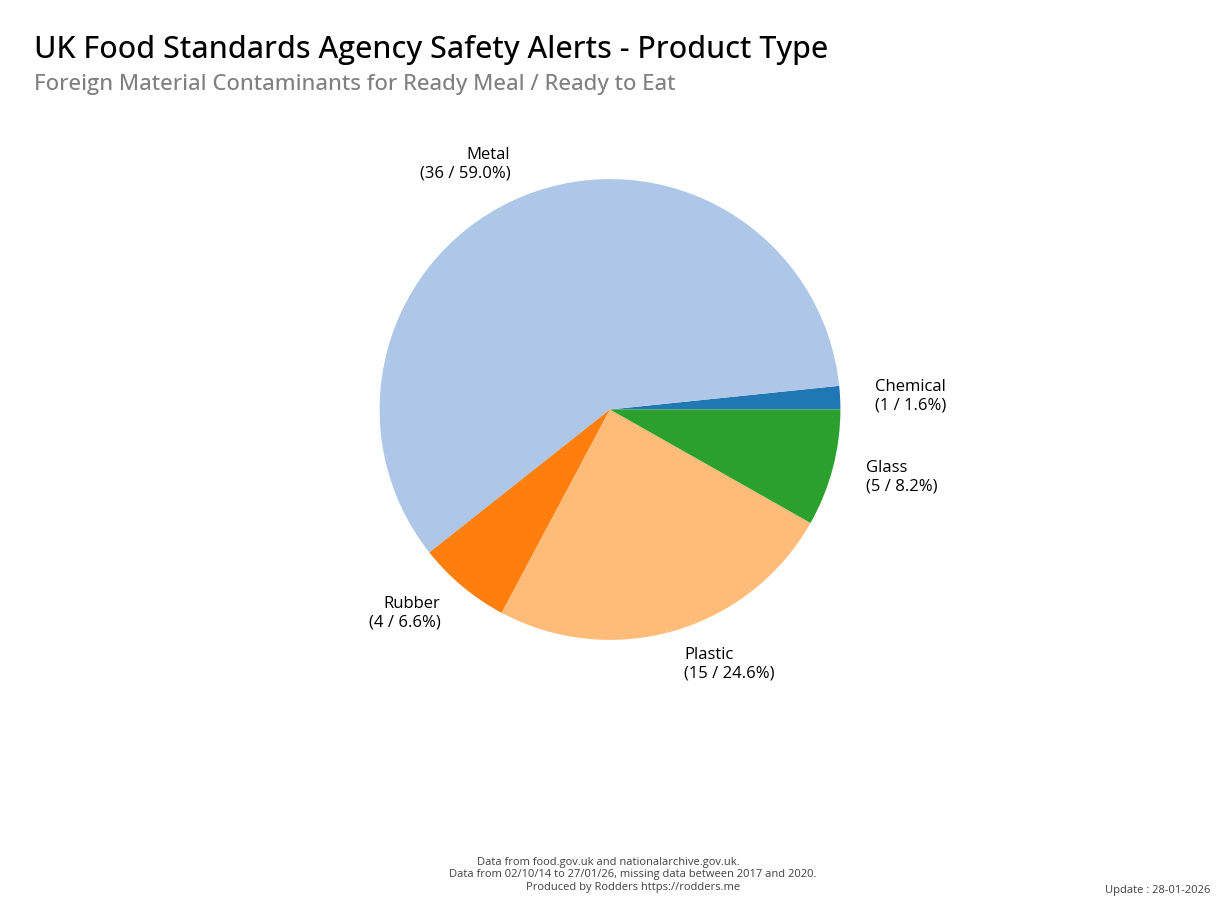
Confectionery and Ready Meals / Ready to eat foods : Most common Contaminants
Which are the top contaminants by contaminant category.
| Ready Meals / Ready to Eat | Confectionery |
|---|---|
 |
 |
 |
 |
 |
 |
 |
 |
Top
Repeat Offenders
The Grocer Channel
As the main distribution point for food to retail customers, the supermarkets obviously appear repeatedly in the Food Safety Alerts, these are most often for own branded products. Currently the FSA does not collect data on the source manufacturer of the product. This makes analysis of repeat offenders impossible at this stage, despite it being a legal requirement that packaging is printed with the original supplier, the FSA does not collect this data consistently.
The analysis of food safety alerts issued by the UK Food Safety Agency reveals a concerning trend. A significant proportion of these alerts - in fact, a surprising 34% - are related to own-brand products sold by major supermarkets. This is equivalent to 326 individual alerts issued to supermarkets across the country. These alerts highlight instances where food products have been found to pose a risk to consumer health and safety, whether due to contamination, mislabelling, or other issues.
Importers and Manufacturers
Upon examining the food safety data, it becomes apparent that while there are some repeat instances from the same manufacturer, these incidents are often scattered across an extended period of time. This pattern suggests that rather than being indicative of endemic problems or systemic failures within a company, these isolated events may be more likely the result of one-off mistakes or random fluctuations. Moreover, when analysing the distribution of incidents across manufacturers, I observed that most companies tend to have only a few incidents, and these are typically clustered together in time, implying a single incident rather than an ongoing issue. This analysis implies that while some manufacturers may experience occasional slip-ups, they are not necessarily indicative of deep-seated problems or a culture of non-compliance.
The Top Brands
It should be noted that Food Safety incidents in the UK, the number of food alerts issued, is very low when compared to the number of products in the market and caution should be applied when drawing any conclusions. Generally speaking, UK Food Safety is high and the Food Standards Agency has implemented robust measures to ensure the safety of consumers, including stringent testing protocols, effective recall procedures, and transparent communication channels. The agency's proactive approach and commitment to public health have helped maintain a strong reputation for food safety in the UK.
- There are over 360 different suppliers identified in the dataset. The main categories of supplier include : Grocer, Importer, Manufacturer (Contract Manufacturer) and Retail Brand
- For example it should come as no surprise to find that own brand products from major retailers (supermarkets) make up more than 34% of the alerts issues.
| Supplier_Type | 2014 | 2015 | 2016 | 2017 | 2019 | 2021 | 2022 | 2023 | 2024 | 2025 | 2026 | total |
|---|---|---|---|---|---|---|---|---|---|---|---|---|
| Grocer | 0 | 0 | 0 | 0 | 0 | 0 | 0 | 0 | 0 | 0 | 2 | 2 |
| Grocer % | 0% | 0% | 0% | 0% | 0% | 0% | 0% | 0% | 0% | 0% | 1% | 0% |
| Grocer / Manufacturer / Importer | 0 | 0 | 0 | 0 | 0 | 0 | 0 | 0 | 0 | 2 | 0 | 2 |
| Importer | 1 | 0 | 1 | 0 | 0 | 10 | 6 | 2 | 5 | 37 | 5 | 67 |
| Importer % | 8% | 0% | 1% | 0% | 0% | 6% | 3% | 1% | 1% | 8% | 3% | 3% |
| Mannufacturer | 0 | 0 | 0 | 0 | 0 | 0 | 0 | 0 | 0 | 2 | 0 | 2 |
| Manufacturer | 10 | 41 | 87 | 57 | 1 | 88 | 110 | 83 | 599 | 328 | 160 | 1564 |
| Manufacturer % | 83% | 58% | 75% | 73% | 100% | 57% | 62% | 51% | 92% | 74% | 91% | 77% |
| Unknown | 1 | 30 | 24 | 18 | 0 | 56 | 59 | 79 | 48 | 75 | 8 | 398 |
| Unknown % | 8% | 42% | 21% | 23% | 0% | 36% | 34% | 48% | 7% | 17% | 5% | 19% |
| Wholesale | 0 | 0 | 4 | 3 | 0 | 0 | 1 | 0 | 0 | 0 | 0 | 8 |
| Wholesale % | 0% | 0% | 3% | 4% | 0% | 0% | 1% | 0% | 0% | 0% | 0% | 0% |
| NaN | 0% | 0% | 0% | 0% | 0% | 0% | 0% | 0% | 0% | 0% | 0% | 0% |
| NaN | 0% | 0% | 0% | 0% | 0% | 0% | 0% | 0% | 0% | 0% | 0% | 0% |
Top
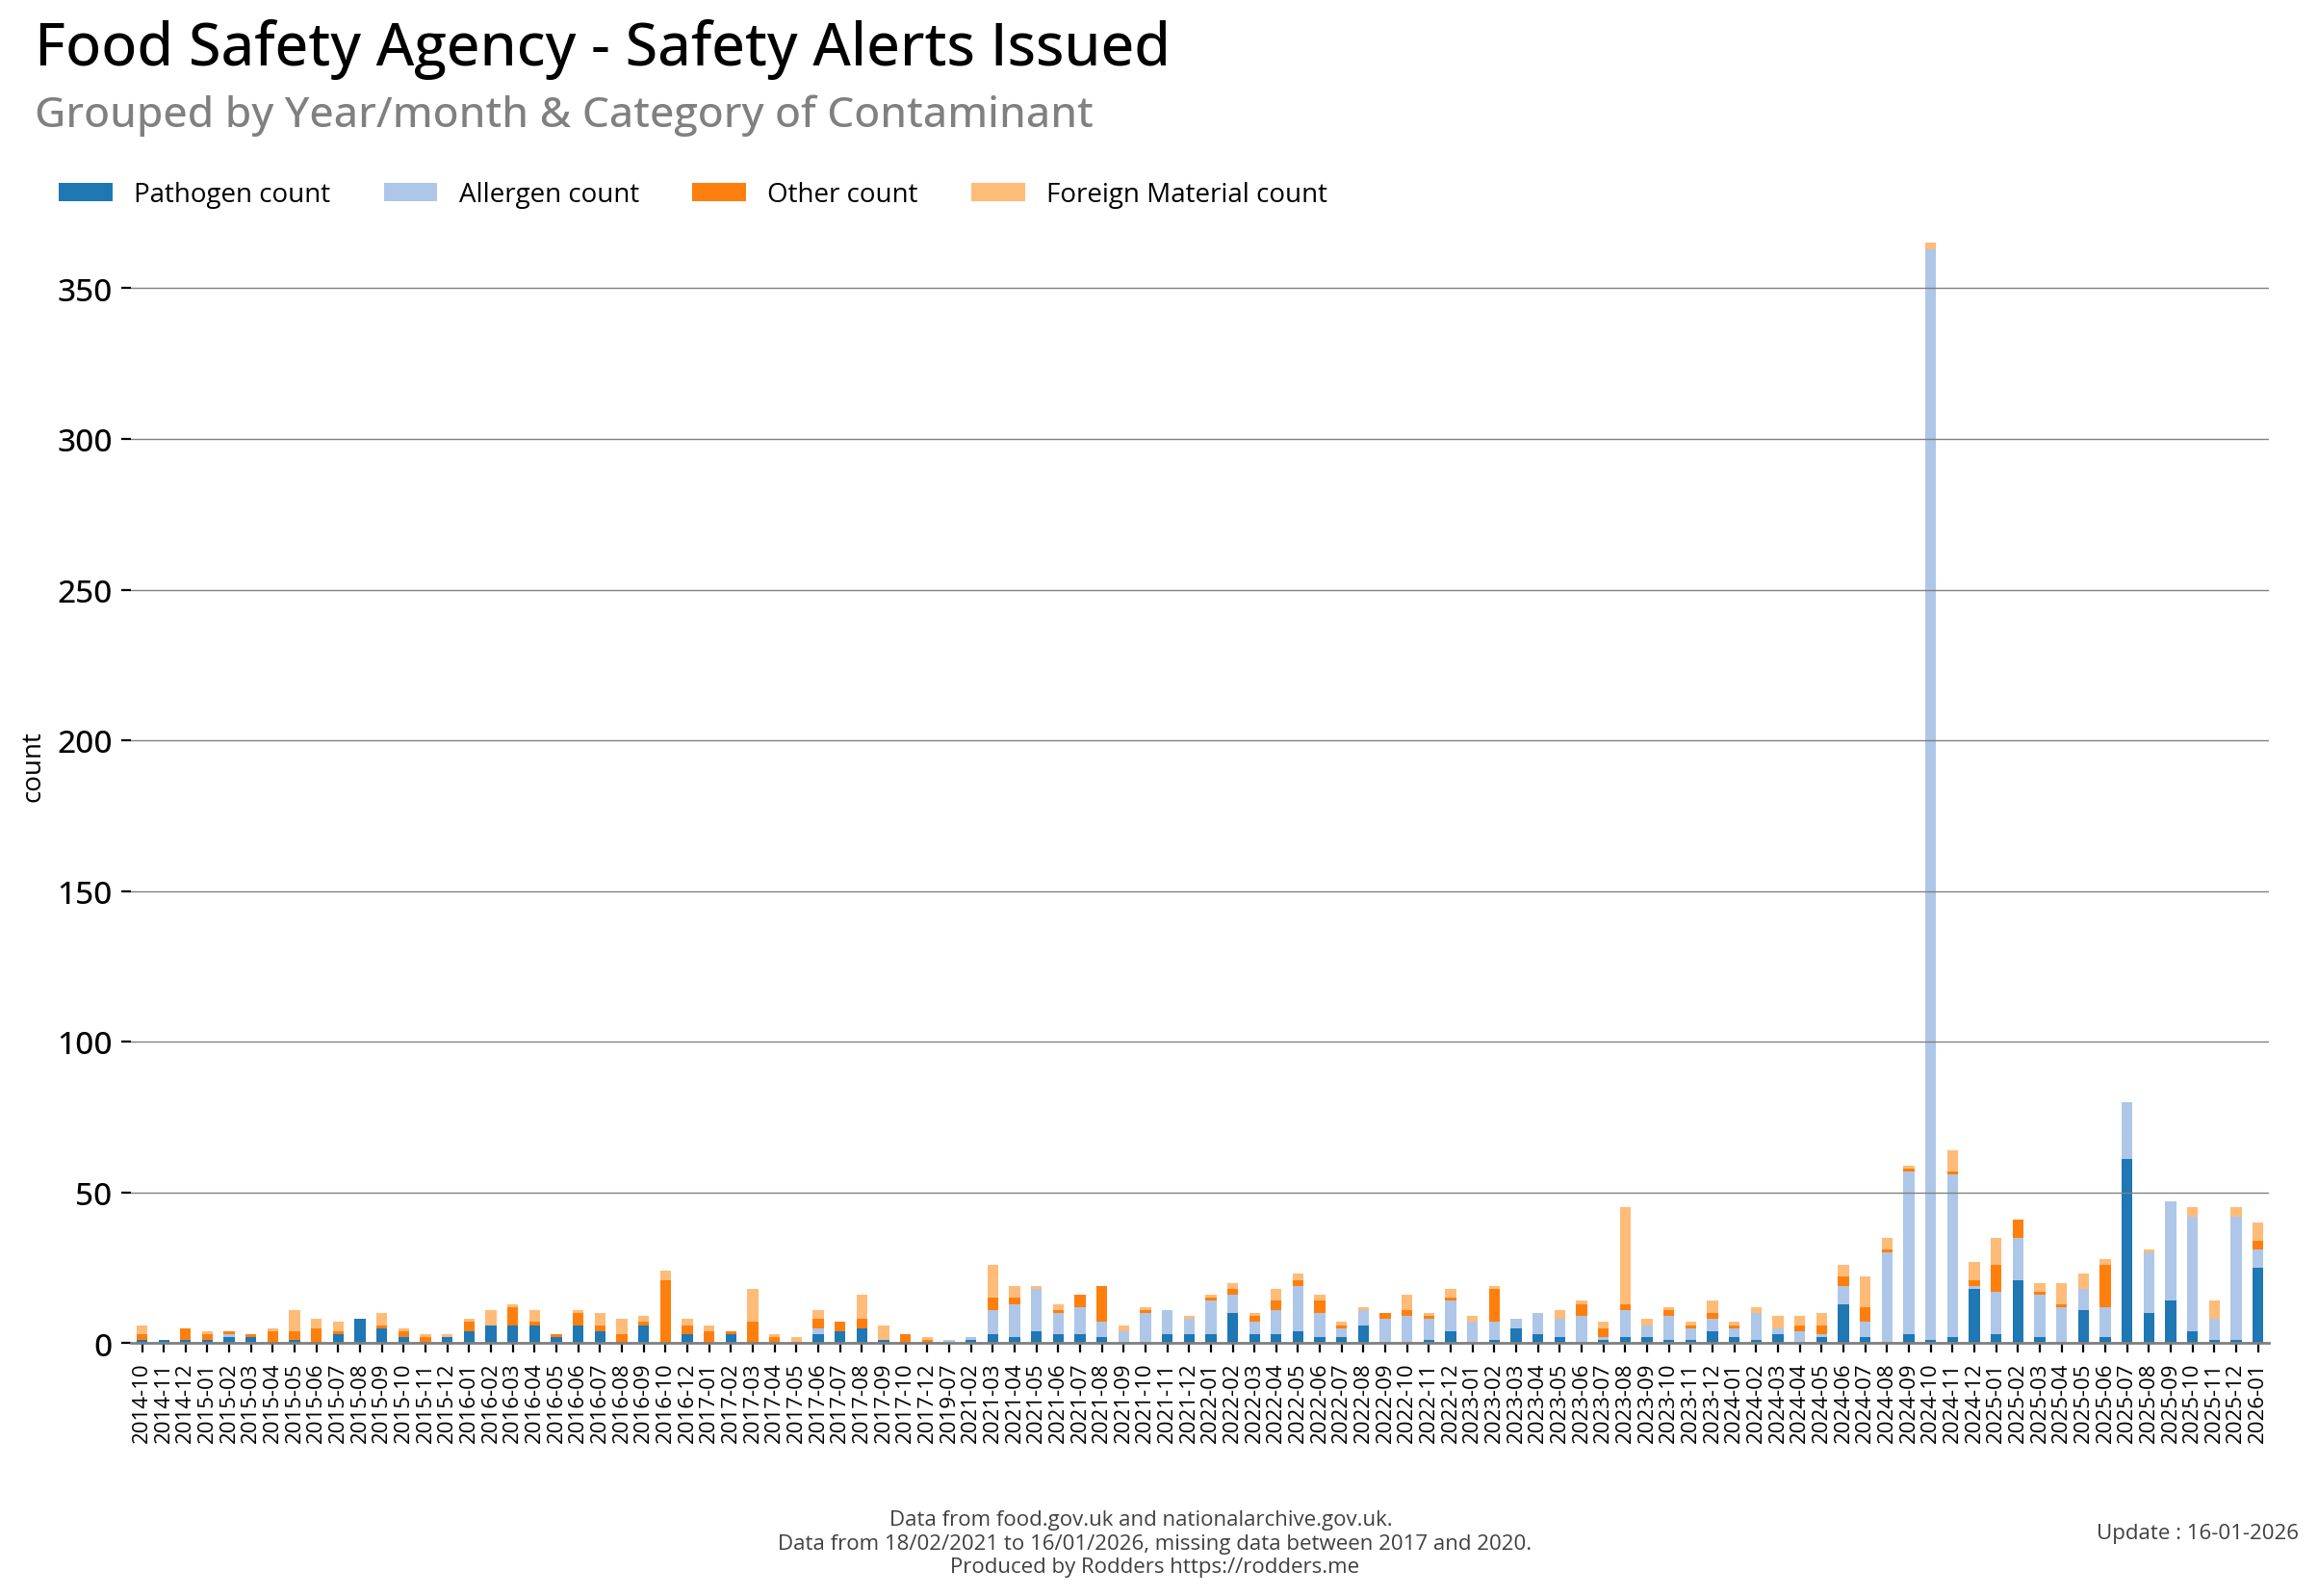
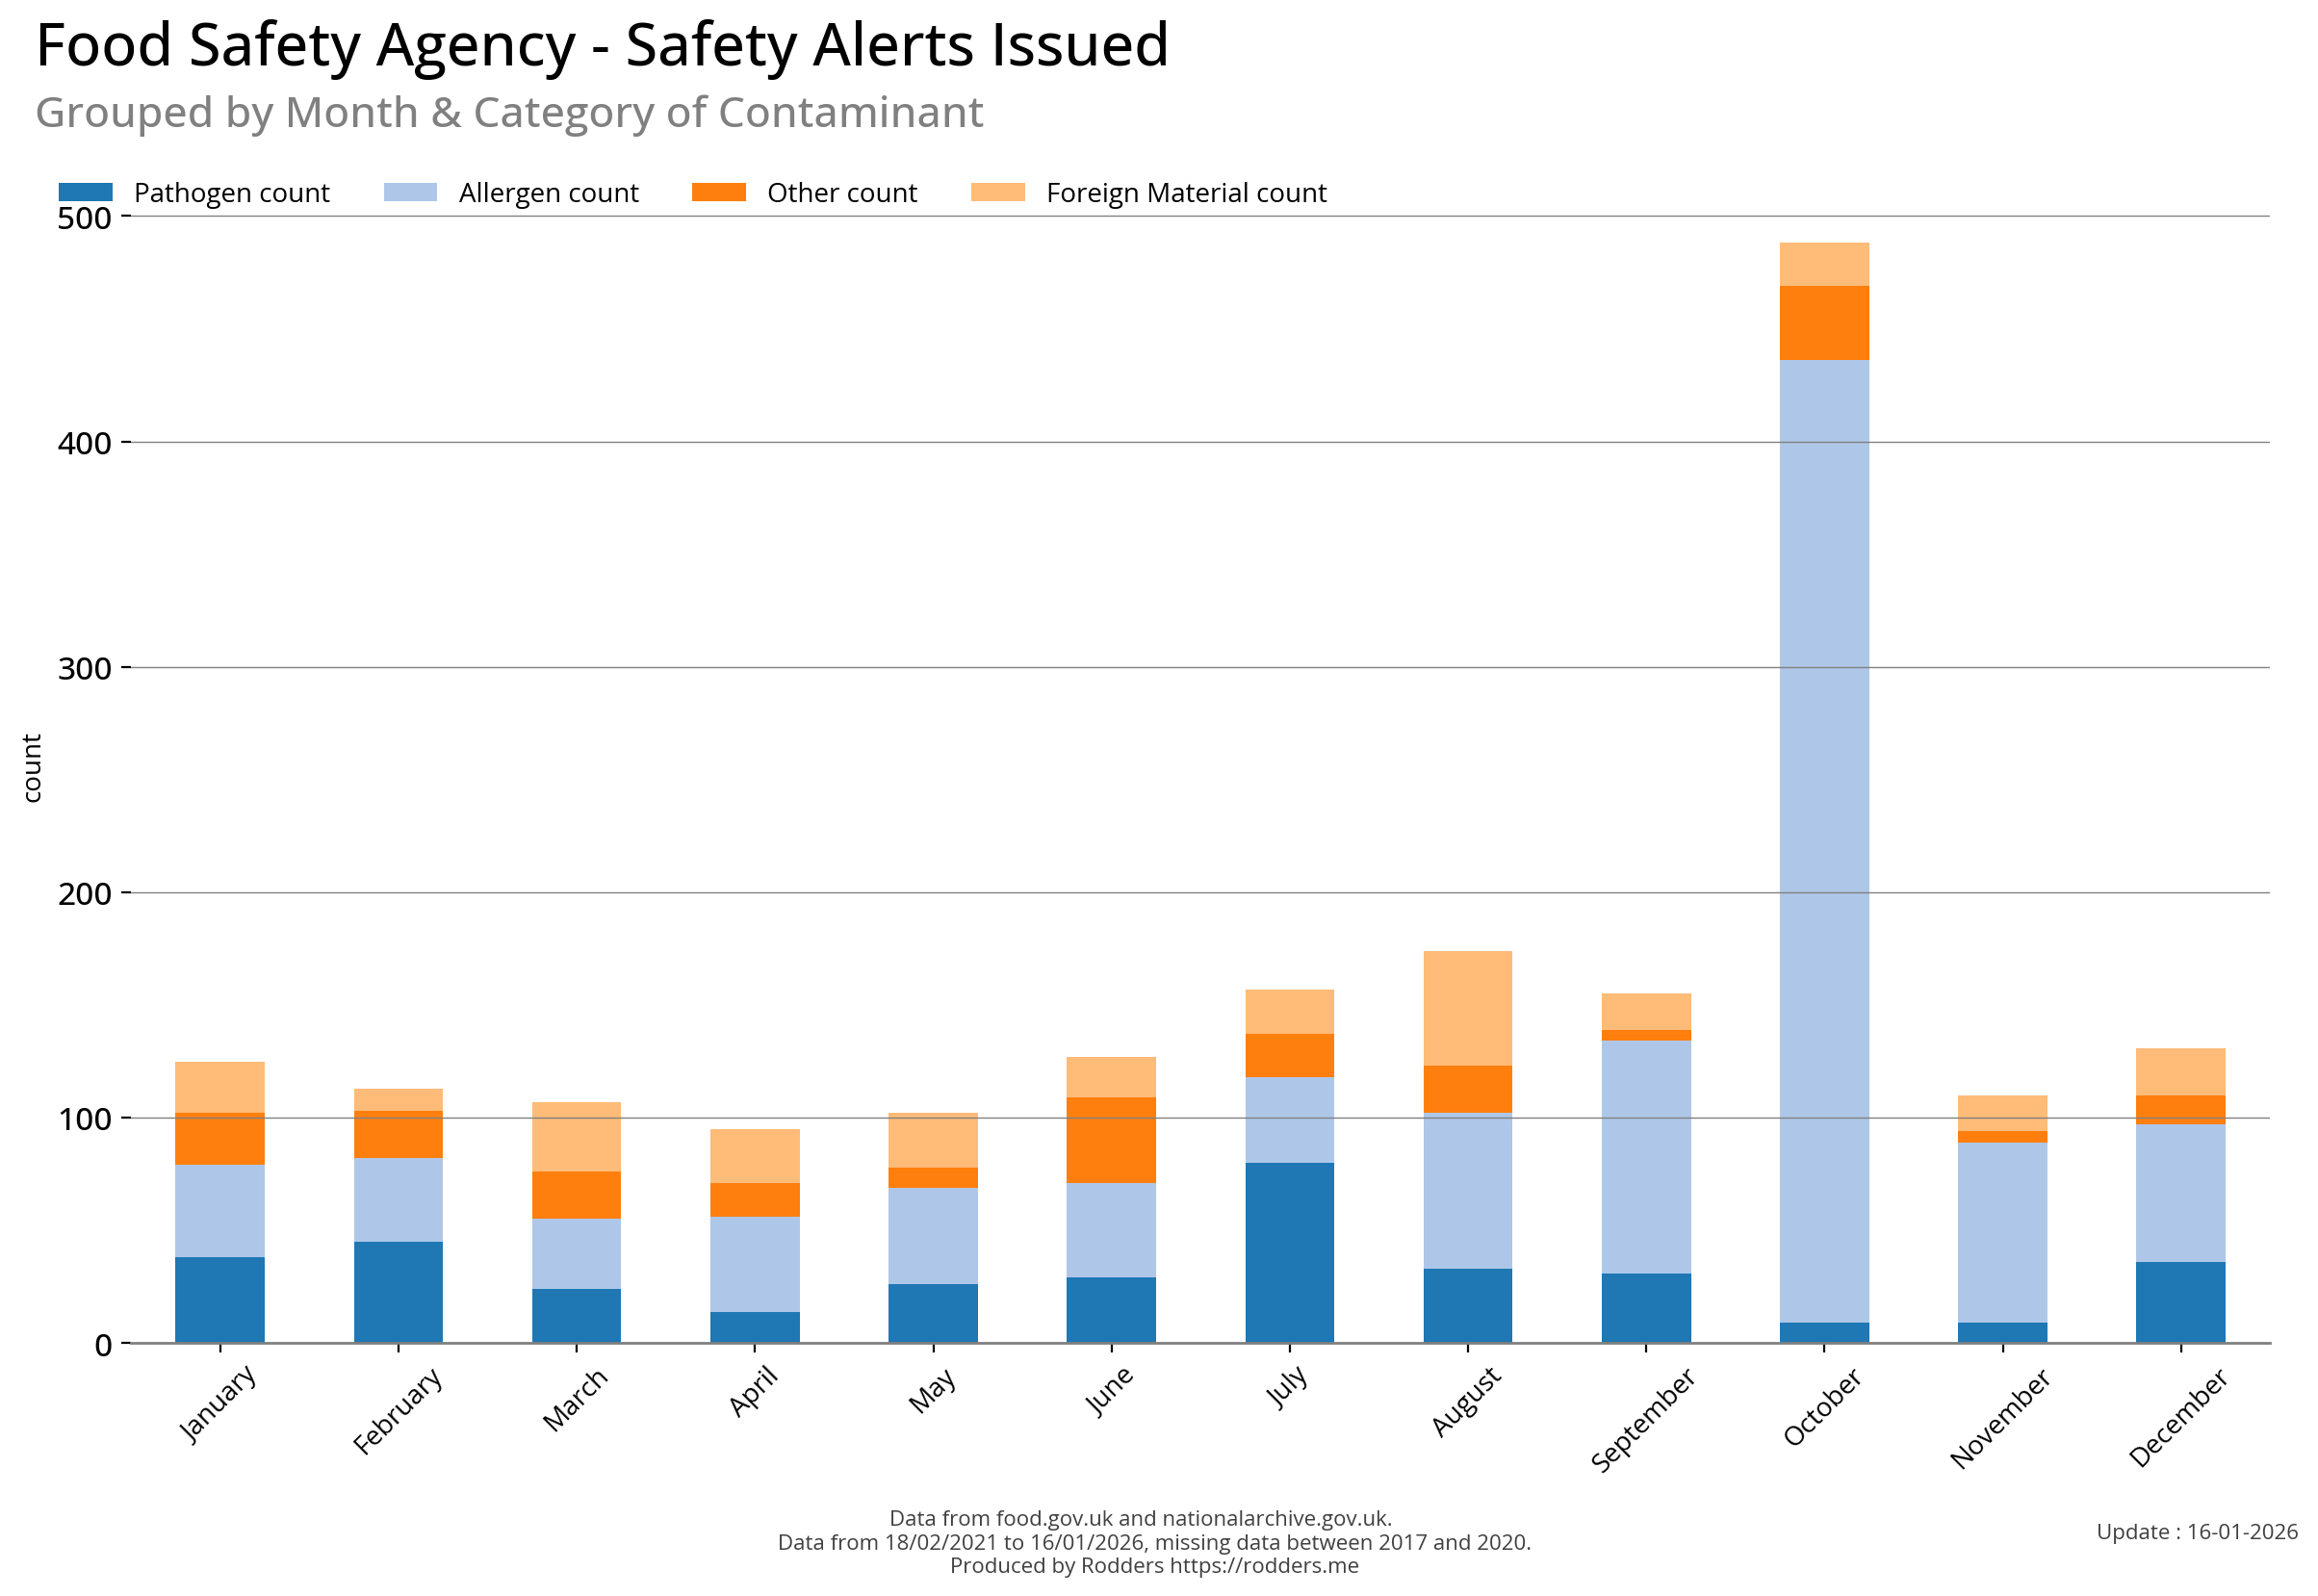
Temporal Analysis
Time Series visualisation by alert category.
 |
|
 |
 |
Top
Conclusion
In conducting temporal analysis on the food safety alert data, I found that there is no strong correlation between the date alerts are issued and the type of alert. While some patterns do emerge, such as slightly higher alert rates in the months leading up to year-end (March) or quarter-end dates (March, June, September, December), these correlations are weak and should not be interpreted as indicating a meaningful trend. It appears that the timing of alerts is not driven by specific business cycles or calendar events, but rather reflects the stochastic nature of food safety incidents. As such, I caution against drawing conclusions based on these correlations, and instead recommend focusing on other factors that may influence alert rates.