Jump to section
EU Safety Gate report 2023 Summary
![]()
Last Updated: Tuesday, September 17, 2024 12:55 PM - Data up to Week 37 - 2024
The Annual Summary Report provides a comprehensive overview of safety alerts issued by the European Union for non-food products throughout the year. This report highlights the most notable data and trends, including significant increases or decreases in alerts.
Data Includes:
- Common types of hazards (Risk Type)
- Categories of products most frequently flagged
- Country of product origin
- Countries submitting alerts
- Regulatory action required
- Regulatory identification of responsible party
- Brand Owners
And more.
It aims to give readers a clear and concise understanding of the key safety concerns and regulatory actions taken within the year.
Annual Alerts
Total Annual Alerts Issued
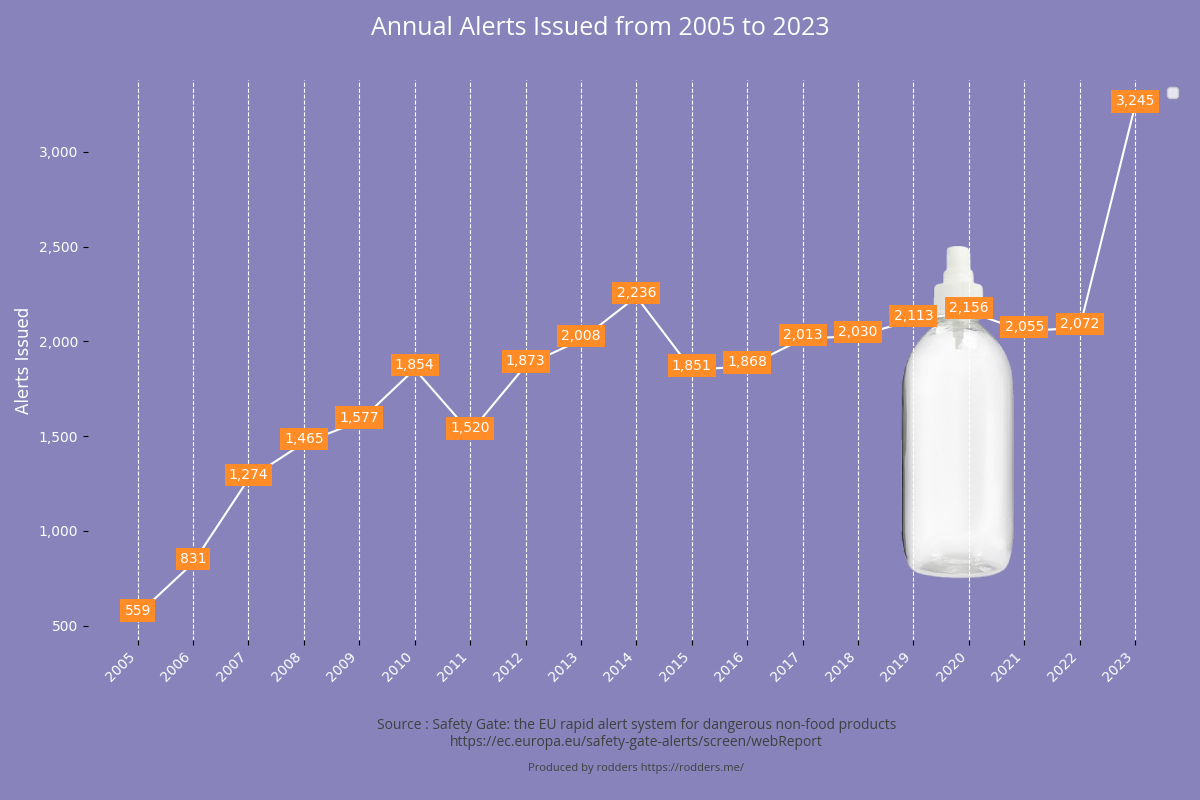
Over the last few years, the EU Safety Gate member states issue on average around 2,000 - 2,200 safety alerts per year.
- Around 25% of all alerts issued are for products where the Country of Origin is unknown.
- On average China represents around 50% of Alerts issued
- 2023 was exceptional with 3412 alerts issued (according to the EU) or 3,349 (according to my analysis).
| Metric | 2005 | 2006 | 2007 | 2008 | 2009 | 2010 | 2011 | 2012 | 2013 | 2014 | 2015 |
|---|---|---|---|---|---|---|---|---|---|---|---|
| Count | 559 | 831 | 1,274 | 1,465 | 1,577 | 1,854 | 1,520 | 1,873 | 2,008 | 2,236 | 1,851 |
| % Change | 0 | 49 | 53 | 15 | 8 | 18 | -18 | 23 | 7 | 11 | -17 |
| Change | 0 | 272 | 443 | 191 | 112 | 277 | -334 | 353 | 135 | 228 | -385 |
| Metric | 2016 | 2017 | 2018 | 2019 | 2020 | 2021 | 2022 | 2023 | 2024 | 2025 | 2026 |
|---|---|---|---|---|---|---|---|---|---|---|---|
| Count | 1,868 | 2,013 | 2,030 | 2,113 | 2,156 | 2,055 | 2,072 | 3,245 | |||
| % Change | 0 | 8 | 1 | 4 | 2 | -5 | 1 | 57 | |||
| Change | 0 | 145 | 17 | 83 | 43 | -101 | 17 | 1,173 |
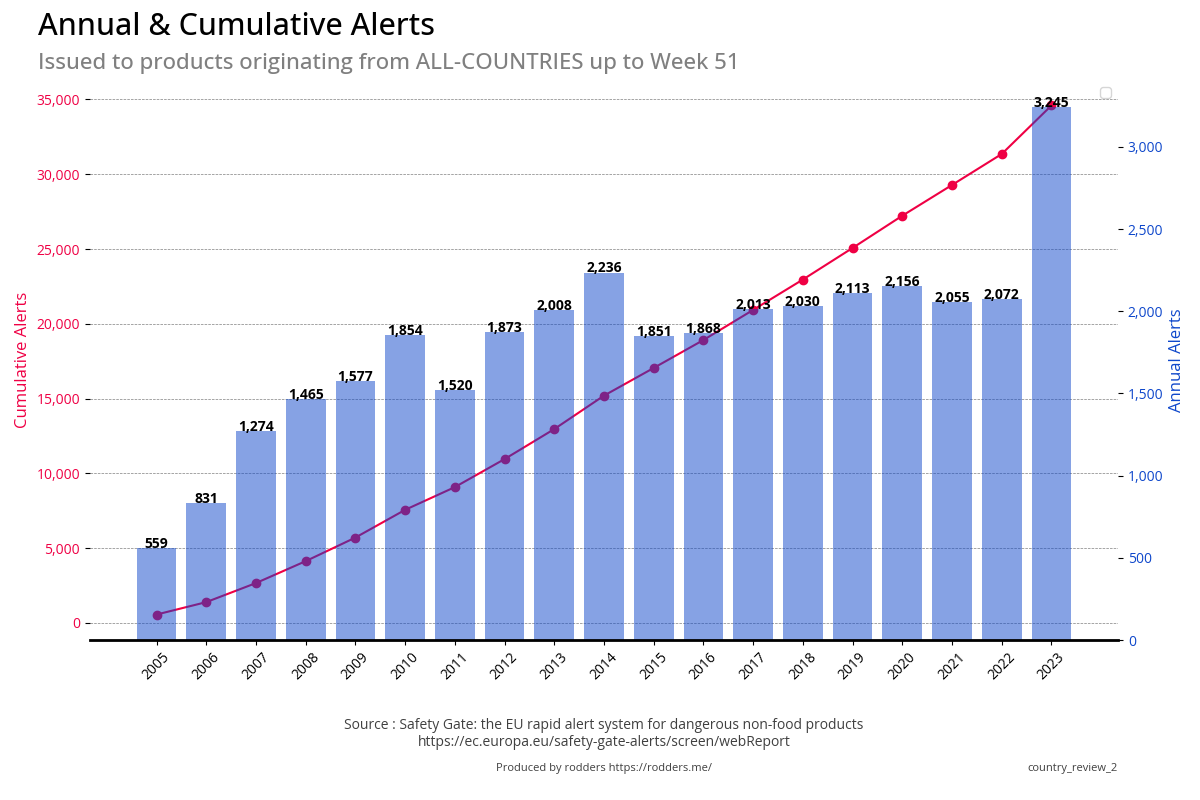
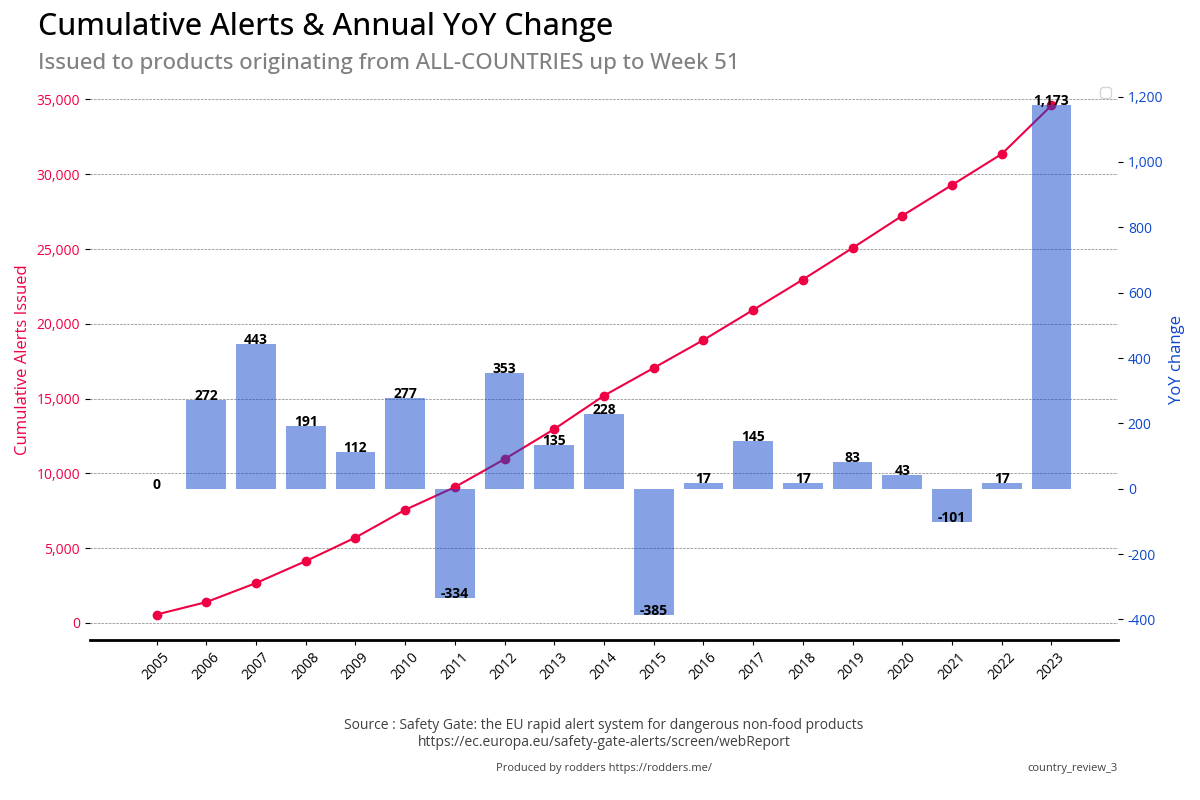
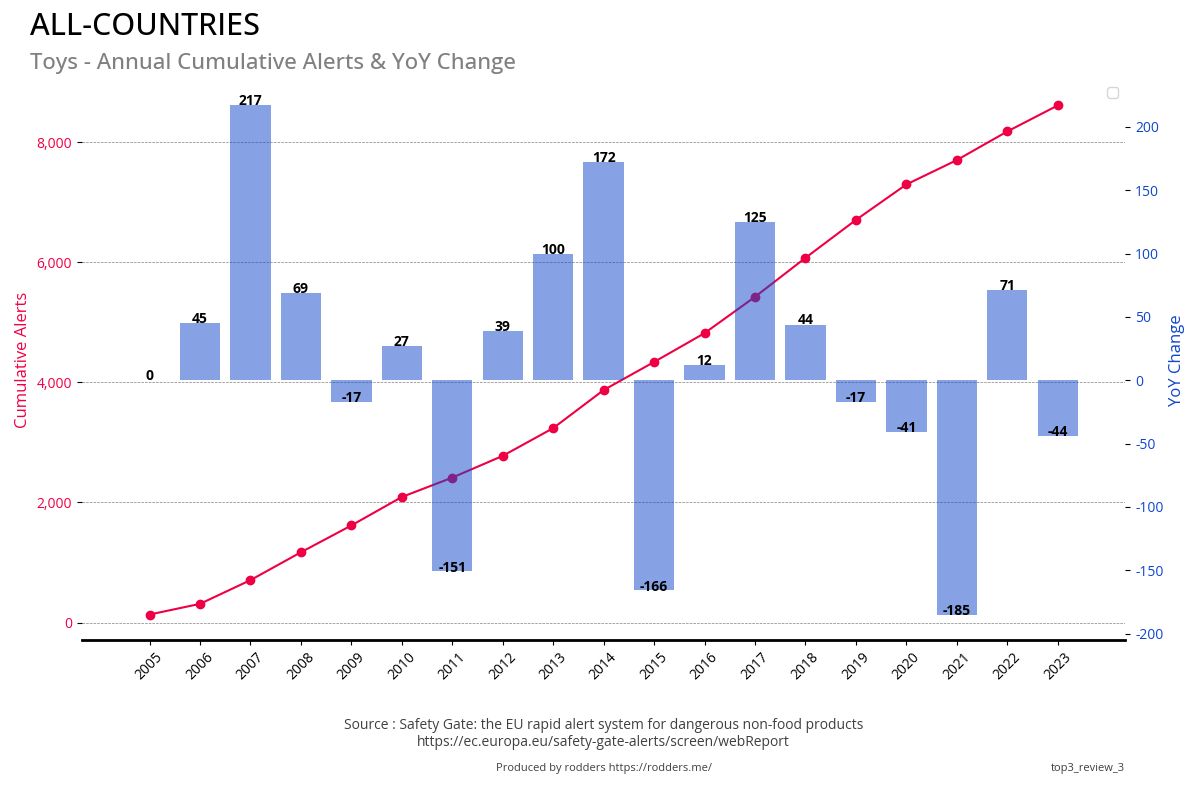
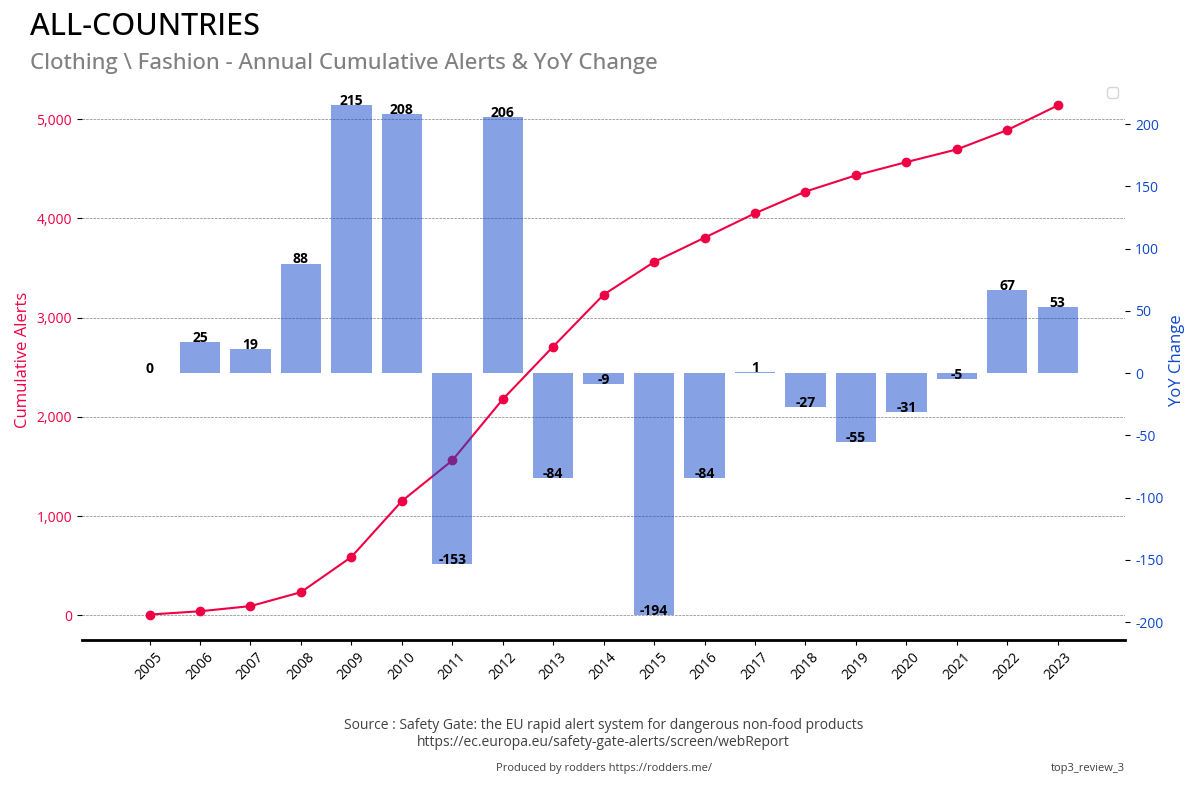
Annual Alerts Issued - YoY Change
2023 saw a 59% increase in the average number of alerts issued in a year, with the total alerts issued increasing from 2,100 alerts in 2022 to 3,349 in 2023, an increase of 1,249 over the previous year.
| All Countries Annual & Cumulative Alerts | All Countries Annual YoY Change and Cumulative Alerts |
|---|---|
|
|
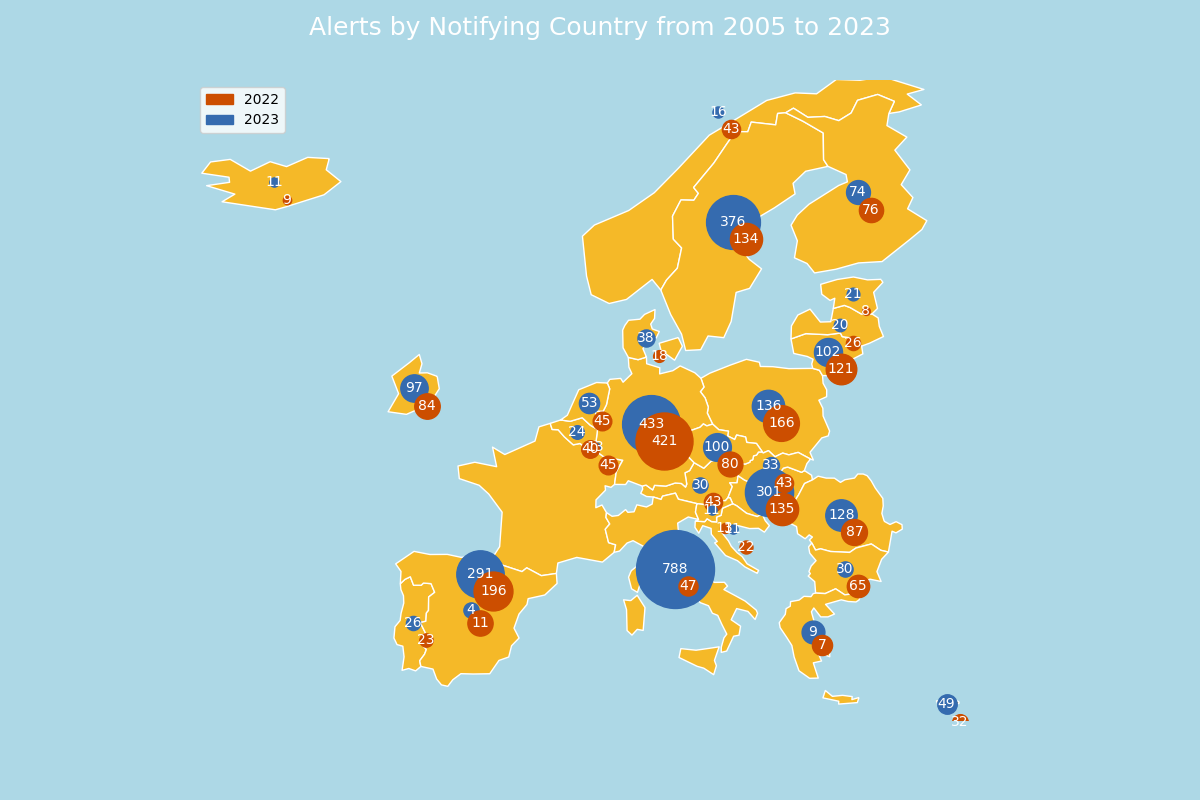
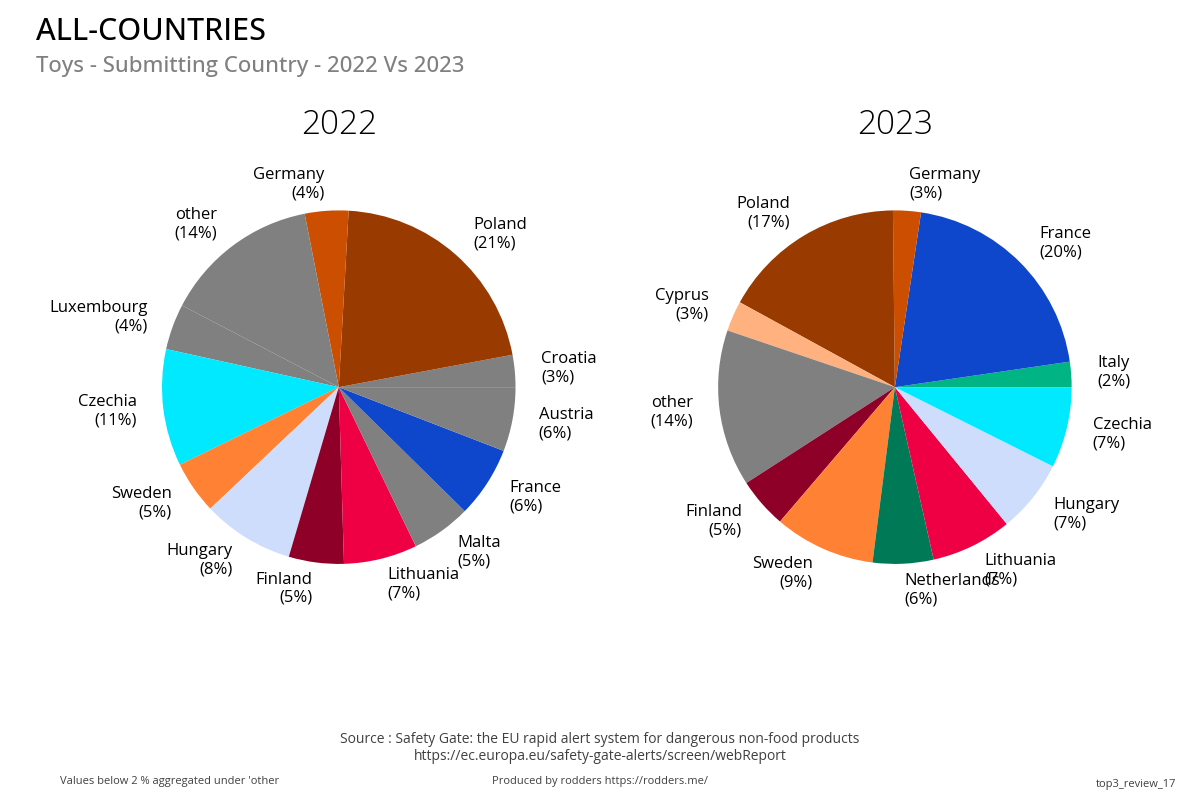
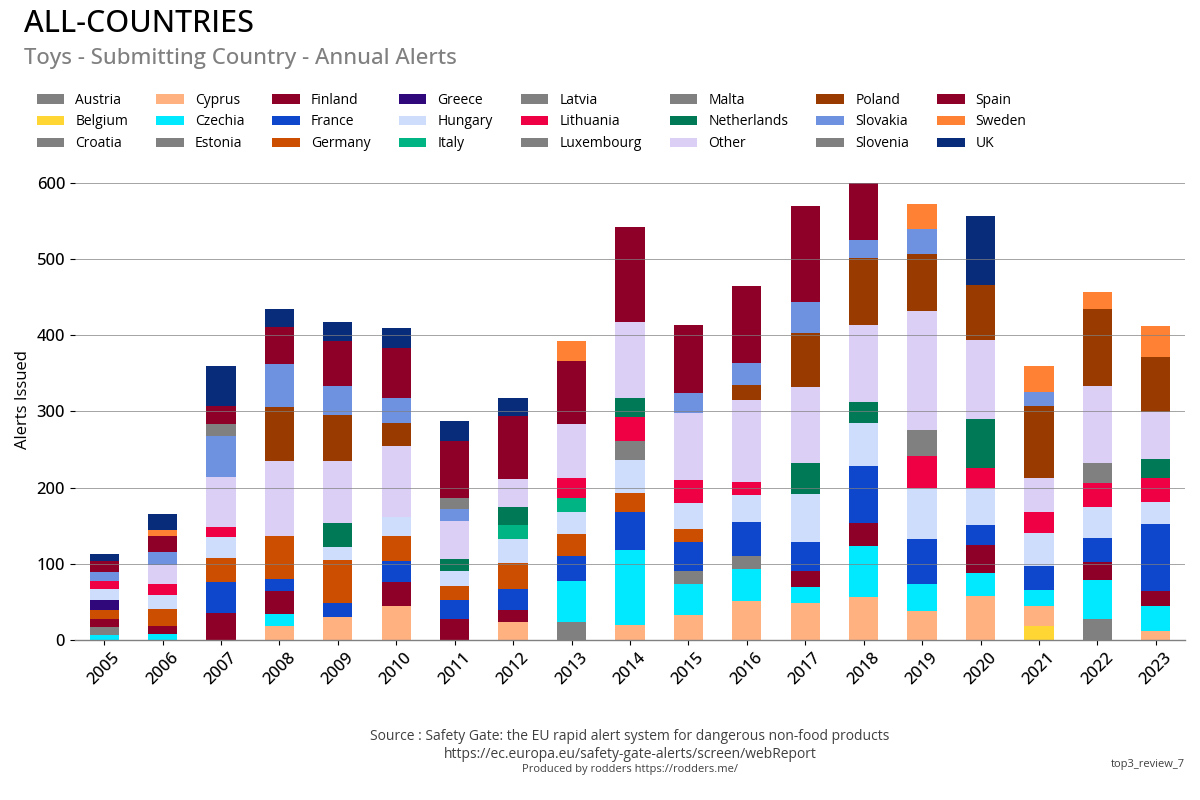
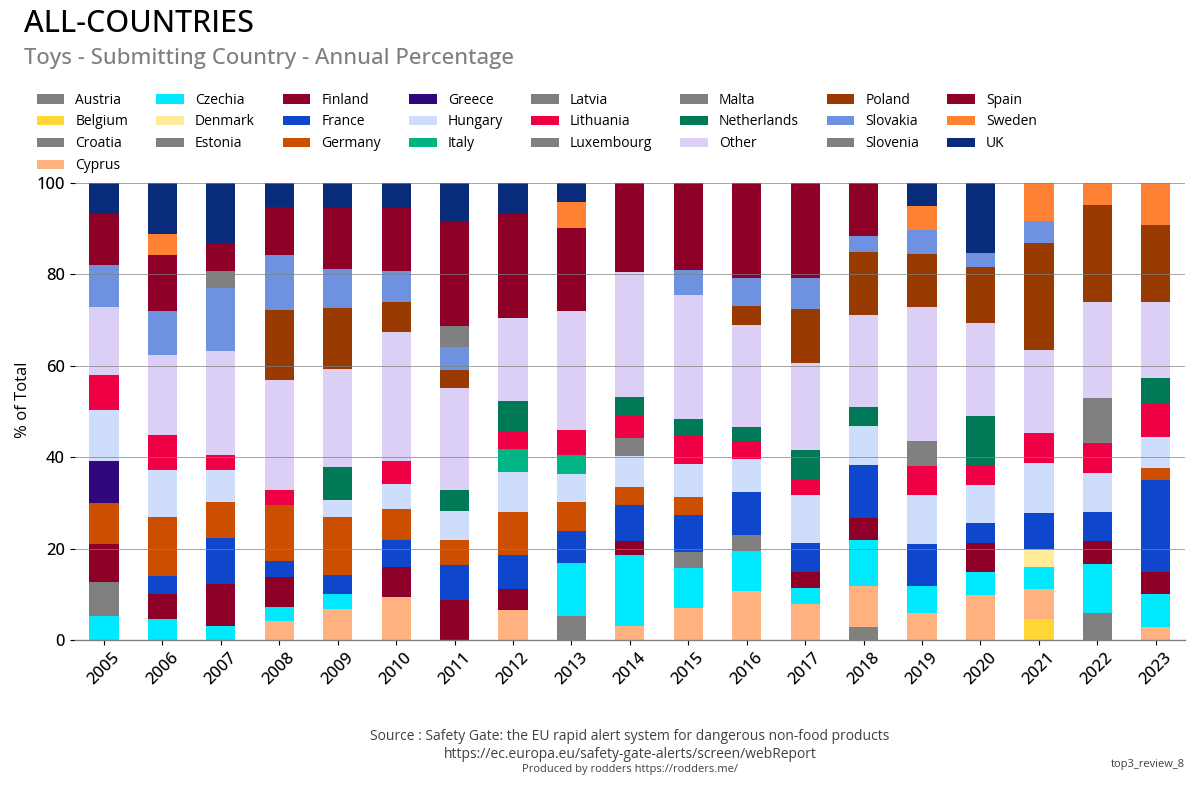
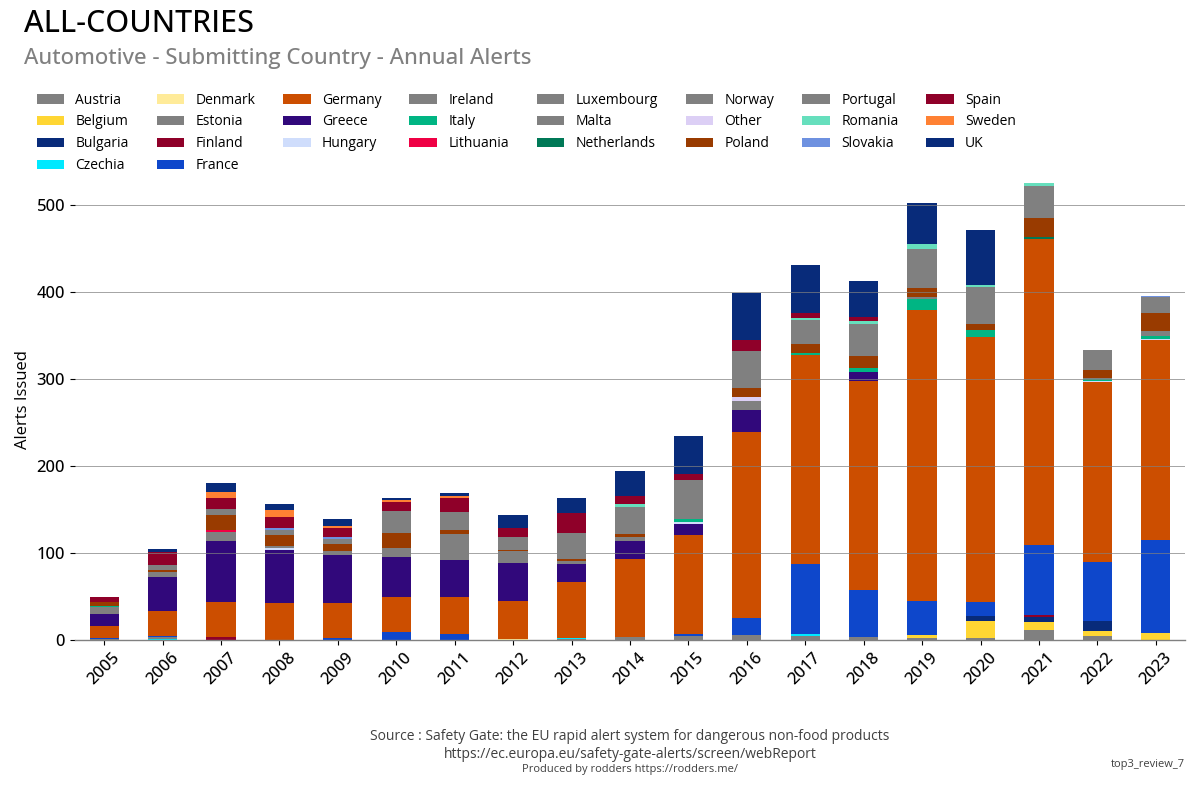
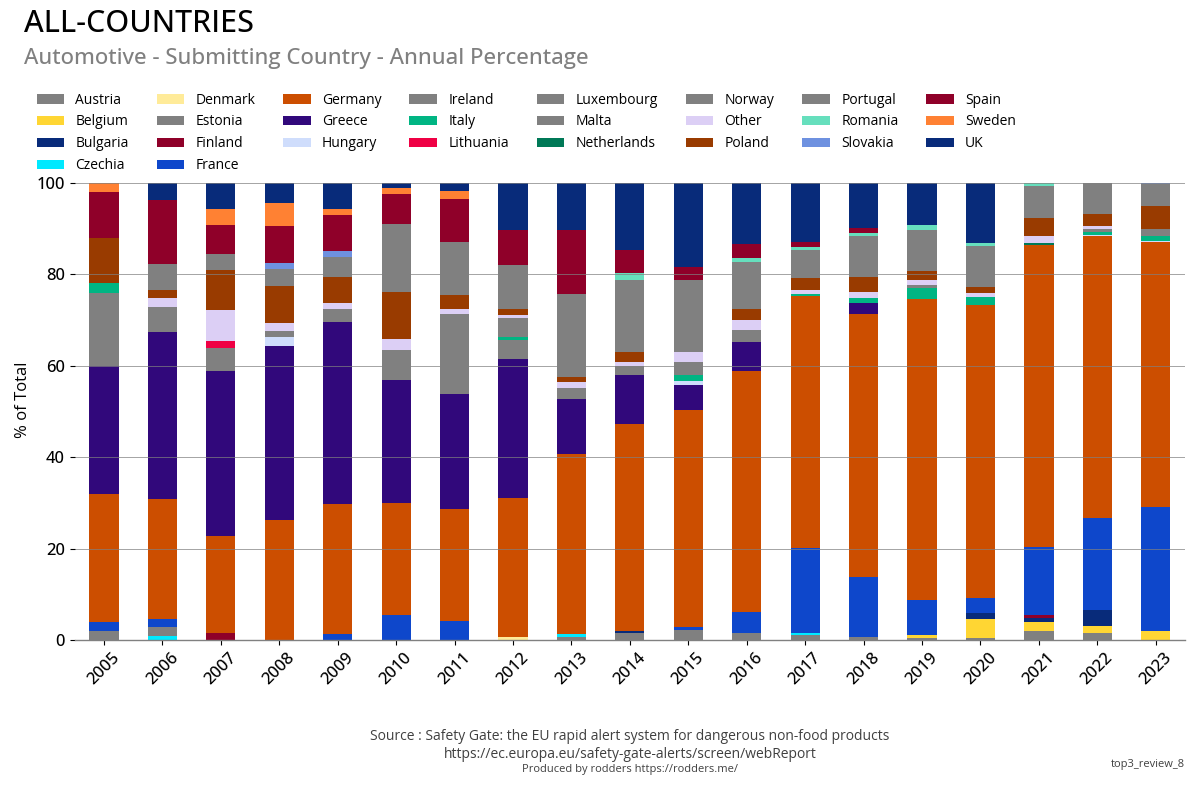
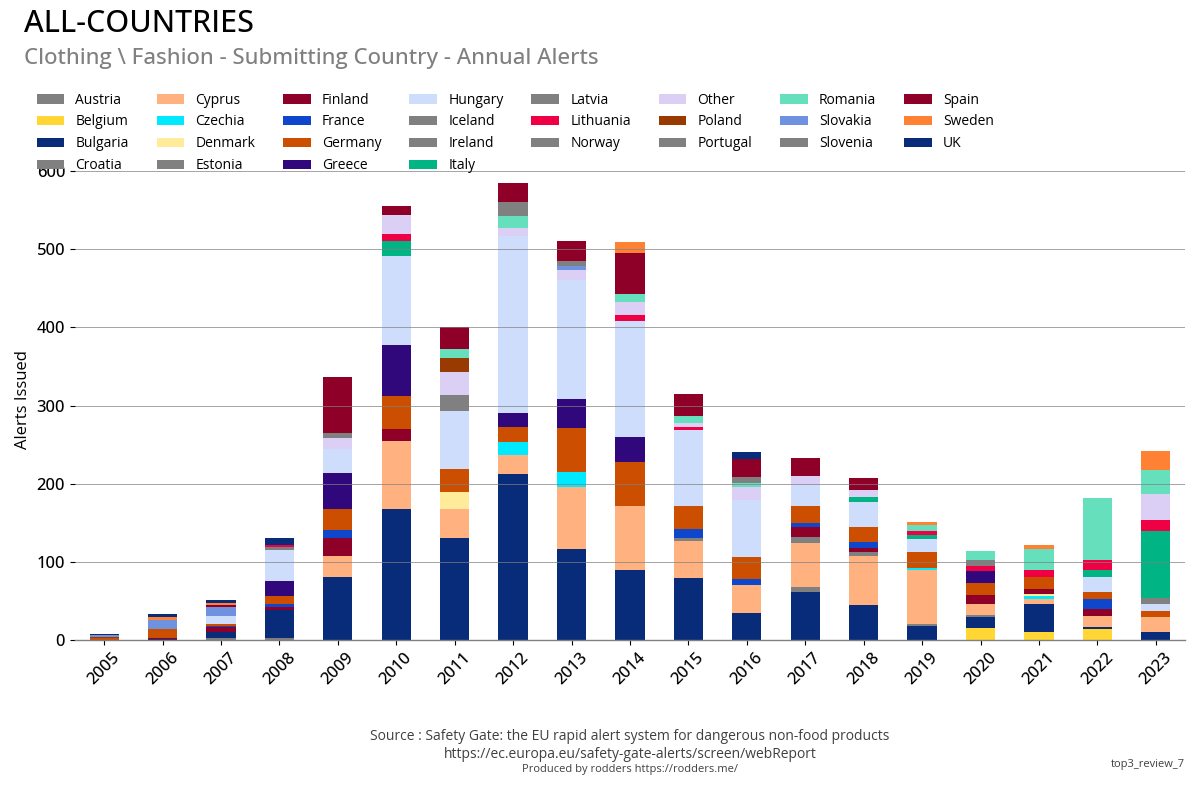
Submitting Country
The Submitting Country category provides detailed information on which EU country has reported a safety alert to the EU Safety Gate team. This category highlights the active role each member state plays in monitoring and ensuring the safety of non-food products within the European market. By identifying the submitting country, the report can track trends and patterns in regulatory vigilance and responsiveness across different regions. This information is crucial for understanding the distribution of safety concerns and the collaborative efforts of EU countries in safeguarding consumer health and safety through prompt and effective reporting of hazardous products.
| Alert submitted by | 2022 | 2023 | change |
|---|---|---|---|
| Germany | 421 | 433 | 2.9% |
| Italy | 47 | 788 | 1576.6% |
| Sweden | 134 | 376 | 180.6% |
| France | 196 | 291 | 48.5% |
| Hungary | 135 | 301 | 123.0% |
| Poland | 166 | 136 | -18.1% |
| Lithuania | 121 | 102 | -15.7% |
| Romania | 87 | 128 | 47.1% |
| Ireland | 84 | 97 | 15.5% |
| Czechia | 80 | 100 | 25.0% |
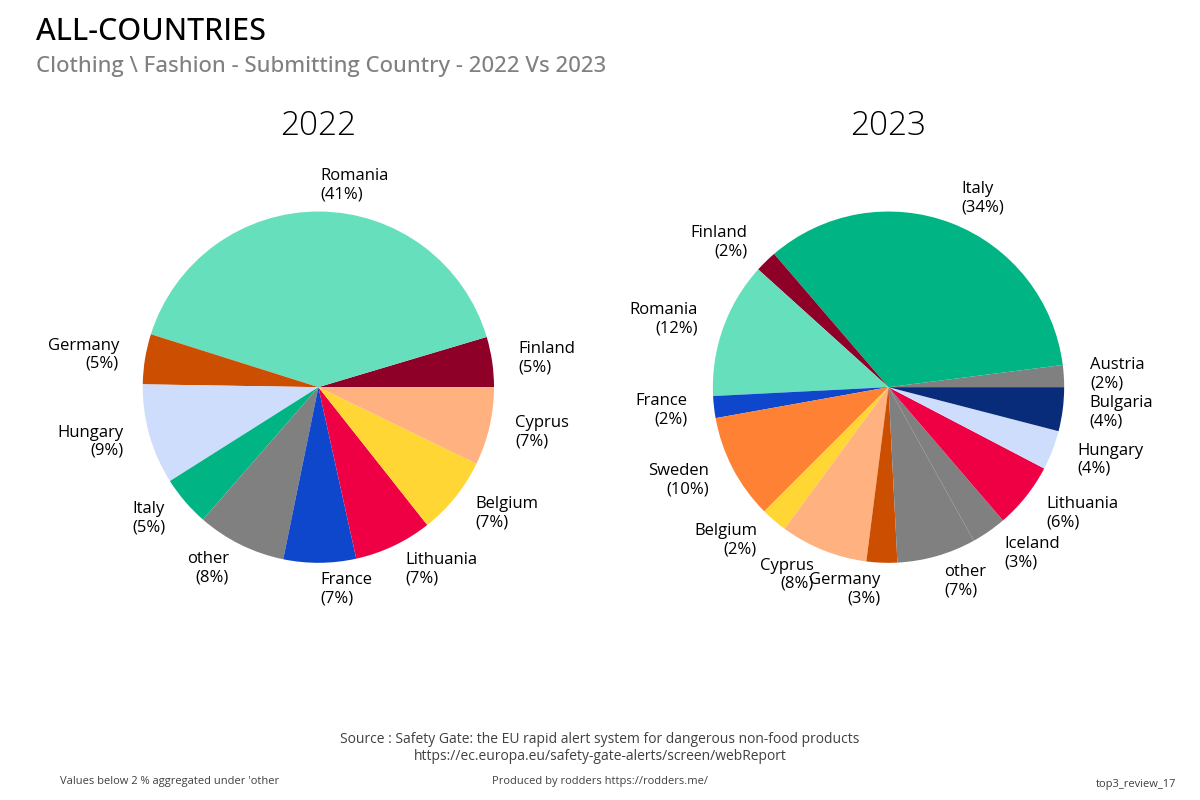
Previous Year Vs Current Year
Italy exhibited a remarkable surge in enforcement activity, with the number of alert submissions from Italy skyrocketing from 47 in 2022 to 788 in 2023. This substantial increase is primarily attributed to the ban on the chemical Lilial in cosmetics. Italy's proactive stance in enforcing this regulation has led to a significant rise in reported cases, highlighting the country's commitment to consumer safety and stringent regulatory practices. This spike underscores the critical role of national authorities in identifying and mitigating risks associated with hazardous substances, ensuring the safety and well-being of consumers across the European Union.
Map Plot Previous Year Vs Current Year
Product Categories
| product_category | 2022 | 2023 | change |
|---|---|---|---|
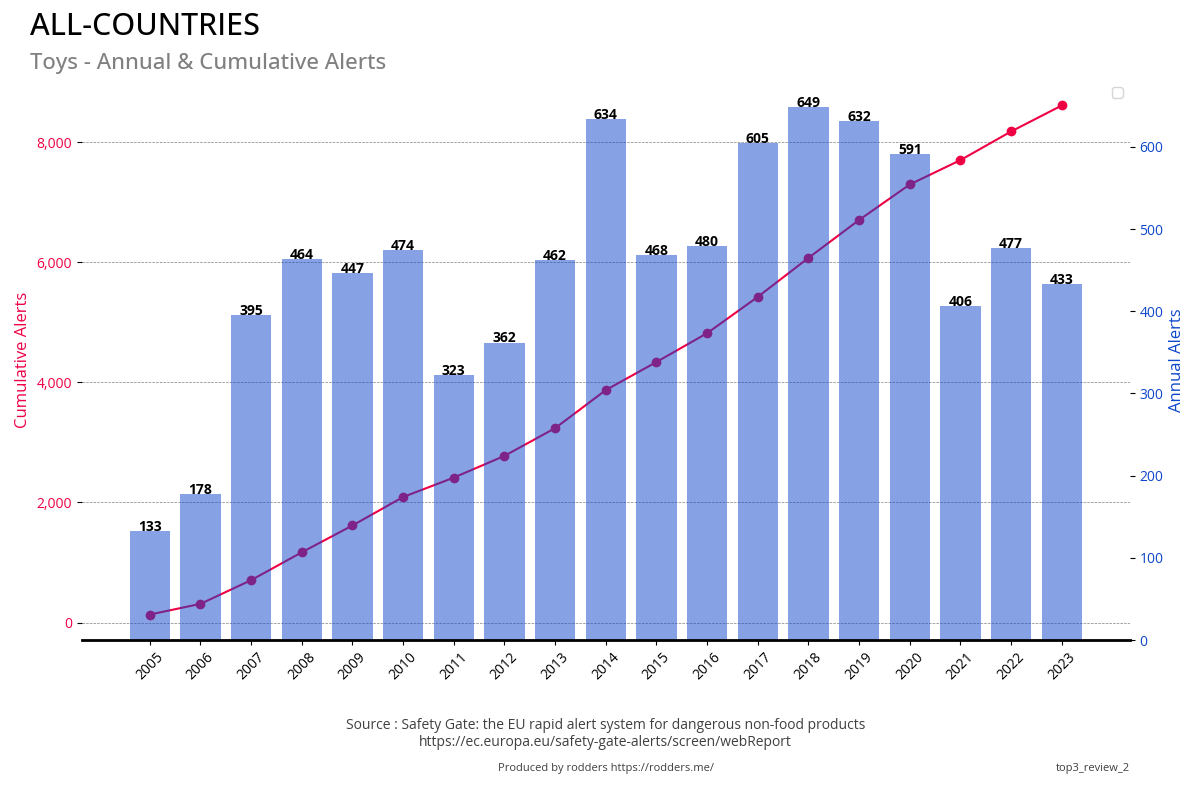
| Cosmetics | 207 | 1,072 | 417.9% |
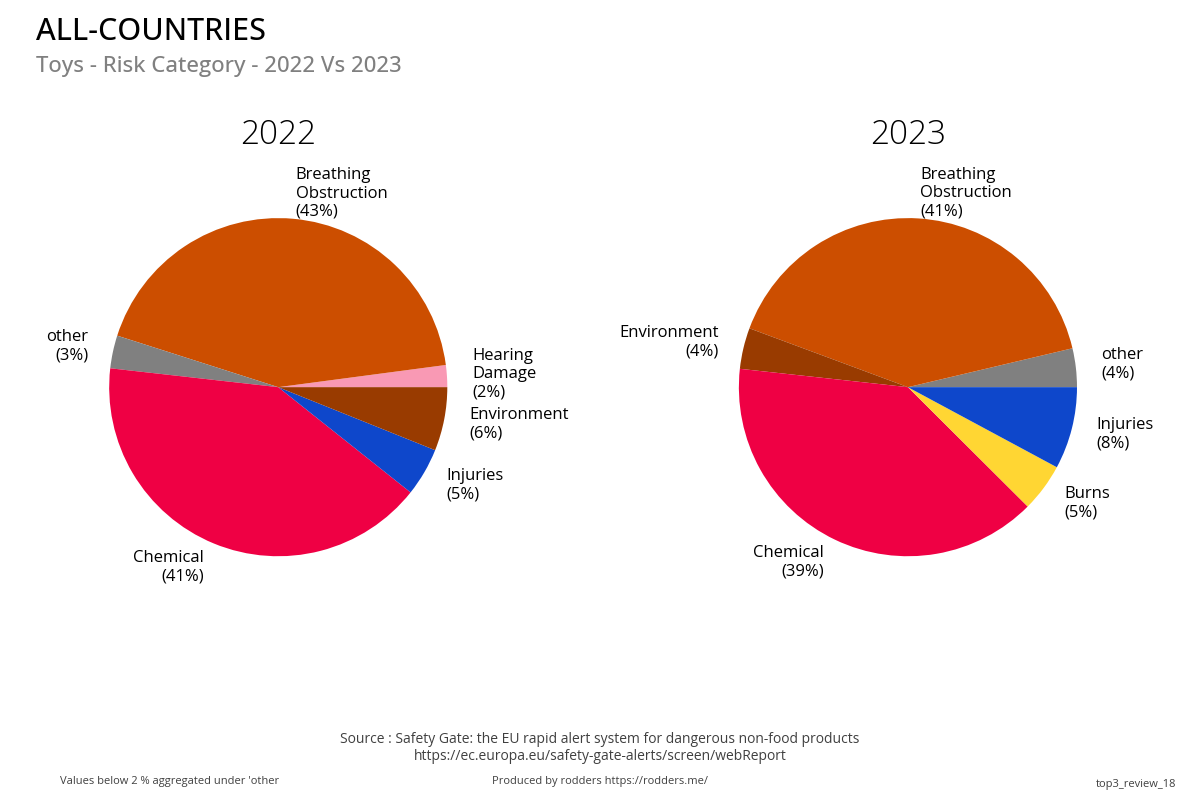
| Toys | 477 | 433 | -9.2% |
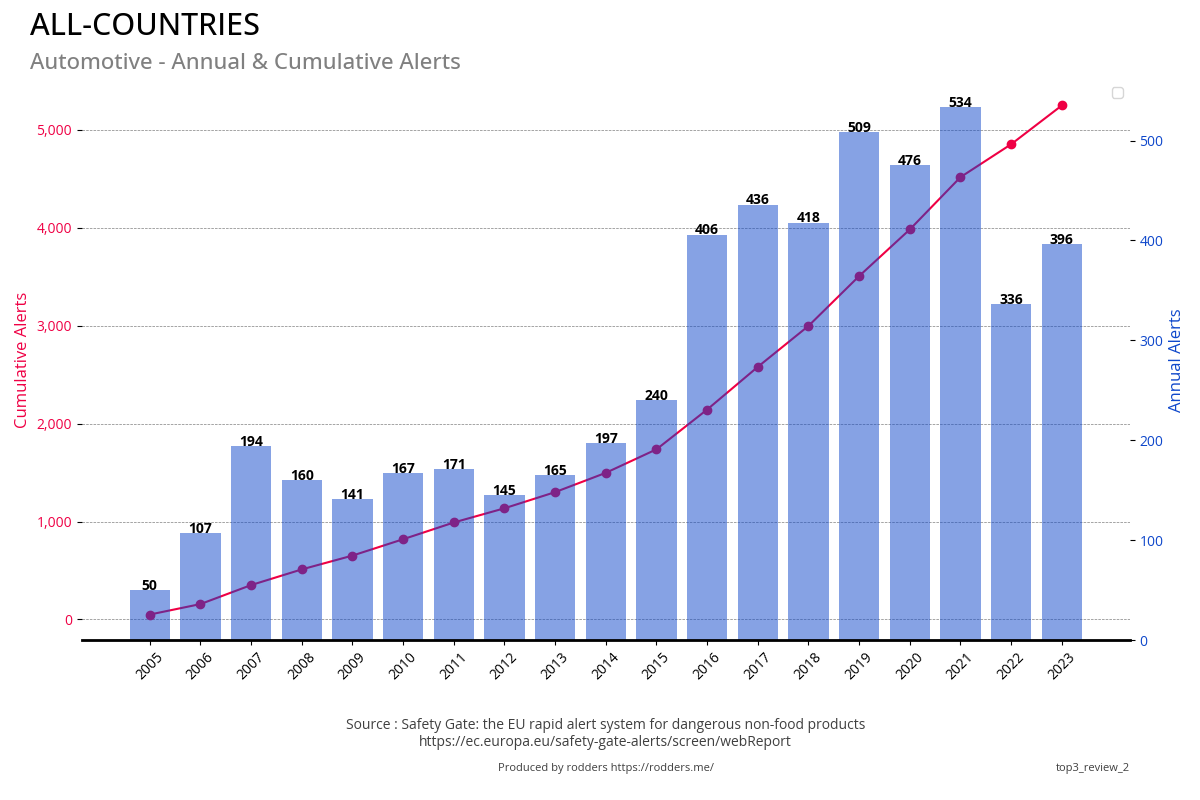
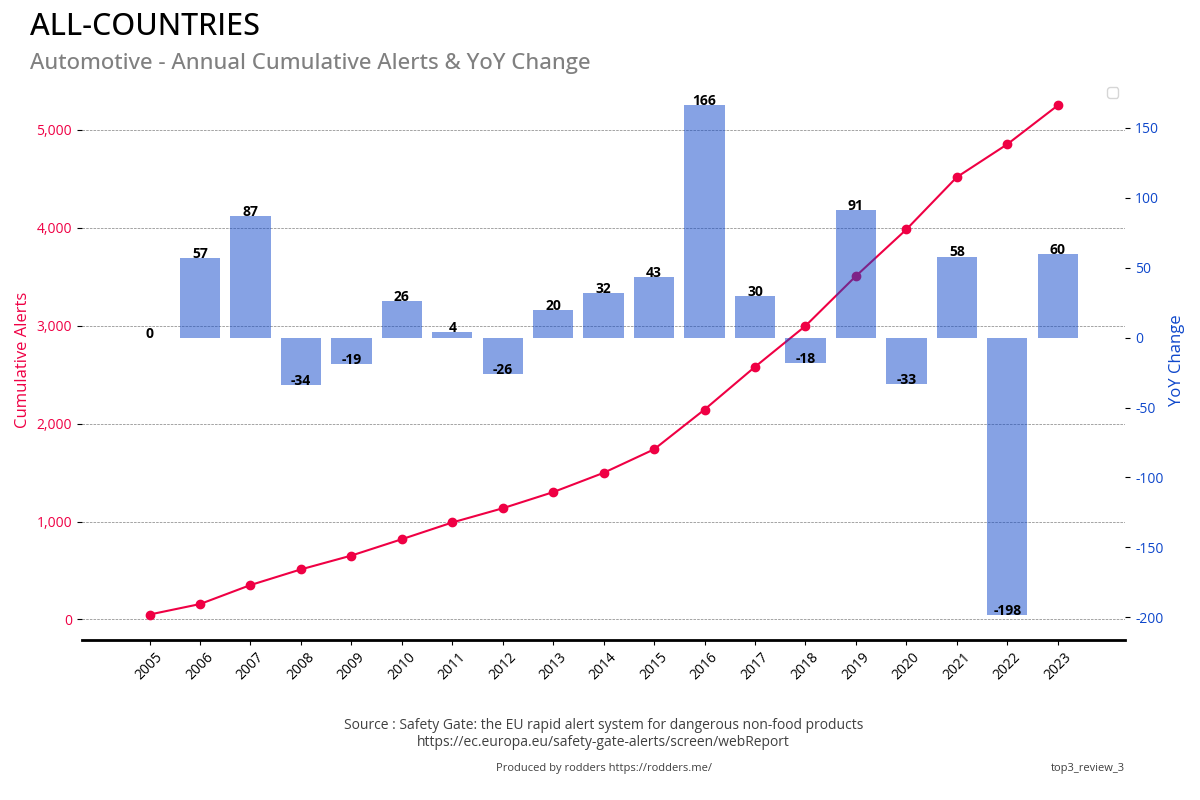
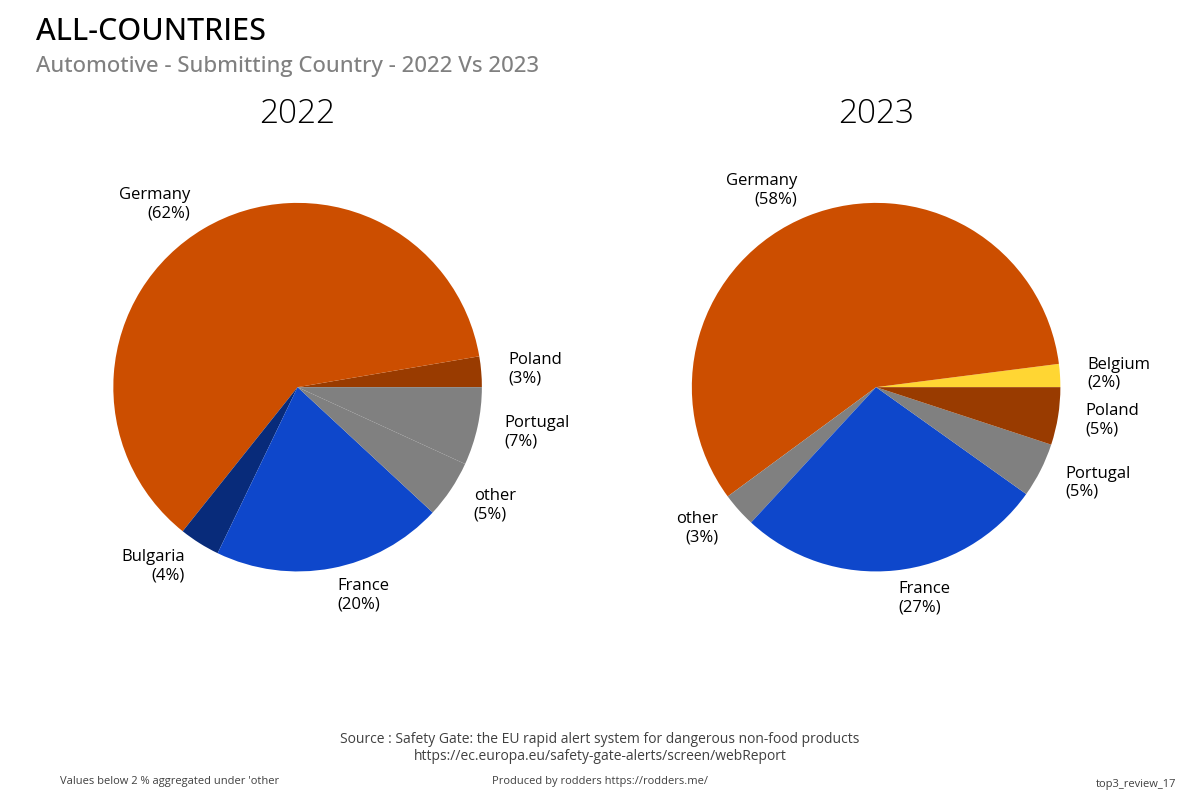
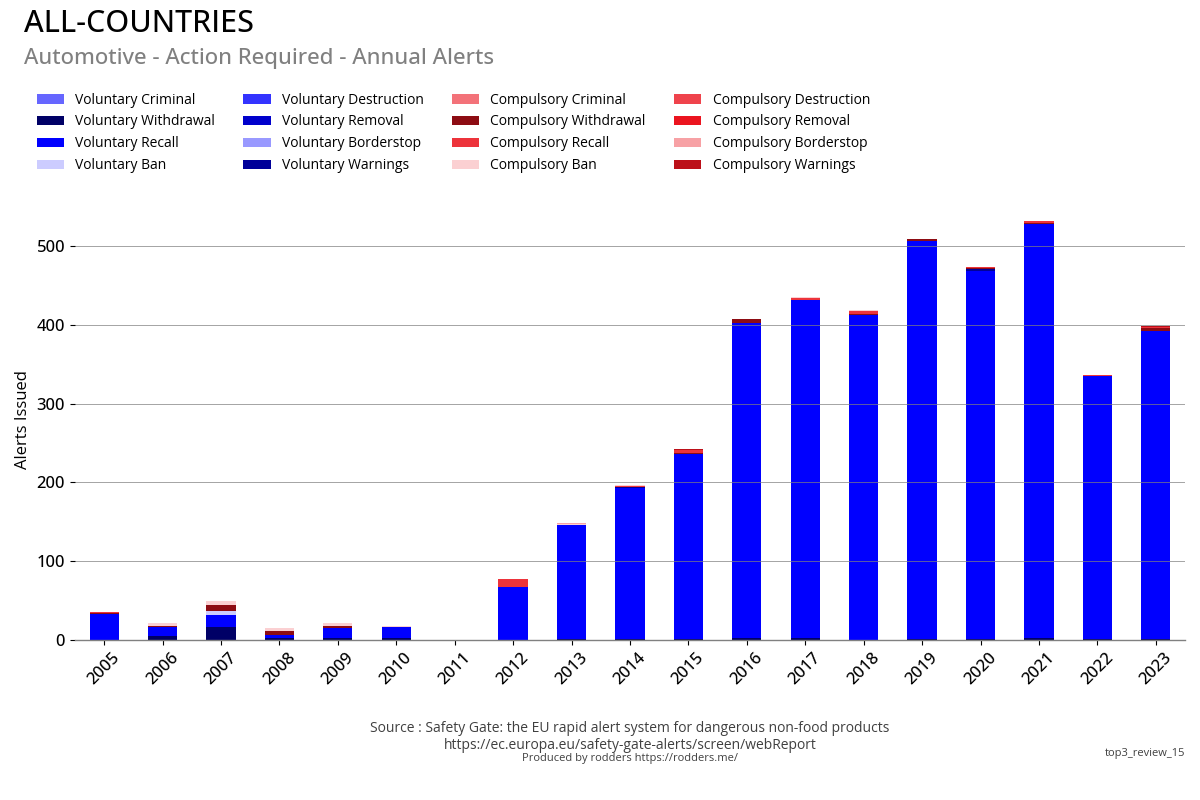
| Automotive | 336 | 396 | 17.9% |
| Electrical Appliances | 165 | 330 | 100.0% |
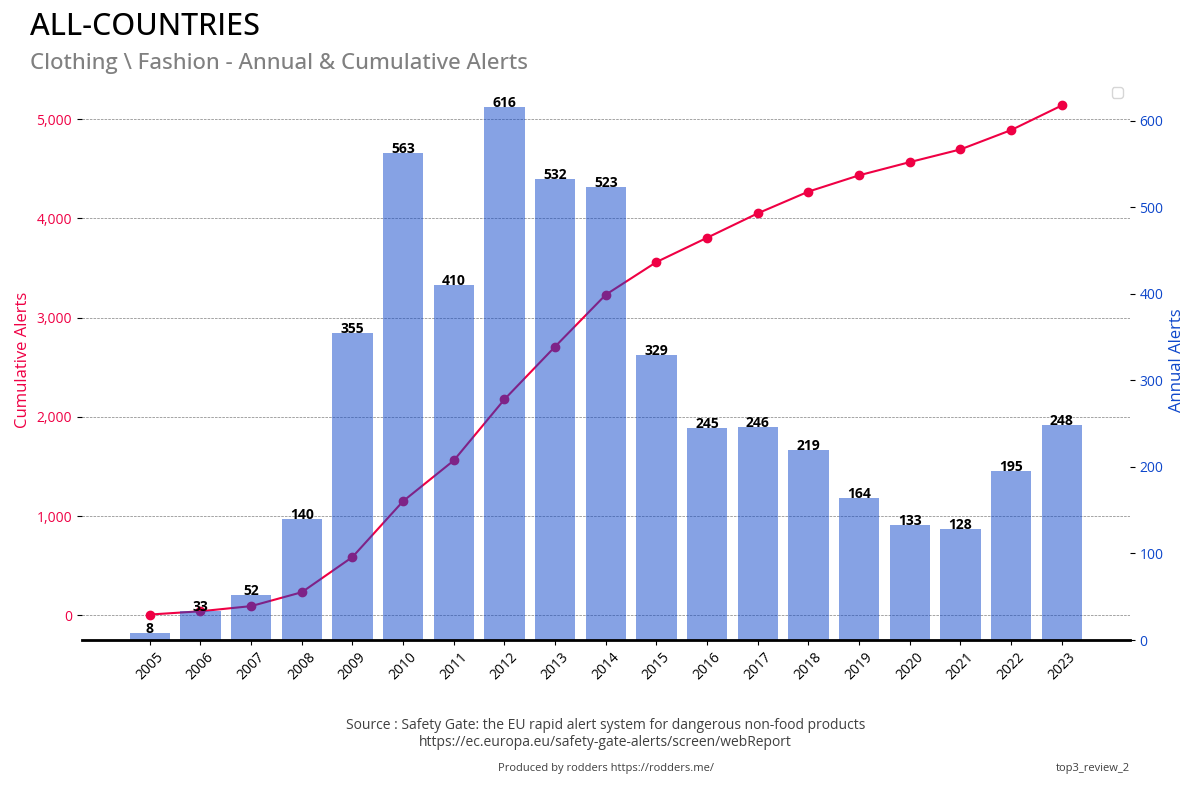
| Clothing \ Fashion | 195 | 248 | 27.2% |
| Other | 156 | 173 | 10.9% |
| Jewellery | 133 | 153 | 15.0% |
| Childcare Equipment | 62 | 106 | 71.0% |
| Chemicals | 55 | 99 | 80.0% |
| Lighting | 79 | 61 | -22.8% |
| Protective Equipment | 79 | 54 | -31.6% |
| Machinery | 44 | 62 | 40.9% |
| E-Cig | 56 | 23 | -58.9% |
| Hobby \ Sports | 28 | 35 | 25.0% |
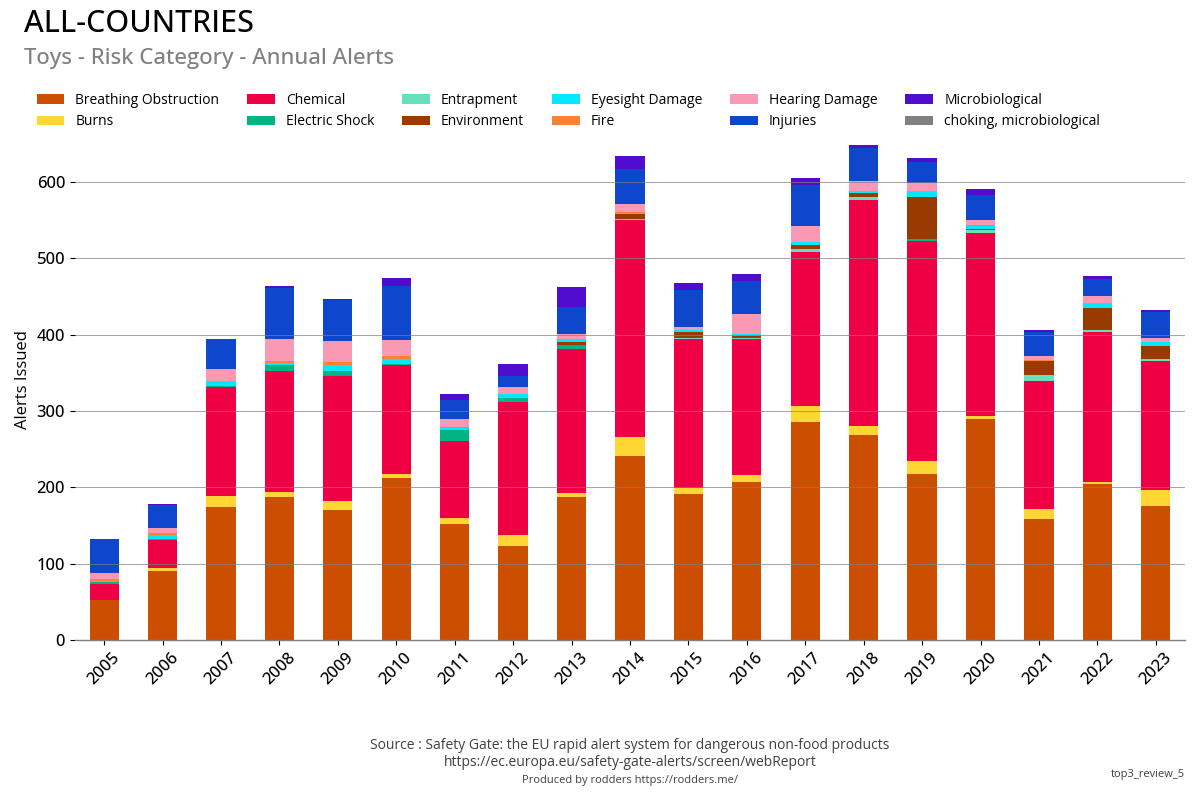
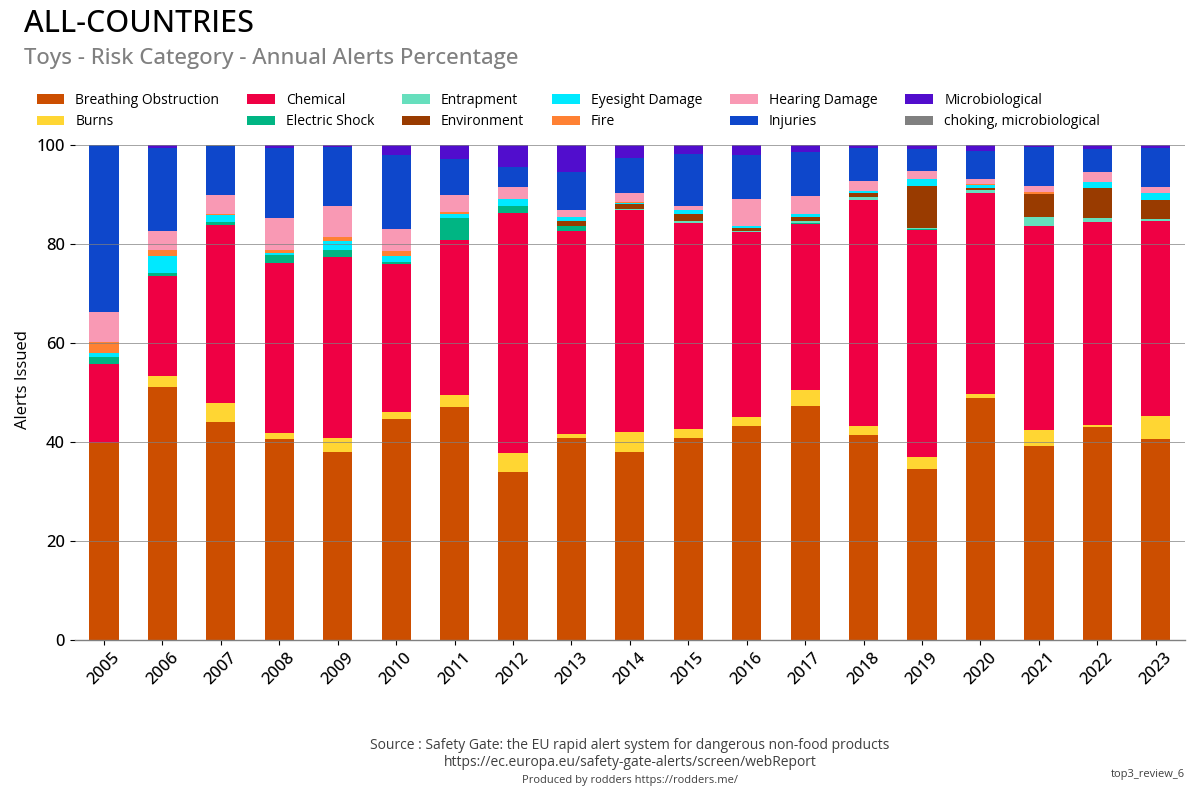
Over the last few years the Toys and Automotive categories are generally those with the most safety alerts.
The exception being 2023 where cosmetics took the top spot with 32% of all alerts issued being for cosmetic products.
The Toys category saw a slight decrease in alerts by 6.6%. Despite the drop, it still represents a substantial portion of the total alerts at 17.1%, indicating ongoing concerns in this category.
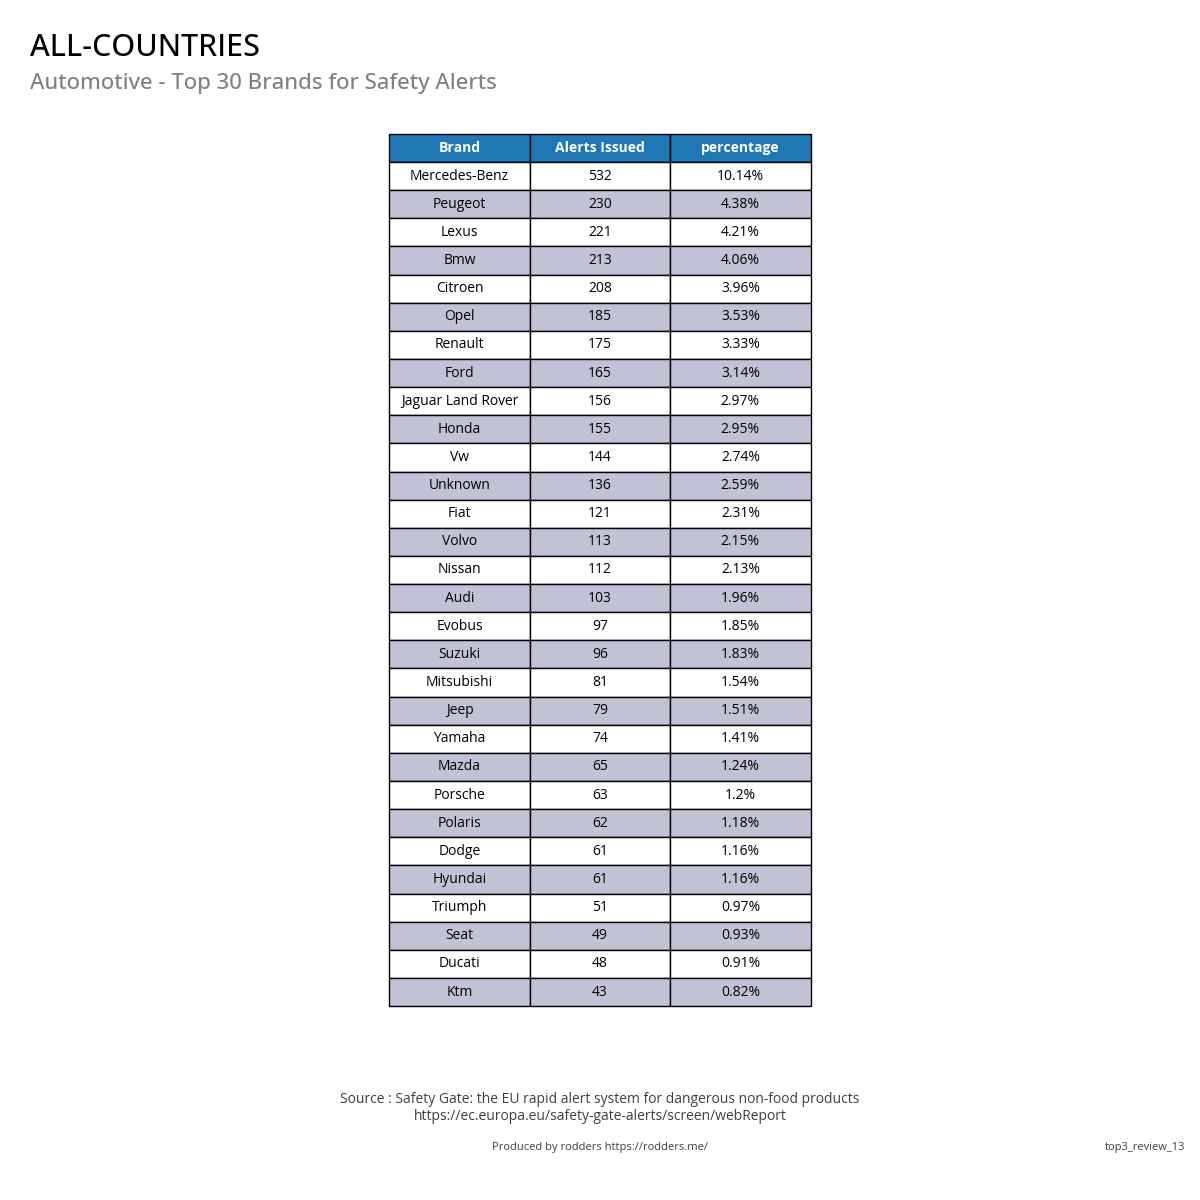
Automotive alerts increased by 17.1%, reflecting continued vigilance and possibly increased regulatory scrutiny or new safety standards affecting automotive products.
Electrical Appliances saw a significant increase of 98.2%, nearly doubling from the previous year. The rise may be due to enhanced safety checks and reporting mechanisms for electrical appliances.
What happened between 2022-2023?
Cosmetics
2023 was an exception with the introduction of the ban on the chemical lilial / BMHCA for use in cosmetics on 1st March 2022.
- In 2023 1,072 safety alerts were issued for products containing the chemical BMHCA
- Around 30% of these were issued to products manufactured in Italy
The significant increase seen 2023 over 2022 is due to a change in regulations for a Butylphenyl Methylpropional (BMHCA, trade name 'Lilial') BMHCA, a chemical commonly used in cosmetics.
BMHCA is now deemed to be hazardous and unsuitable for use in cosmetic products due to the fact that it is included in so many products. While an individual exposure poses a minimal risk, cumulative exposure from the use of multiple products containing this chemical increases the risk considerably.
It's also worth noting that BMHCA is a fragrance commonly used in household cleaning products, however no guidance has been issued for it's use in cleaning products at this stage.
BMHCA "Lilial" Molecule
Since 1 March 2022, butylphenyl methylpropional (BMHCA/'Lilial') is classified as a Carcinogenic, Mutagenic or Reprotoxic (CMR) category 1B substance under the EU and GB Classification, Labelling and Packaging (CLP) Regulations.
This ban affected around 1,100 - 1,200 products (90-95% of the annual increase of (1,249) alerts or 32-35% of all alerts issued (3,349) in 2023), and is the reason for the significant increase seen in the Safety Gate analysis.
UK and BMHCA
Article 15 of the UK and EU Cosmetics Regulations requires CMR-classified substances to undergo an exemption process to assess whether they can continue to be used as cosmetic ingredients. This regulatory process has not yet been completed under the UK Cosmetics Regulation. Therefore, the new EU provisions for BMHCA/'Lilial' do not apply in GB. However, a ban is expected in GB on 15 December 2022 (the 'off- shelf' date).
While companies have been working towards the deadline of 1 March 2022 for products for both the EU and UK markets, as advised by CTPA, as of revision date of this statement, BMHCA/'Lilial' can be legally used in cosmetic products in GB until:
- 15 October 2022, as placing on the market deadline;
- 15 December 2022, as making available (off-shelf) deadline.
The Cosmetic, Toiletry and Perfumery Association (CTPA) advised its members to voluntarily remove Lilial from cosmetic products by the end of 2021. The UK's cosmetic regulation has since been updated to include Lilial in Annex II LIST OF SUBSTANCES PROHIBITED IN COSMETIC PRODUCTS
What about other markets?
Lilial is still permitted for use in cosmetics in other countries outside the EU and the UK.
Scientific Opinion on BMHCA
Does the SCCS consider Butylphenyl methylpropional (p-BMHCA) safe for use as a fragrance ingredient in cosmetic leave-on and rinse-off type products in a concentration limit(s) according the ones set up by IFRA as reported above?
On individual product basis, Butylphenyl methylpropional (p-BMHCA) (CAS 80-54-6) with alpha-tocopherol at 200 ppm, can be considered safe when used as fragrance ingredient in different cosmetic leave-on and rinse-off type products. However, considering the first-tier deterministic aggregate exposure, arising from the use of different product types together, Butylphenyl methylpropional at the proposed concentrations cannot be considered as safe.
"first-tier deterministic aggregate exposure" refers to an initial, simplified assessment of total exposure to a particular substance from all sources and routes, using fixed input values for variables. This approach provides a preliminary estimate of exposure that can help identify potential risks and determine whether more detailed, possibly probabilistic, and higher-tier assessments are needed. It's a conservative approach that aims to ensure safety by not underestimating potential exposure levels, but it might not capture the full variability and uncertainty inherent in real-world exposure scenarios.
This Opinion is not applicable to the use of p-BMHCA in any sprayable products that could lead to exposure of the consumer's lung by inhalation.
Does the SCCS have any further scientific concerns with regard to the use of Butylphenyl methylpropional (p-BMHCA) as a fragrance ingredient in cosmetic leave-on and/or rinse-off type products?
Evaluation of this substance by other scientific bodies (e.g. under REACH) should also be taken into consideration by the Applicant for potential future assessment of the substance. Butylphenyl methylpropional is also used as a fragrance ingredient in some non-cosmetic products such as household cleaners and detergents. As no specific exposure data were made available to SCCS to assess exposure following these non-cosmetic uses, it was not possible to include them in the aggregated exposure scenarios. Therefore, the actual total exposure of the consumer may be higher than exposure from cosmetic products alone.
https://health.ec.europa.eu/system/files/2021-08/sccs_o_213_0.pdfThe European Cosmetics Industry
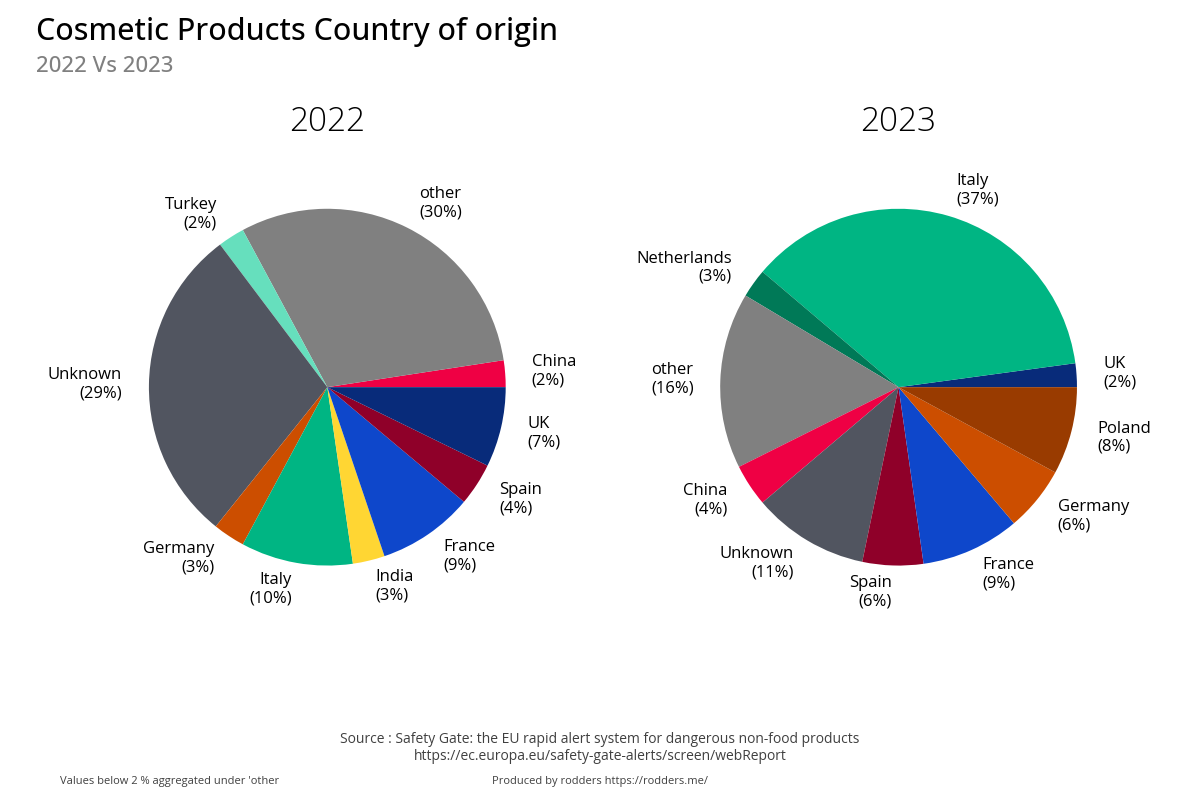
Cosmetics Country of Product Origin
Cosmetics Sub Categories affected by the ban
| product_sub_cat | 2022 | 2023 | change |
|---|---|---|---|
| Perfume/ Aftershave | 49 | 502 | 924.5% |
| Soap Products | 14 | 202 | 1342.9% |
| Moisturiser | 43 | 77 | 79.1% |
| Hair-Care Products | 23 | 87 | 278.3% |
| Deodorant Products | 2 | 89 | 4350.0% |
| Skin-Lightening Products | 36 | 28 | -22.2% |
| Make-up Products | 9 | 18 | 100.0% |
| Other | 3 | 17 | 466.7% |
| Sun-Protection Products | 5 | 14 | 180.0% |
| Skin-Care Products | 5 | 13 | 160.0% |
It is estimated that the cosmetics and personal care industry brings at least €29 billion in added value to the European economy annually. €11 billion is contributed directly by the manufacture of cosmetic products and €18 billion indirectly through the supply chain (Eurostat 2015).
Including direct, indirect and induced economic activity, the industry supports over 3.6 million jobs. In 2022, over 254,259 people were employed directly, and a further 2.78 million indirectly in the cosmetics value chain.
For every 10 workers employed in the European cosmetics and personal care industry, at least two further jobs are generated in the wider economy as a result of employees spending their wages on goods and services.
Source: https://cosmeticseurope.eu/our-industry/
Cosmetic Products Safety Gate Alerts, Country of origin
| Country of origin | 2022 | 2023 | change |
|---|---|---|---|
| Italy | 21 | 393 | 1771.4% |
| Unknown | 60 | 113 | 88.3% |
| France | 18 | 96 | 433.3% |
| Poland | 2 | 85 | 4150.0% |
| Germany | 6 | 63 | 950.0% |
| Spain | 8 | 59 | 637.5% |
| China | 5 | 41 | 720.0% |
| UAE | 12 | 32 | 166.7% |
| UK | 15 | 23 | 53.3% |
| Netherlands | 3 | 28 | 833.3% |
Italy and Cosmetics
Italy represents a significant portion of the European cosmetics and personal care products market, with a value of €11.5 billion.
This places Italy among the largest national markets within Europe, following Germany (€14.3 billion) and France (€12.9 billion).
Cosmetic Products Safety Gate Alerts, Top 30 Brands
| Brand | 2022 | 2023 | change |
|---|---|---|---|
| Unknown | 40 | 52 | 30.0% |
| Gordano Parfums | 1 | 40 | 3900.0% |
| Nivea | 0 | 39 | - |
| Real Time | 0 | 35 | - |
| Comin Parfum | 0 | 35 | - |
| Palmolive | 0 | 28 | - |
| Glamour Profumi | 3 | 24 | 700.0% |
| Tesori Doriente | 0 | 26 | - |
| Prady Parfums | 0 | 23 | - |
| Cuba | 0 | 23 | - |
| Omerta | 1 | 21 | 2000.0% |
| Malizia | 0 | 17 | - |
| Borotalco | 0 | 16 | - |
| Intesa | 0 | 16 | - |
| Vidal | 0 | 16 | - |
| Loreal Paris | 0 | 15 | - |
| Dorall Collection | 0 | 14 | - |
| Perlier | 0 | 12 | - |
| Dream Cosmetics | 5 | 6 | 20.0% |
| Mavi Profumi | 0 | 11 | - |
| Creation Lamis | 0 | 11 | - |
| Jfenzi | 0 | 11 | - |
| Biopoint | 0 | 10 | - |
| Breeze | 0 | 10 | - |
| Perfume De Qualitè | 0 | 10 | - |
| Vittorio Bellucci | 0 | 10 | - |
| Splendor | 2 | 7 | 250.0% |
| Neutro Med | 0 | 9 | - |
| New Brand | 0 | 9 | - |
| Dove | 0 | 9 | - |
Which countries' products get the most alerts?
The following visualisations show theEconomic Area of Product Origin with categories defined as:
EU Countrieswithin Schengen or European Economic Area (Ex Italy for visibility of 2023 alerts)Italy- Italy represents around 15% of all alerts issued in 2023 and is highlighted for the 2023 exceptionOutside EU- Every other country not within the Eu CountriesChina- China represents a large proportion of Global Trade
| economic_area | 2022 | 2023 | change |
|---|---|---|---|
| China | 1,033 | 1,166 | 12.9% |
| EU Countries | 456 | 1,270 | 178.5% |
| Outside EU | 583 | 809 | 38.8% |
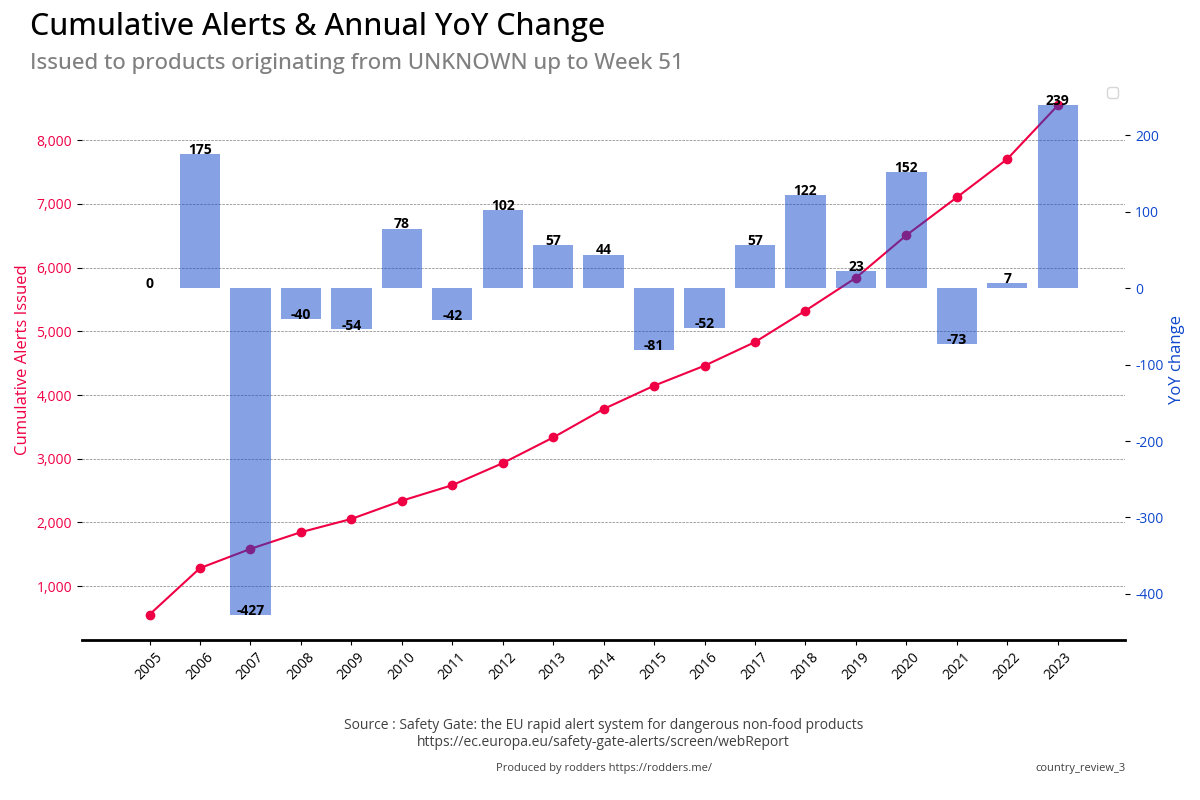
Country of Product Origin
Within the Top 15 countries are two entries :
other Where the country isn't in the top 15, and represents 2,933 products or 8.4% of the total
Unknown Where the reporting member didn't record the country of origin, and represents 9,173
products, or 25.8% of the total Alerts issued| country_top15 | 2022 | 2023 | change |
|---|---|---|---|
| Unknown | 602 | 841 | 39.7% |
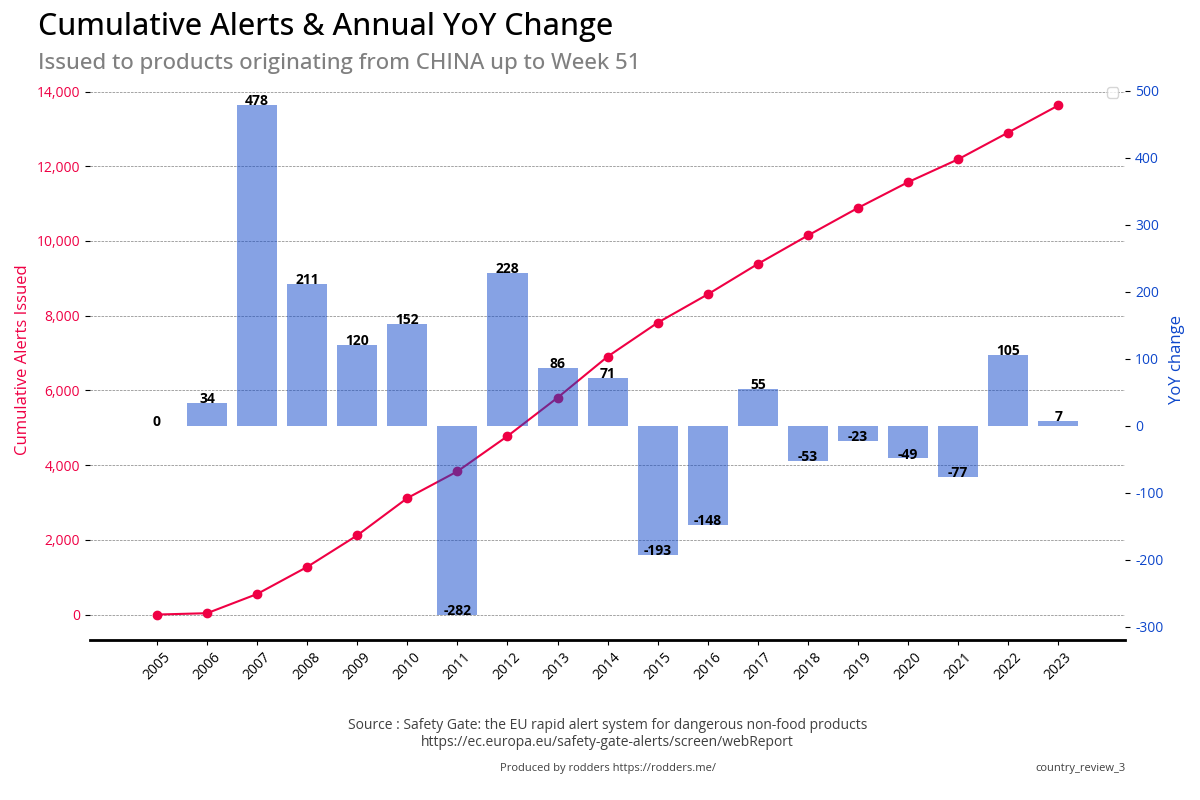
| China | 717 | 724 | 1.0% |
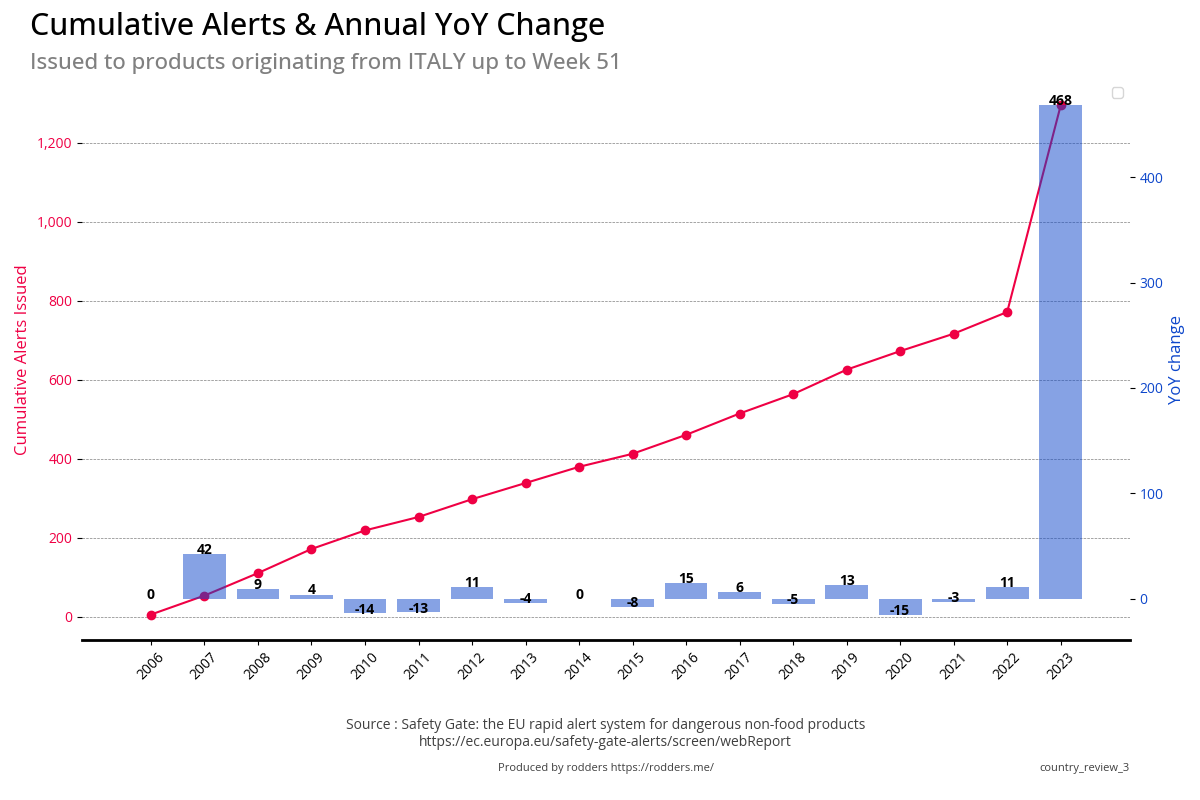
| Italy | 55 | 523 | 850.9% |
| other | 162 | 262 | 61.7% |
| Germany | 146 | 241 | 65.1% |
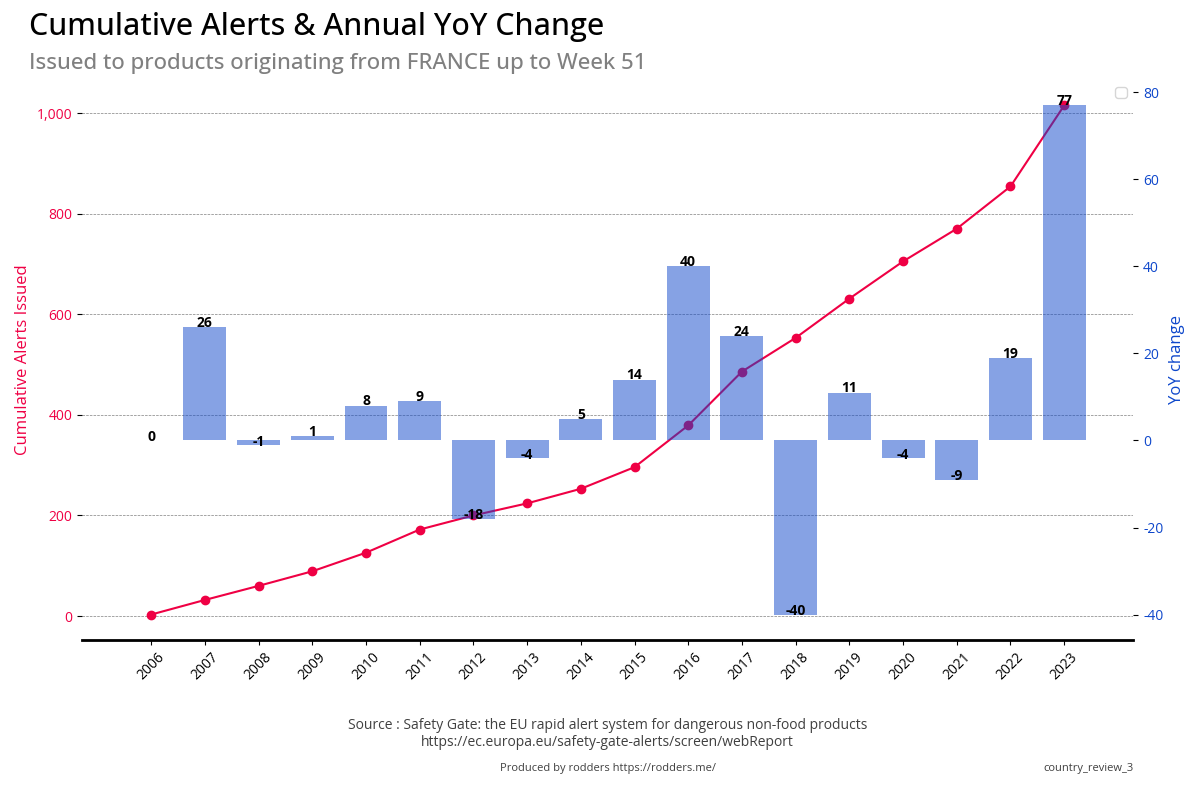
| France | 84 | 161 | 91.7% |
| Poland | 27 | 116 | 329.6% |
| Turkey | 73 | 65 | -11.0% |
| Spain | 25 | 87 | 248.0% |
| UK | 45 | 63 | 40.0% |
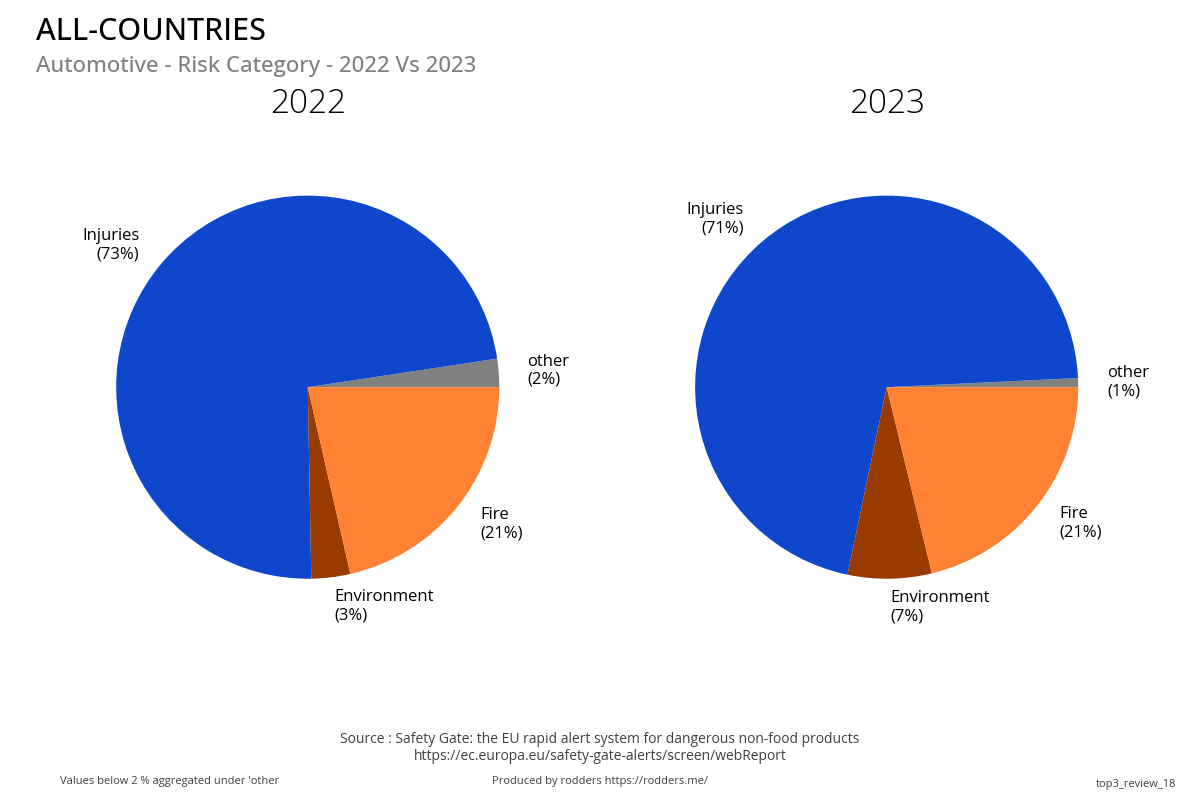
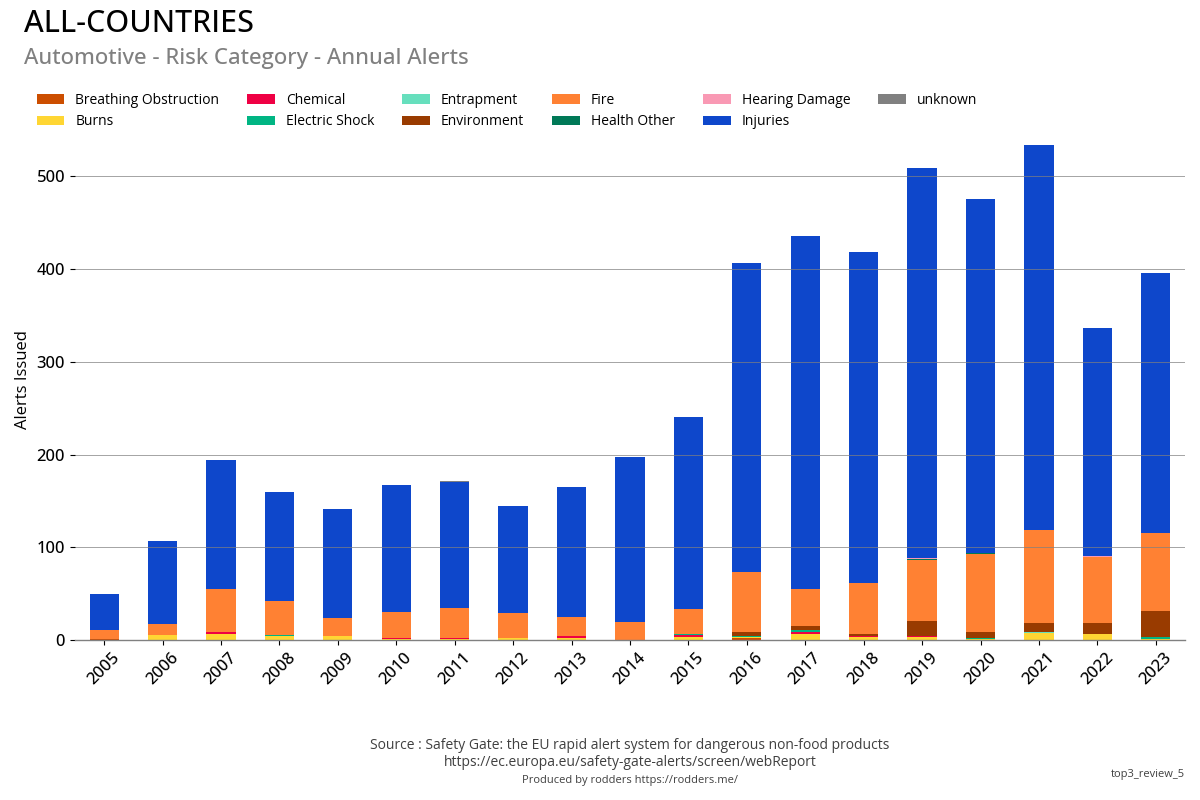
Risk Category
In the context of non-food product safety alerts on the European Safety Gate website, product categories are meticulously mapped to various risk types to enhance consumer protection and regulatory oversight.
This mapping is further consolidated in this report from the 81 Product Categories in Safety Gate to a simplified group of categories more suited to analysis.
Further mapping has taken place on the Risk Category field to reduce this from 221 categories to 13 risk_categories used in this reporting.
This mapping enables a detailed understanding of the specific hazards associated with different types of products.
The identified risk_categories include Breathing Obstruction, Burns, Chemical, Drowning, Electric Shock, Entrapment, Environment, Eyesight Damage, Fire, Health Other, Hearing Damage, Injuries, and Microbiological. Each risk type represents a potential danger that a product could pose to consumers. For example, toys might be linked to risks such as Breathing Obstruction and Choking, while electrical appliances might be associated with risks like Electric Shock and Fire. By categorizing products according to these risk types, the European Safety Gate provides a structured framework for reporting and responding to safety issues.
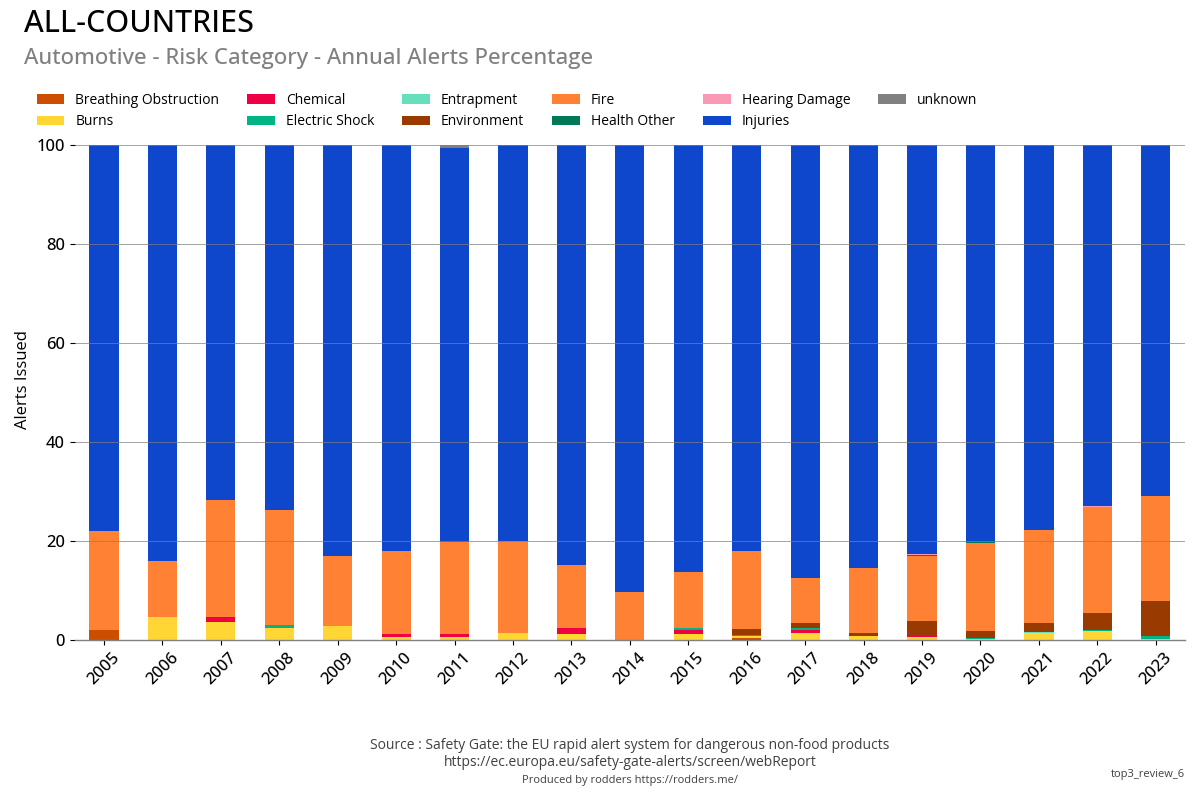
- The majority of Injury risks come from the automotive product category (9.7% of 2022/2023 total)
- The majority of risks from Toys are breathing obstruction (7% of total) and chemical (7% of total)
- As previously noted the cosmetics risk is from the recent ban of the chemical BMHCA
| risk_category | 2022 | 2023 | change |
|---|---|---|---|
| Chemical | 729 | 1,682 | 130.7% |
| Injuries | 515 | 648 | 25.8% |
| Breathing Obstruction | 334 | 264 | -21.0% |
| Electric Shock | 127 | 177 | 39.4% |
| Environment | 84 | 192 | 128.6% |
| Burns | 120 | 98 | -18.3% |
| Fire | 77 | 111 | 44.2% |
| Microbiological | 28 | 25 | -10.7% |
| Eyesight Damage | 21 | 20 | -4.8% |
| Drowning | 17 | 5 | -70.6% |
Product Category mapped to Risk Category
| product_category | Breathing Obstruction | Burns | Chemical | Drowning | Electric Shock | Entrapment | Environment | Eyesight Damage | Fire | Health Other | Hearing Damage | Injuries | Microbiological |
|---|---|---|---|---|---|---|---|---|---|---|---|---|---|
| Automotive | 0 | 7 | 0 | 0 | 3 | 0 | 39 | 0 | 156 | 0 | 1 | 526 | 0 |
| Chemicals | 0 | 1 | 152 | 0 | 0 | 0 | 0 | 0 | 0 | 0 | 0 | 0 | 1 |
| Childcare Equipment |
71 | 1 | 8 | 1 | 0 | 8 | 0 | 0 | 0 | 2 | 1 | 75 | 1 |
| Clothing Fashion |
108 | 0 | 130 | 0 | 0 | 1 | 6 | 0 | 0 | 0 | 0 | 198 | 0 |
| Cosmetics | 2 | 0 | 1245 | 0 | 0 | 0 | 3 | 0 | 0 | 0 | 0 | 3 | 26 |
| E-Cig | 0 | 0 | 76 | 0 | 0 | 0 | 0 | 0 | 0 | 0 | 0 | 2 | 1 |
| Electrical Appliances |
0 | 55 | 58 | 0 | 199 | 0 | 137 | 3 | 9 | 0 | 0 | 21 | 13 |
| Hobby Sports |
2 | 2 | 37 | 4 | 0 | 0 | 4 | 0 | 0 | 0 | 0 | 14 | 0 |
| Jewellery | 0 | 0 | 278 | 0 | 0 | 0 | 8 | 0 | 0 | 0 | 0 | 0 | 0 |
| Lighting | 0 | 37 | 2 | 0 | 87 | 0 | 10 | 0 | 1 | 0 | 0 | 3 | 0 |
| Machinery | 0 | 5 | 0 | 0 | 12 | 0 | 0 | 10 | 1 | 0 | 0 | 78 | 0 |
| Other | 29 | 88 | 50 | 15 | 3 | 6 | 23 | 15 | 21 | 0 | 4 | 73 | 2 |
| Protective Equipment |
5 | 0 | 9 | 2 | 0 | 0 | 0 | 1 | 0 | 0 | 0 | 114 | 2 |
| Toys | 381 | 22 | 366 | 0 | 0 | 5 | 46 | 12 | 0 | 0 | 15 | 56 | 7 |
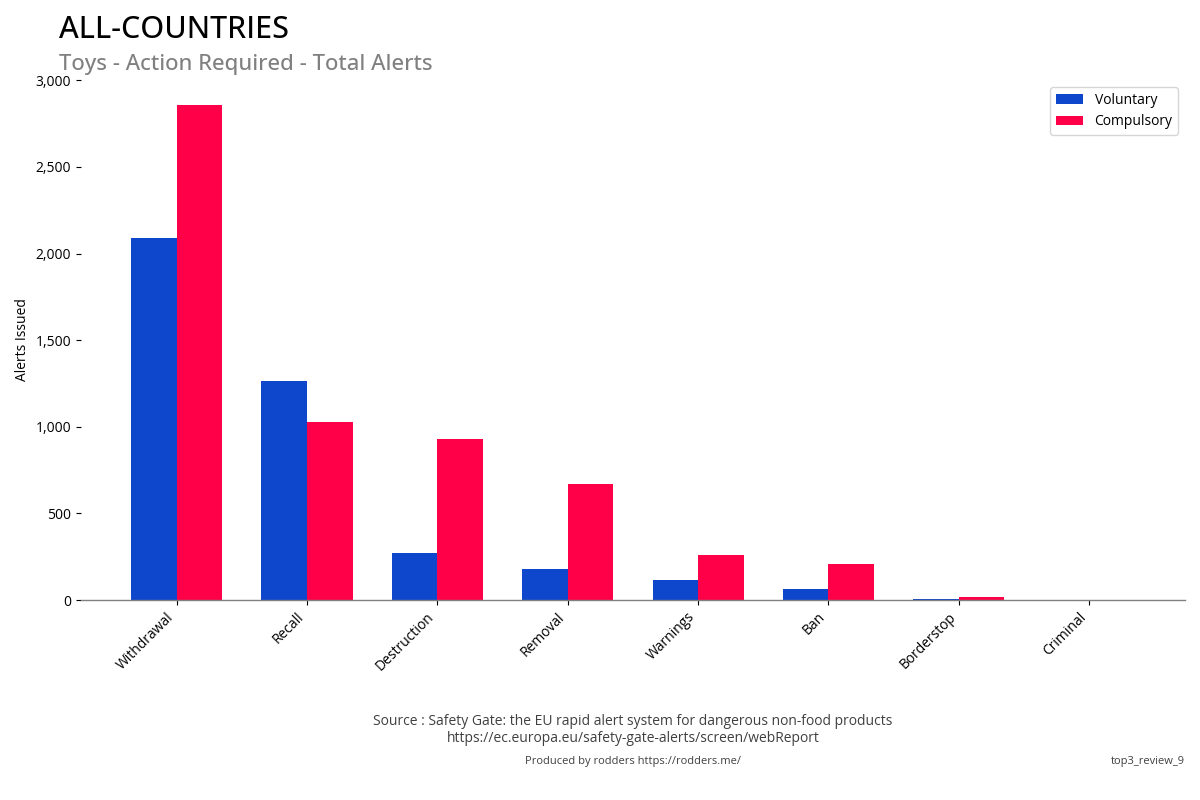
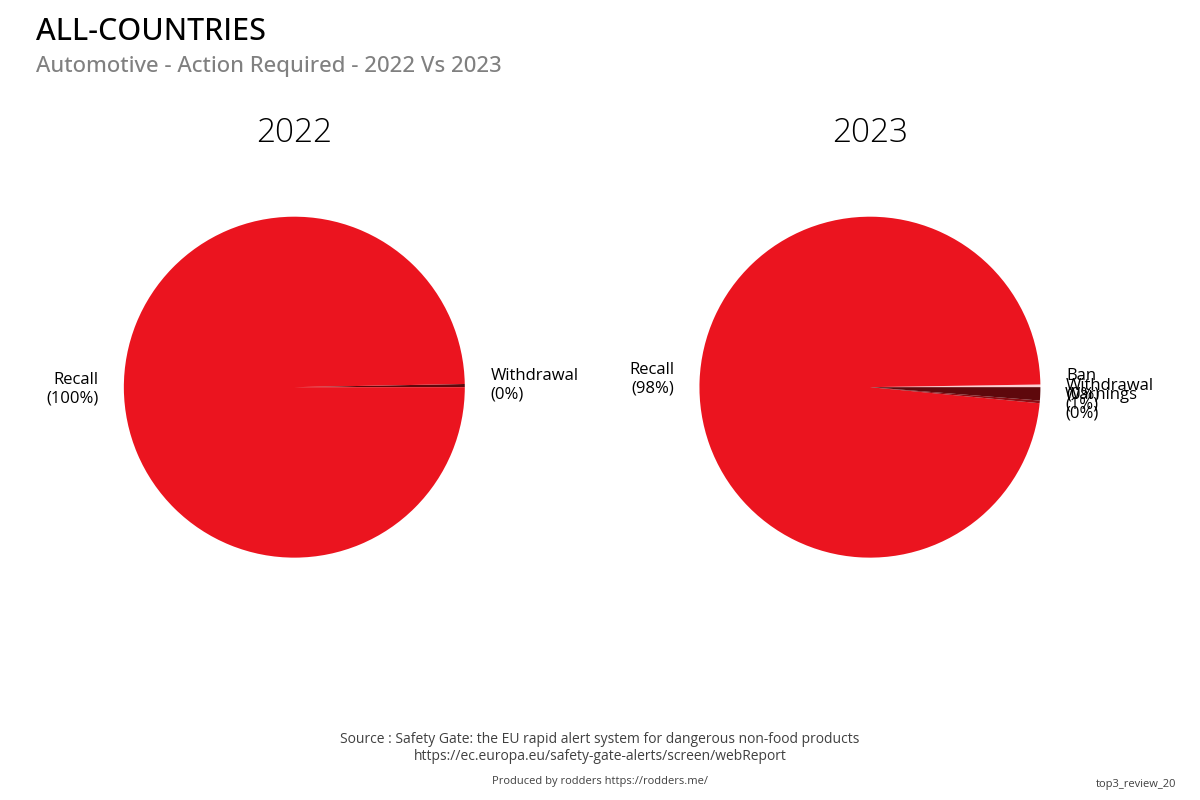
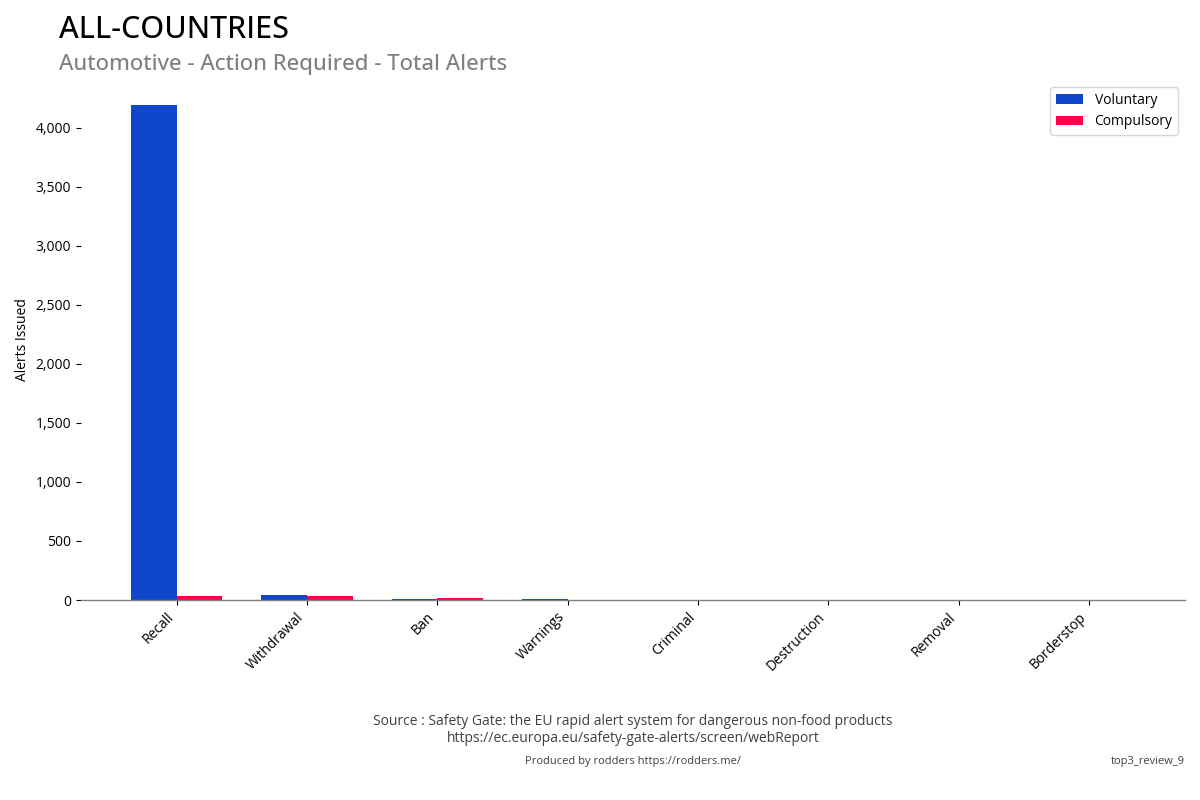
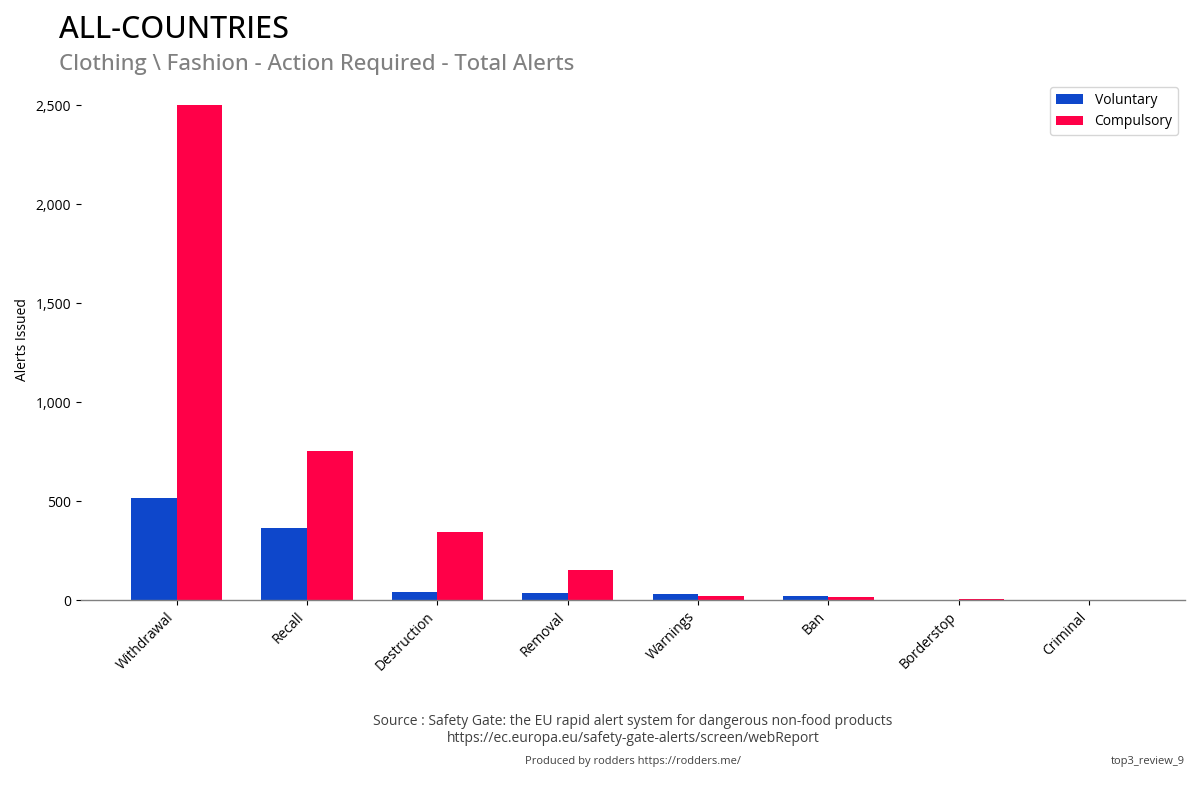
Action Required
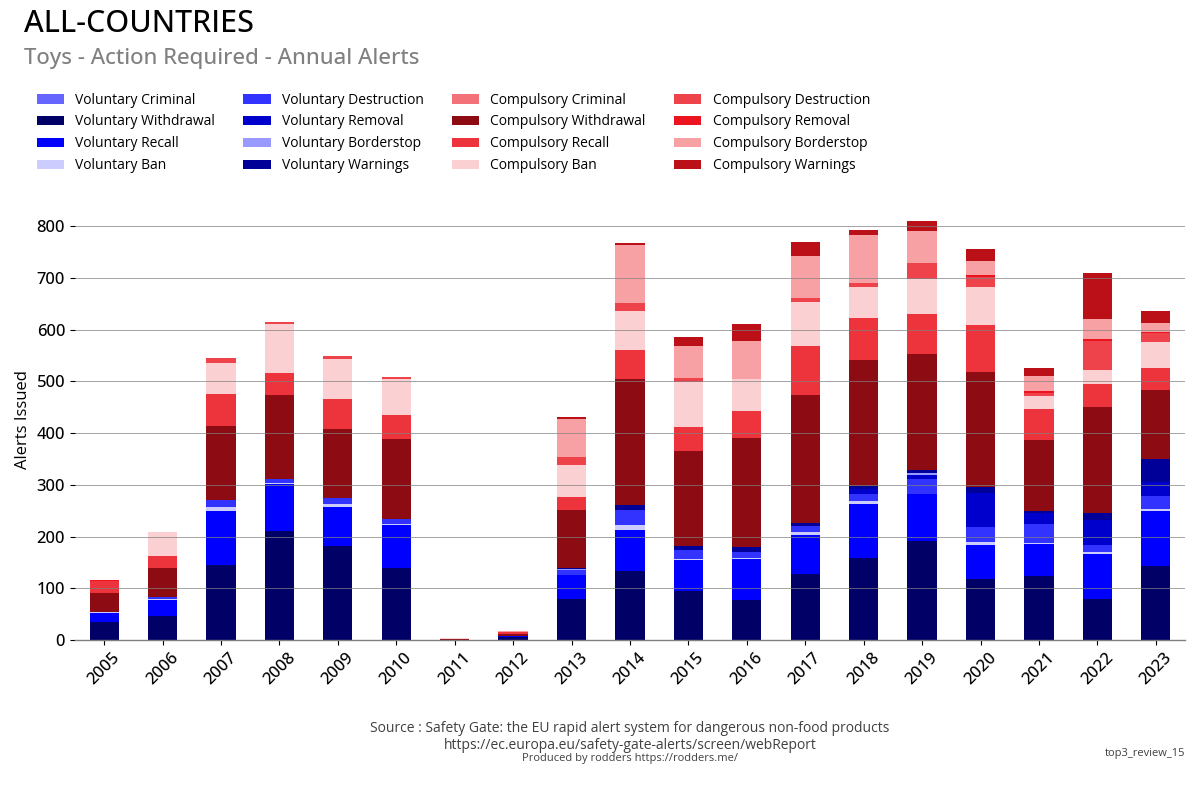
The increase in the percentage of alerts requiring a ban from sale in 2023 is due to the ban of the chemical BMHCA in cosmetics.The term "action required" delineates the measures that need to be taken to address identified safety concerns. These actions can be either voluntary or compulsory. Voluntary actions are initiated by the responsible party, such as the manufacturer, importer, or distributor, who, upon recognizing a potential safety issue, proactively undertakes corrective measures. These may include product recalls, issuing safety warnings, or making design changes to enhance product safety. Voluntary actions reflect the responsible party's commitment to consumer safety and regulatory compliance.
Conversely, compulsory actions are mandated by regulatory authorities following inspections, market surveillance, or consumer complaints.
| action | 2022 | 2023 | change |
|---|---|---|---|
| Withdrawal | 909 | 1,232 | 35.5% |
| Recall | 815 | 1,004 | 23.2% |
| Ban | 169 | 1,078 | 537.9% |
| Removal | 206 | 216 | 4.9% |
| Warnings | 195 | 162 | -16.9% |
| Borderstop | 135 | 179 | 32.6% |
| Destruction | 117 | 153 | 30.8% |
| Criminal | 0 | 2 | - |
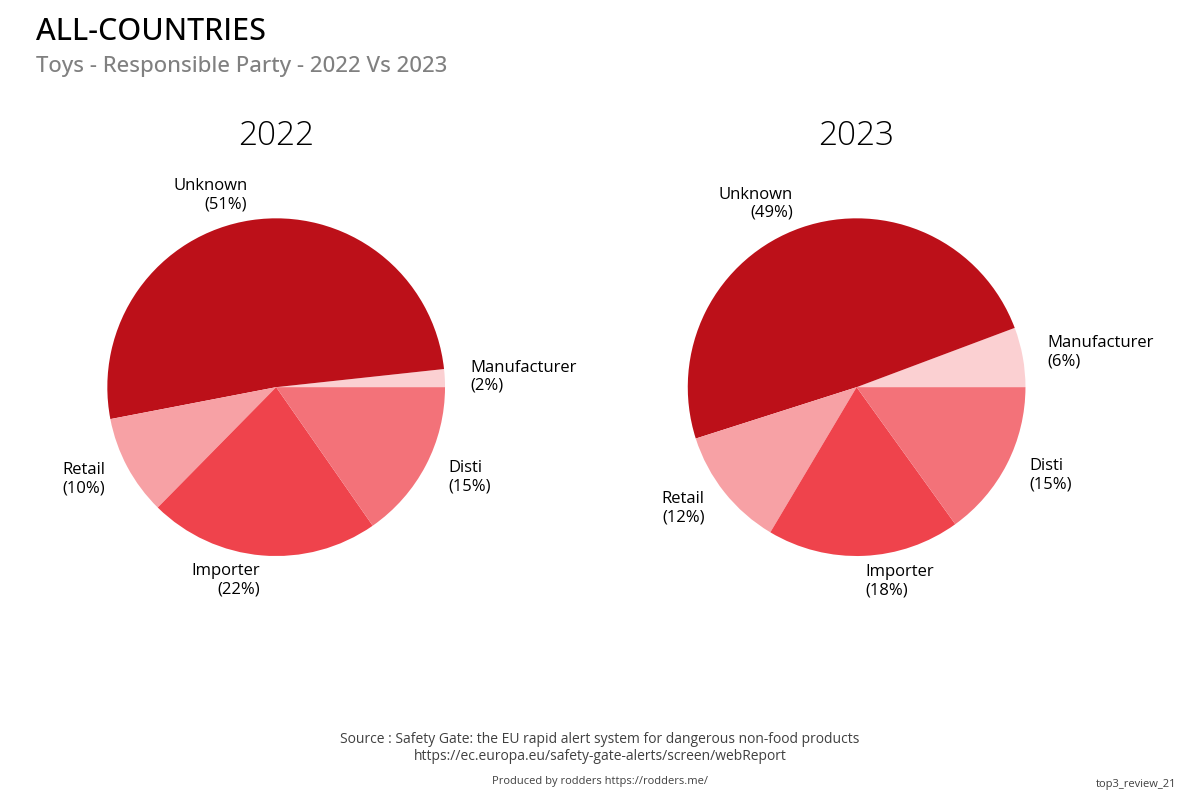
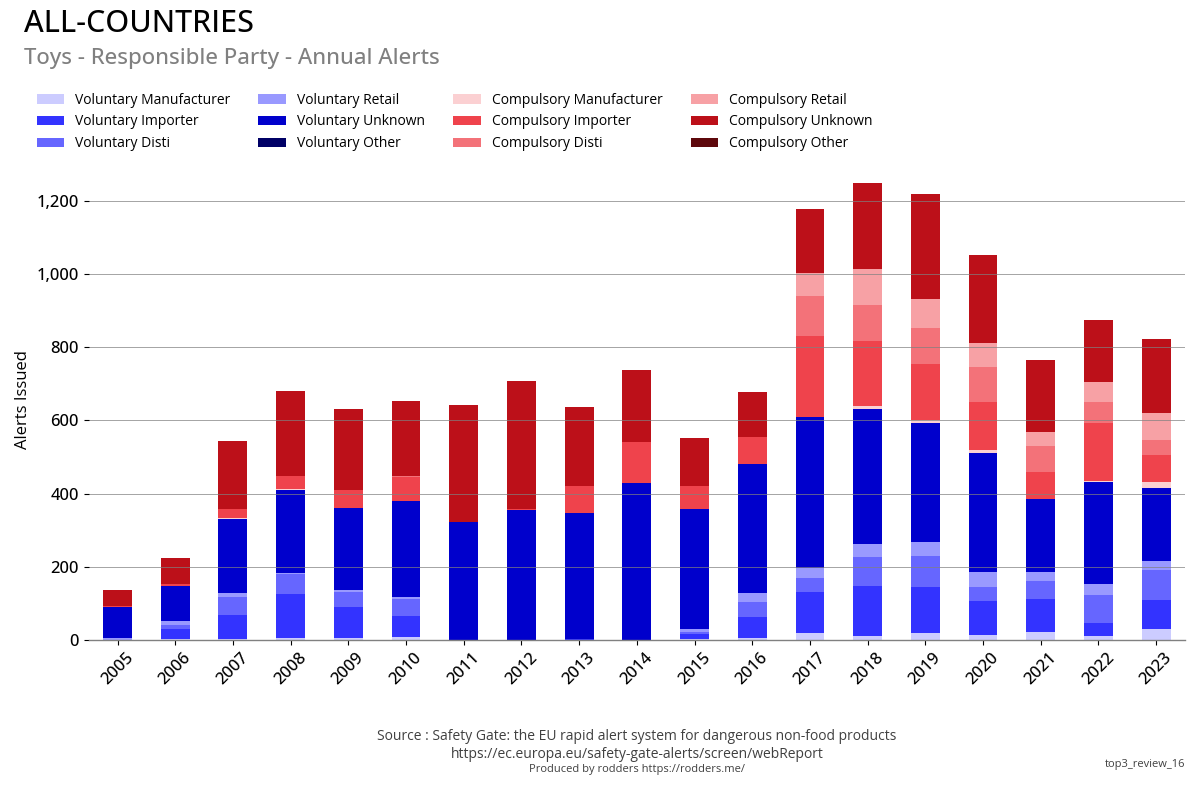
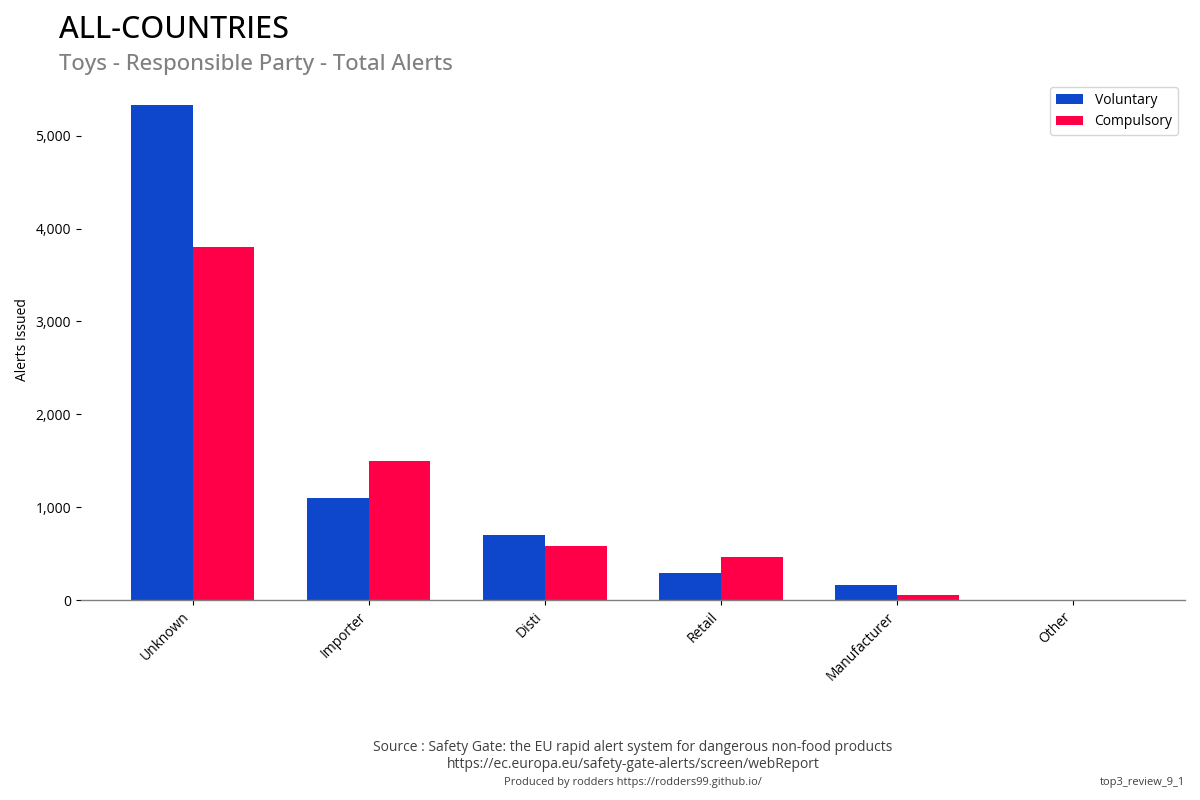
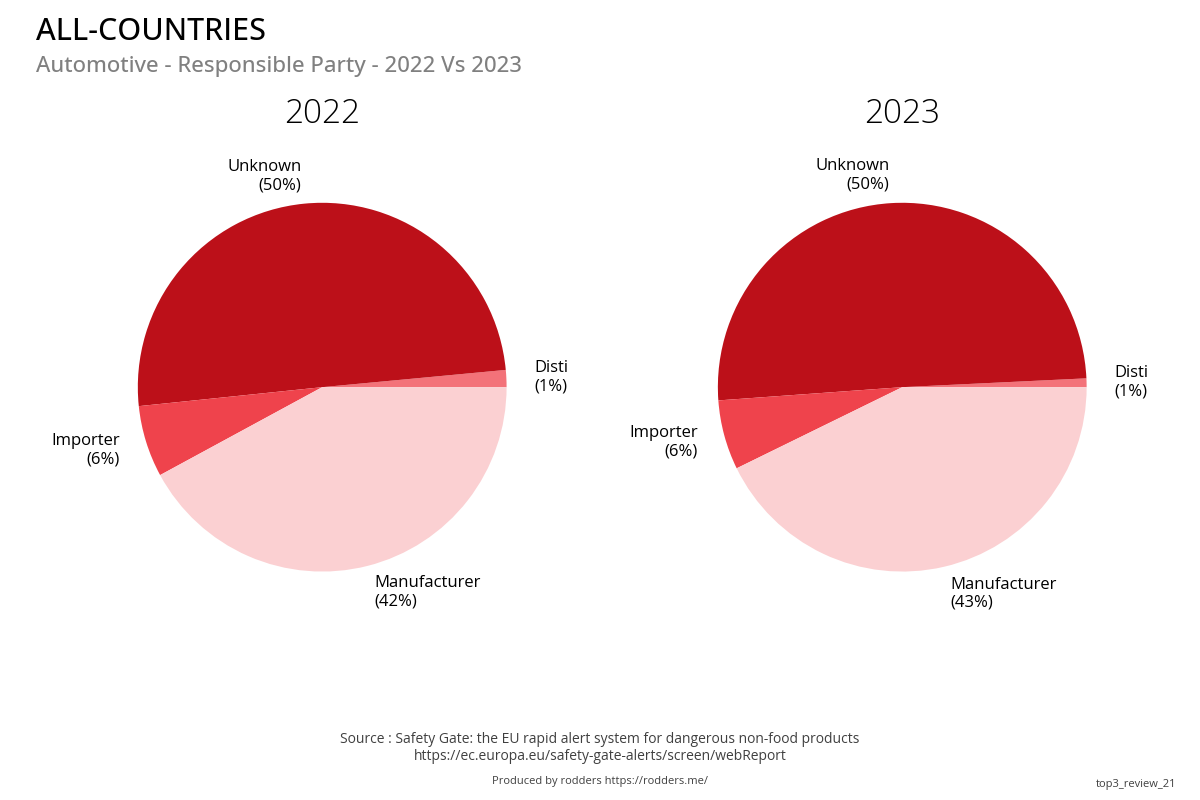
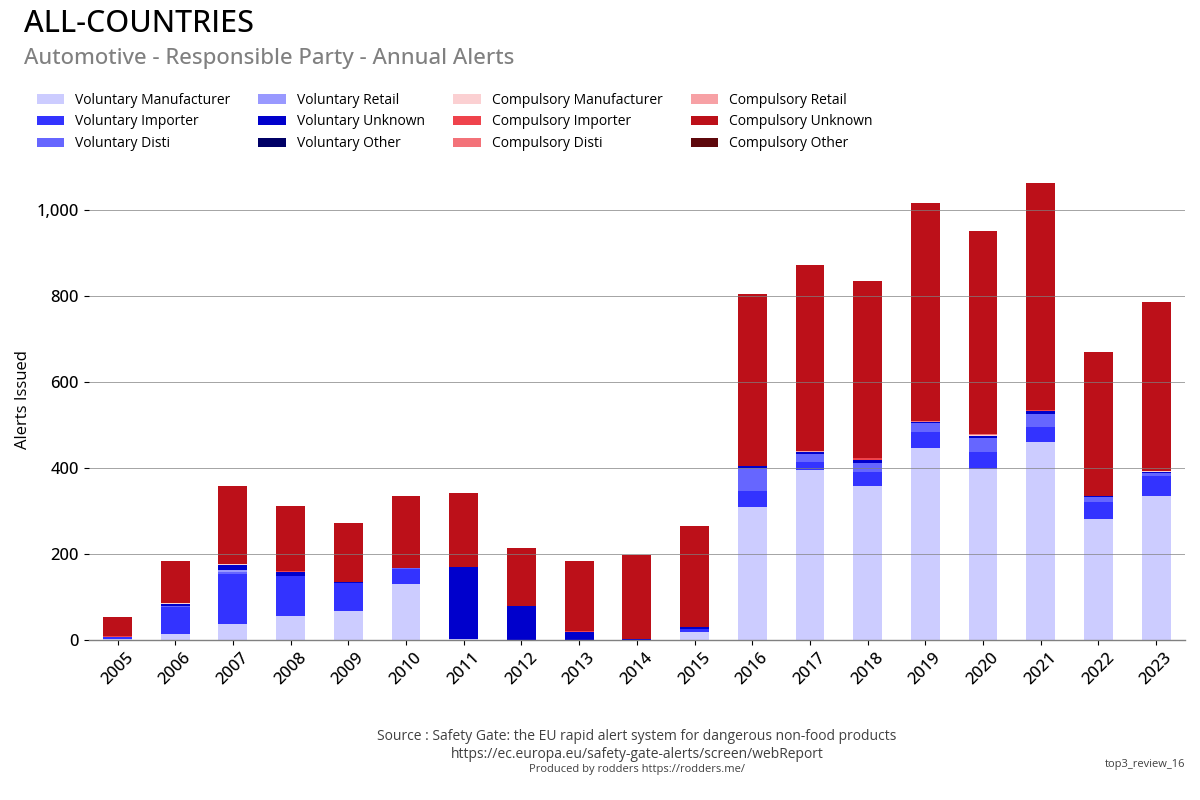
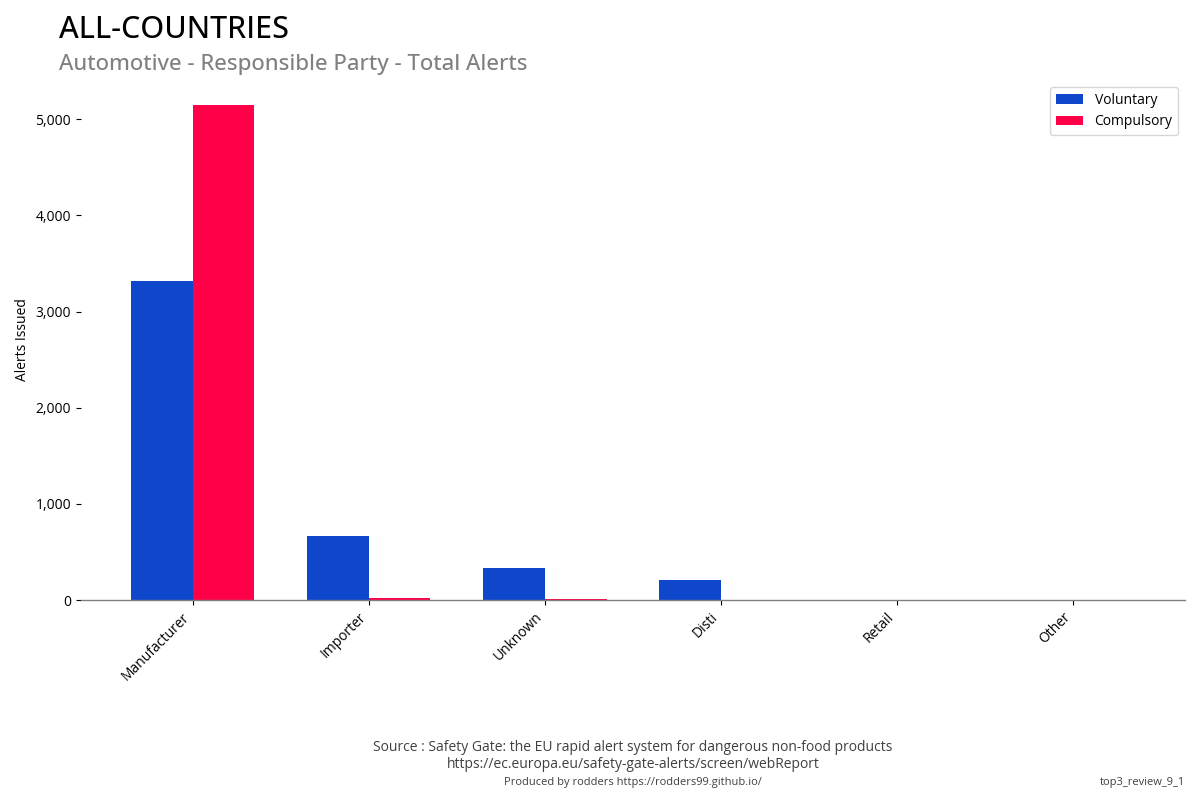
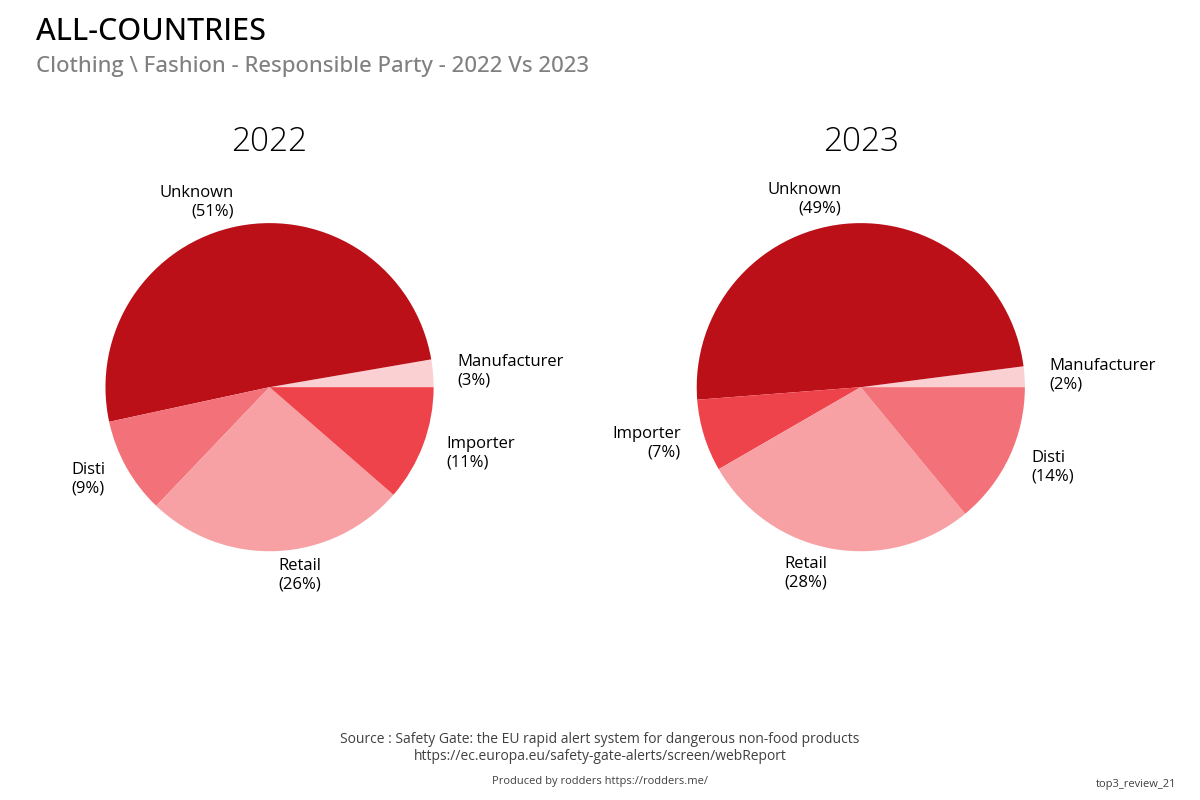
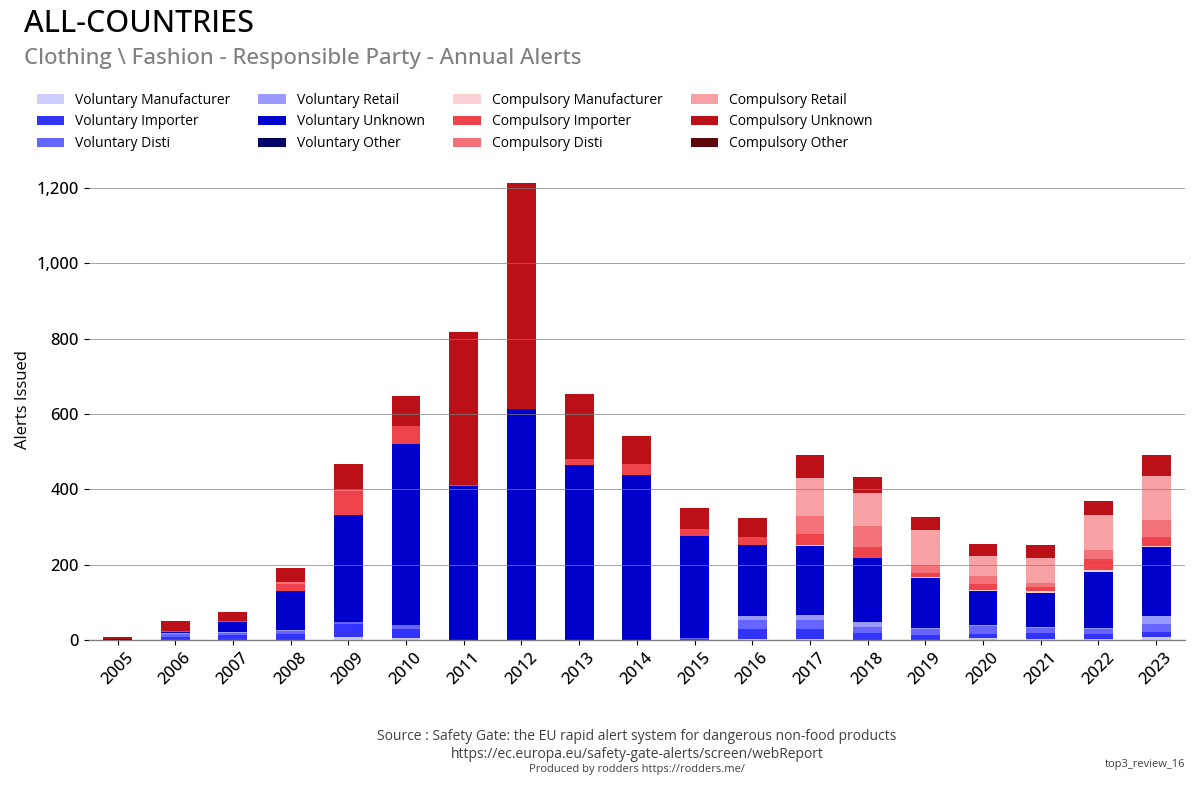
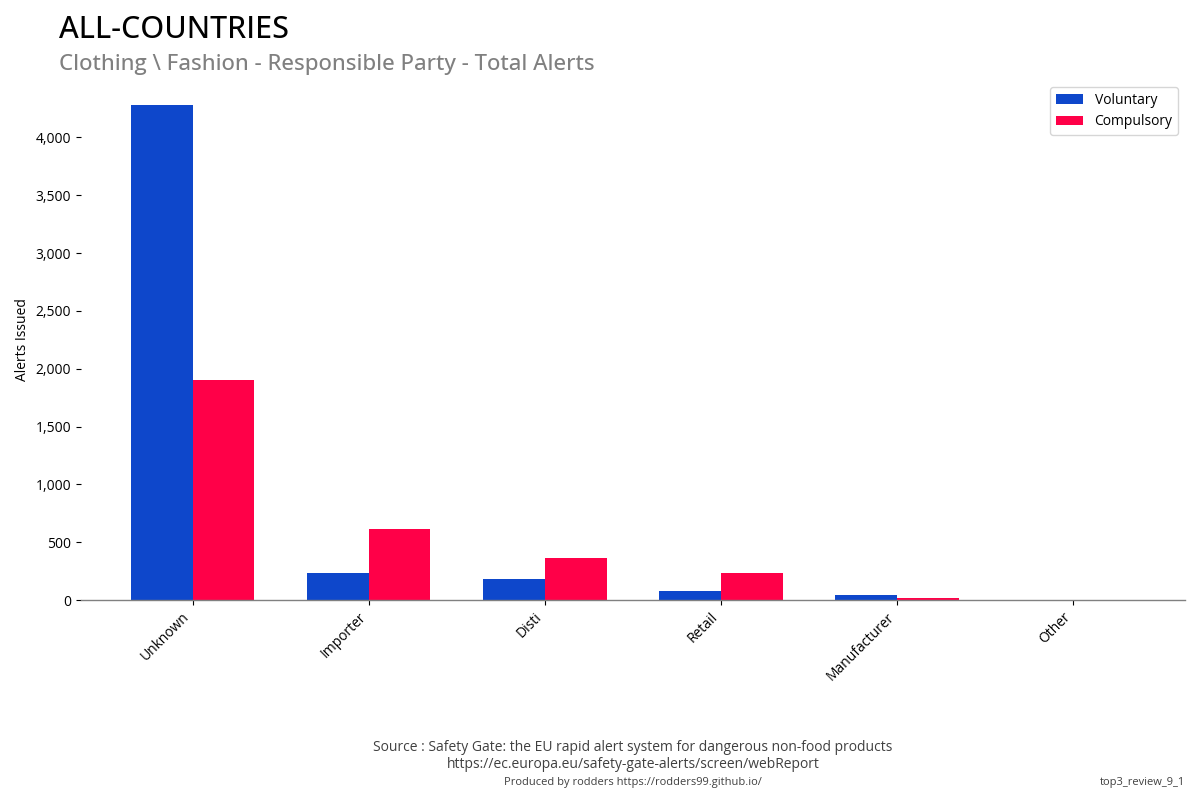
Responsible Party
The term "responsible party" refers to the entity accountable for the product safety issue. The identification of the responsible party can occur through two distinct pathways: voluntary or compulsory. A voluntary identification occurs when the responsible party, such as a manufacturer, importer, or distributor, proactively raises a safety alert regarding their product. This demonstrates a commitment to consumer safety and regulatory compliance, allowing for swift action to mitigate potential risks. On the other hand, compulsory identification happens through regulatory action, where authorities, during routine inspections or investigations, identify the responsible party and mandate corrective measures.
| responsible | 2022 | 2023 | change |
|---|---|---|---|
| Unknown | 1,967 | 3,125 | 58.9% |
| Disti | 436 | 1,291 | 196.1% |
| Importer | 608 | 625 | 2.8% |
| Manufacturer | 450 | 601 | 33.6% |
| Retail | 344 | 653 | 89.8% |
Top 30 Worldwide brands for Safety Alerts
| Brand | 2022 | 2023 | change |
|---|---|---|---|
| Unknown | 474 | 661 | 39.5% |
| Mercedes-Benz | 52 | 40 | -23.1% |
| Lexus | 20 | 22 | 10.0% |
| Bmw | 16 | 25 | 56.2% |
| Gordano Parfums | 1 | 40 | 3900.0% |
| Nivea | 0 | 39 | - |
| Citroen | 15 | 21 | 40.0% |
| Real Time | 0 | 35 | - |
| Comin Parfum | 0 | 35 | - |
| Opel | 17 | 17 | 0.0% |
| Peugeot | 21 | 13 | -38.1% |
| Palmolive | 0 | 28 | - |
| Ford | 10 | 18 | 80.0% |
| Glamour Profumi | 3 | 24 | 700.0% |
| Tesori Doriente | 0 | 26 | - |
| Jaguar Land Rover | 9 | 16 | 77.8% |
| Prady Parfums | 0 | 24 | - |
| Cuba | 0 | 23 | - |
| Omerta | 1 | 21 | 2000.0% |
| Vw | 8 | 13 | 62.5% |
| Ds | 10 | 8 | -20.0% |
| Fyrværkerieksperten | 3 | 15 | 400.0% |
| Malizia | 0 | 17 | - |
| Vidal | 0 | 16 | - |
| Intesa | 0 | 16 | - |
| Kia | 7 | 9 | 28.6% |
| Borotalco | 0 | 16 | - |
| Hyundai | 8 | 7 | -12.5% |
| Fiat | 7 | 8 | 14.3% |
| Loreal Paris | 0 | 15 | - |
Top 15 Countries - Key Fact sheets
Programmatically created reproductions of the Top 3 Risk and Product categories by country visualisation in the official Fact sheet. Safety_Gate_2023_Factsheet_EN.pdf
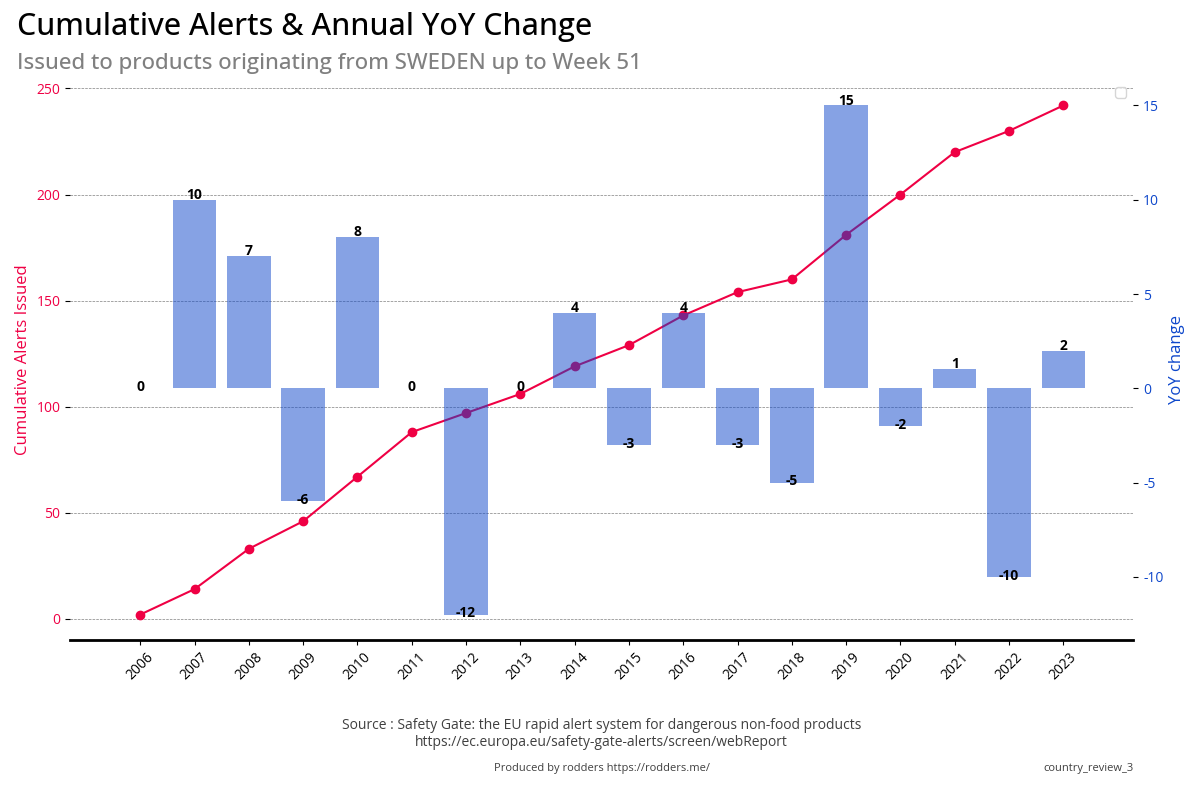
| Country | Annual Total | Cumulative Total and YoY Change |
|---|---|---|
| China | 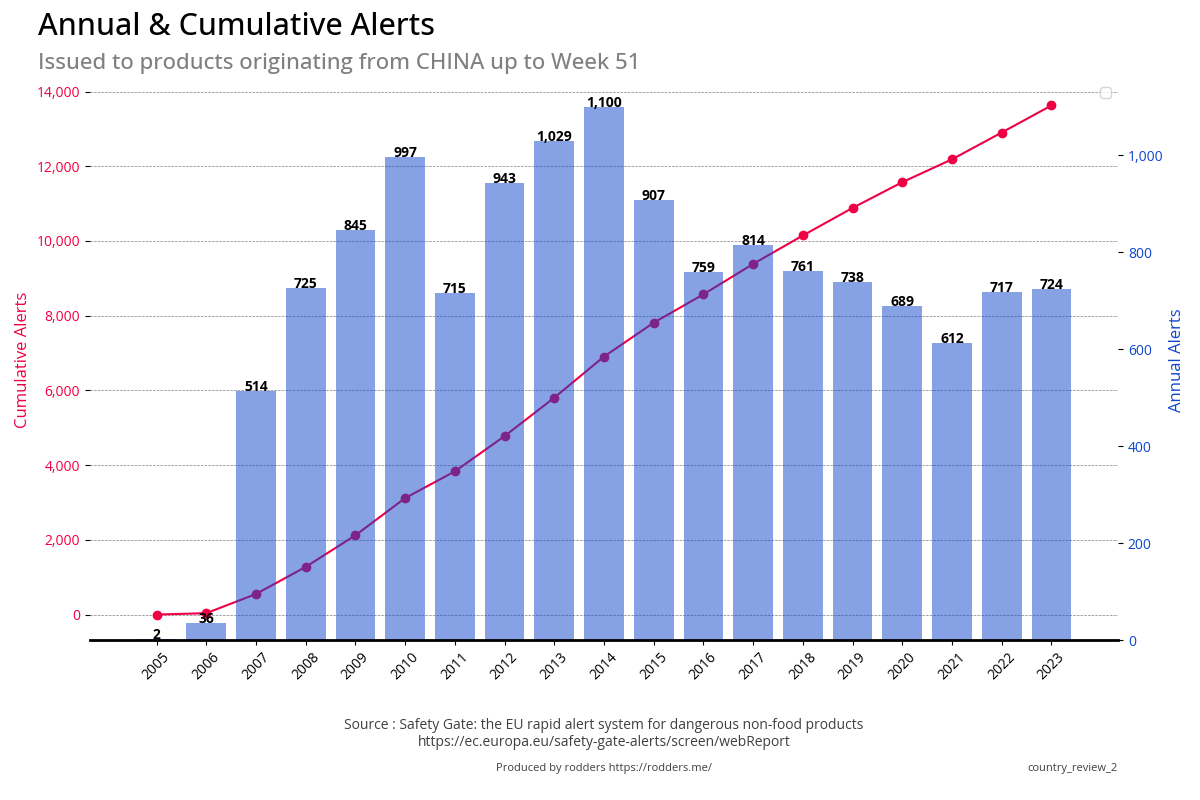 |
|
| China | 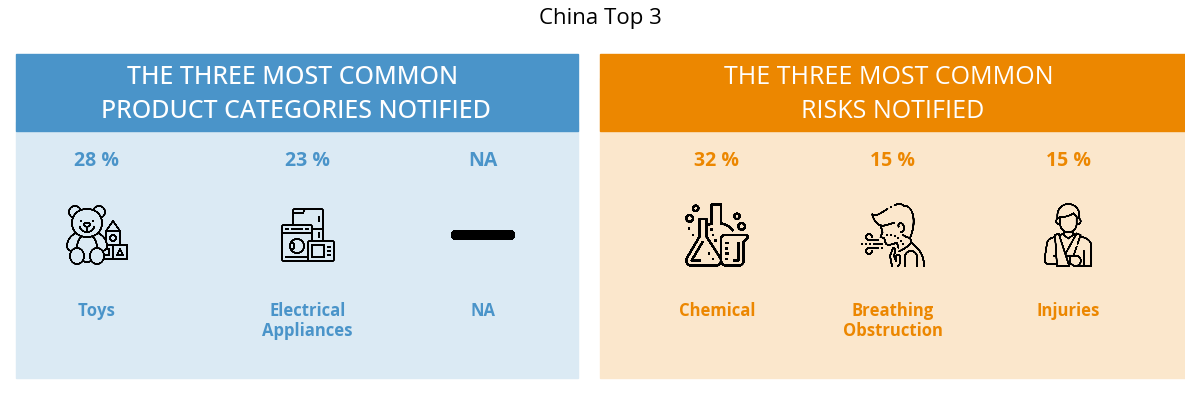 |
|
| France | 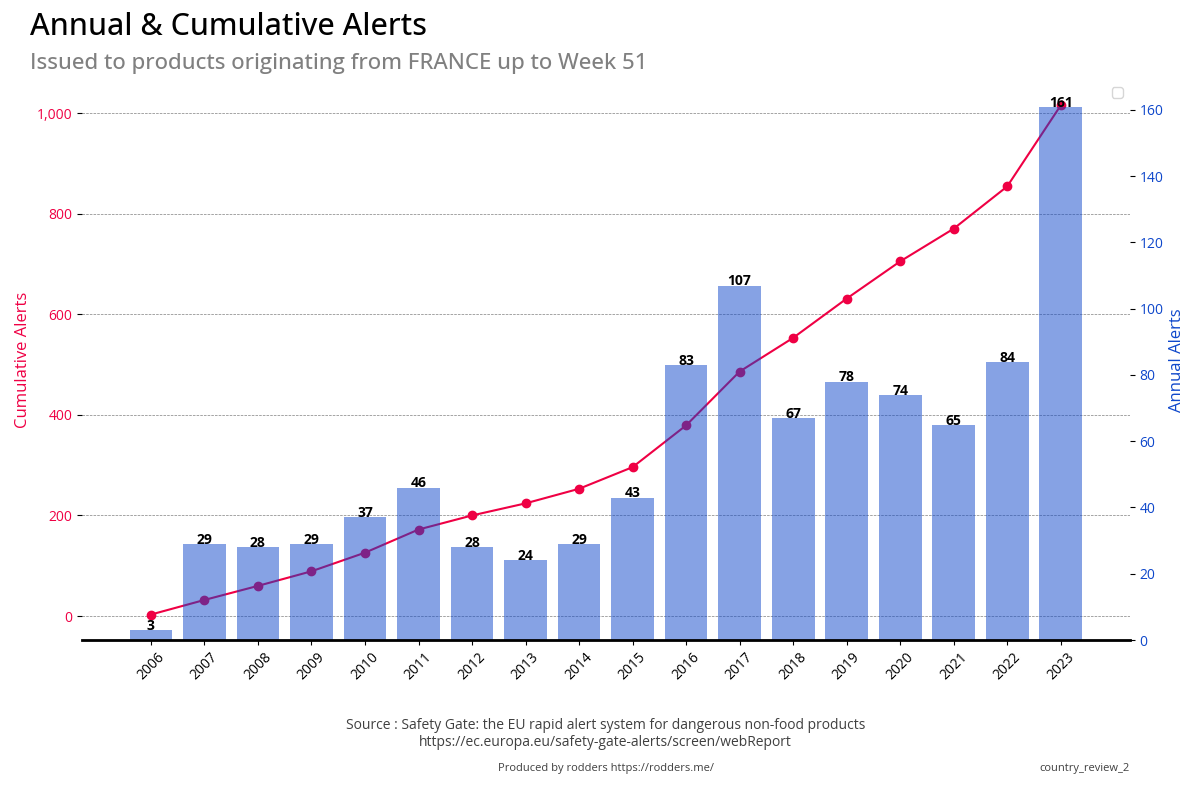 |
 |
| France | 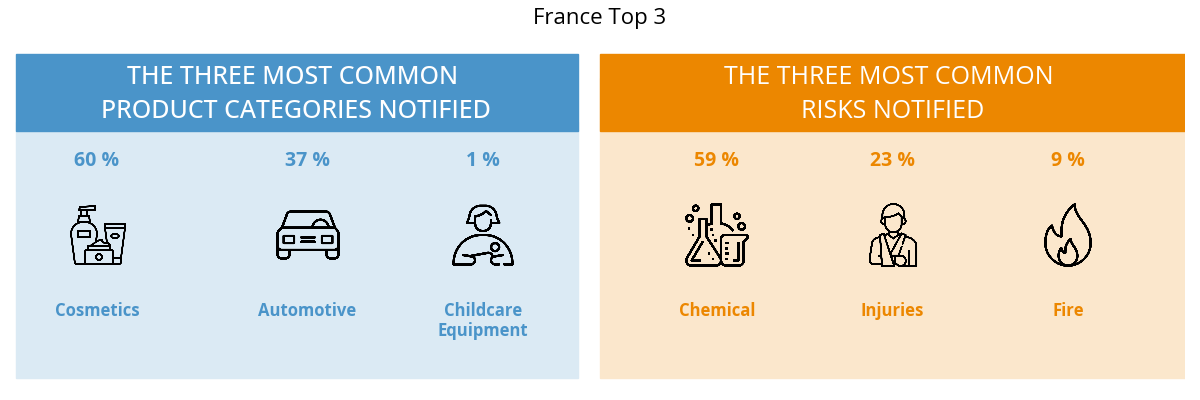 |
|
| Germany | 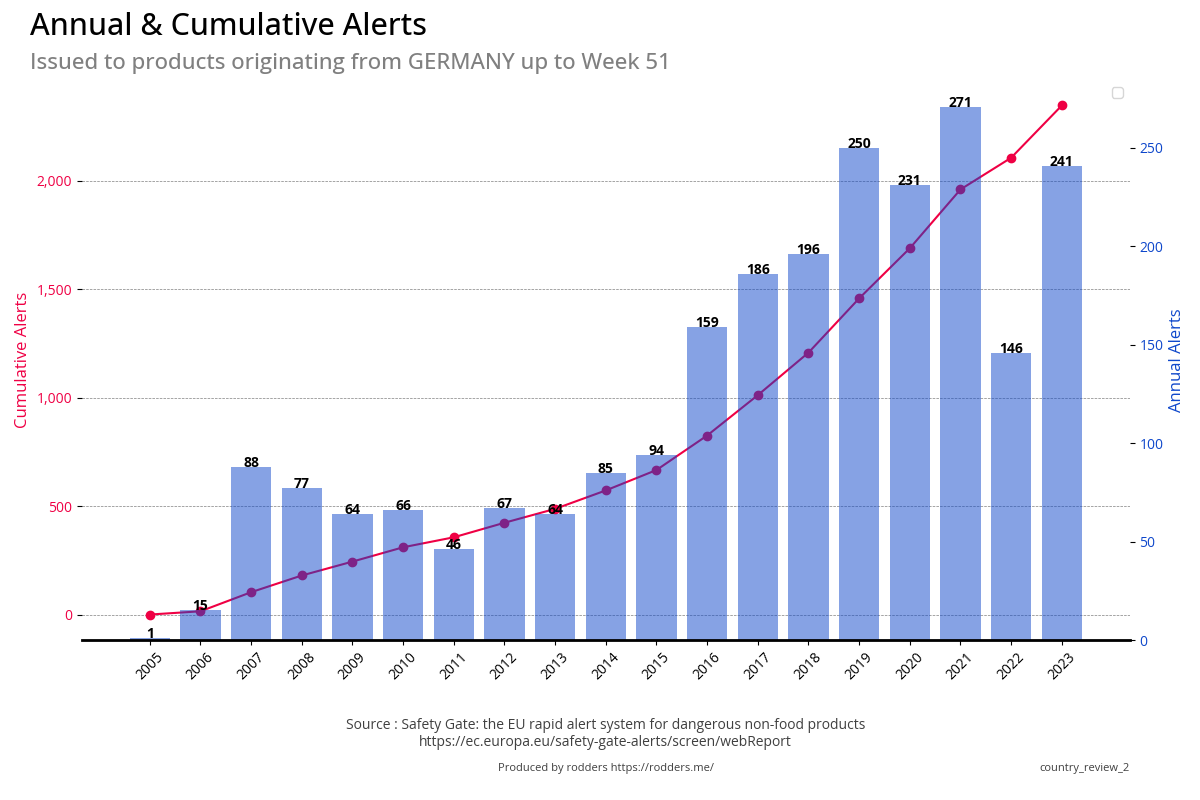 |
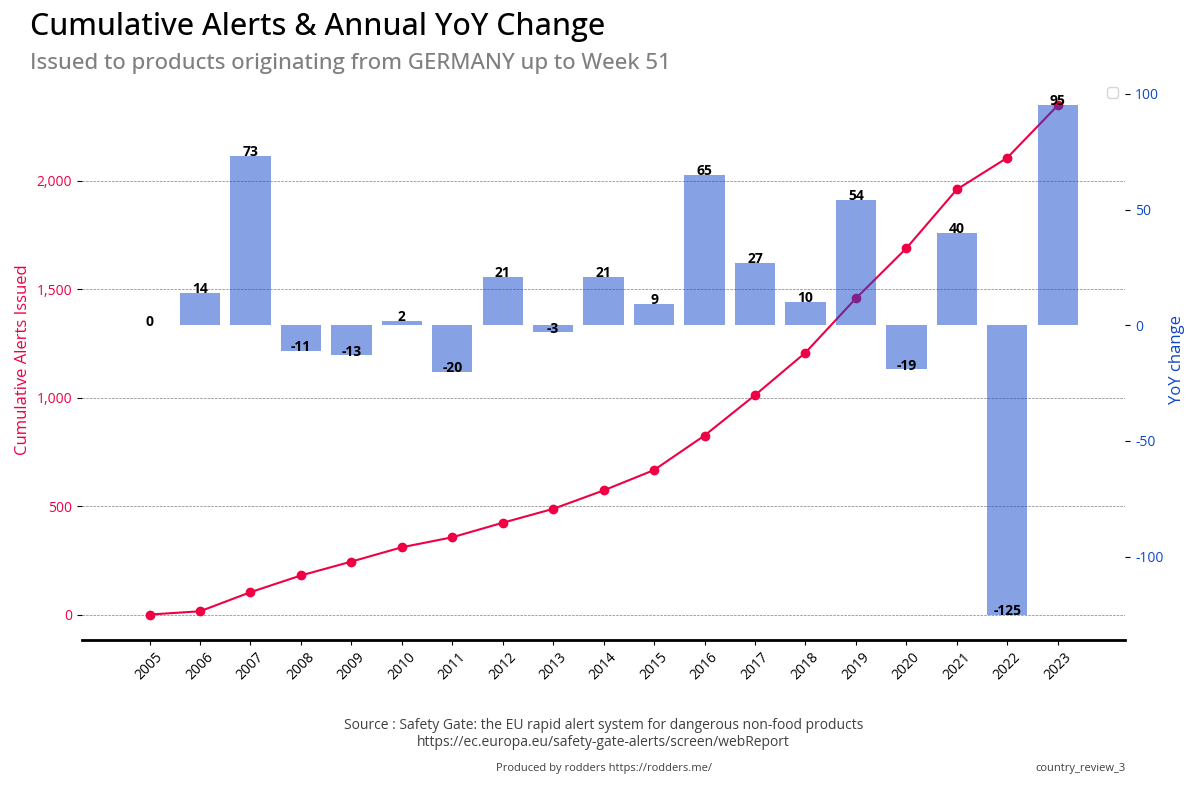 |
| Germany | 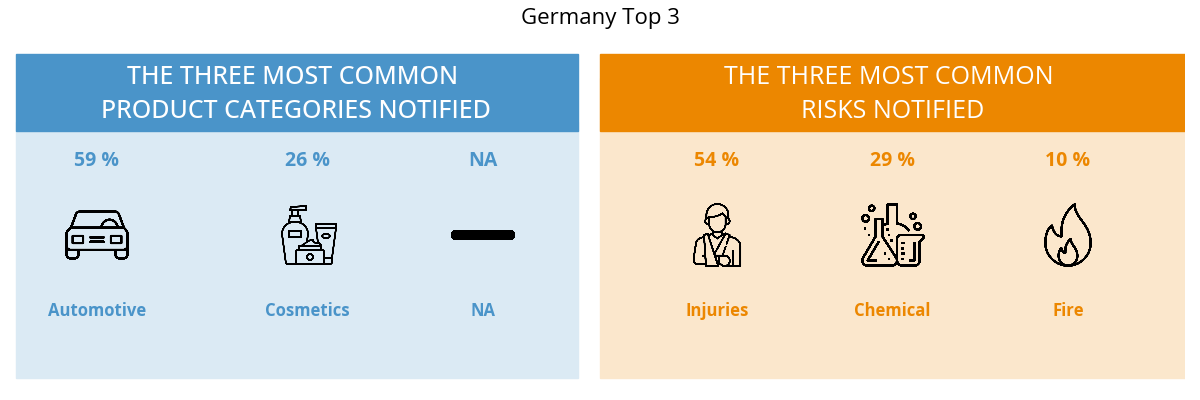 |
|
| India | 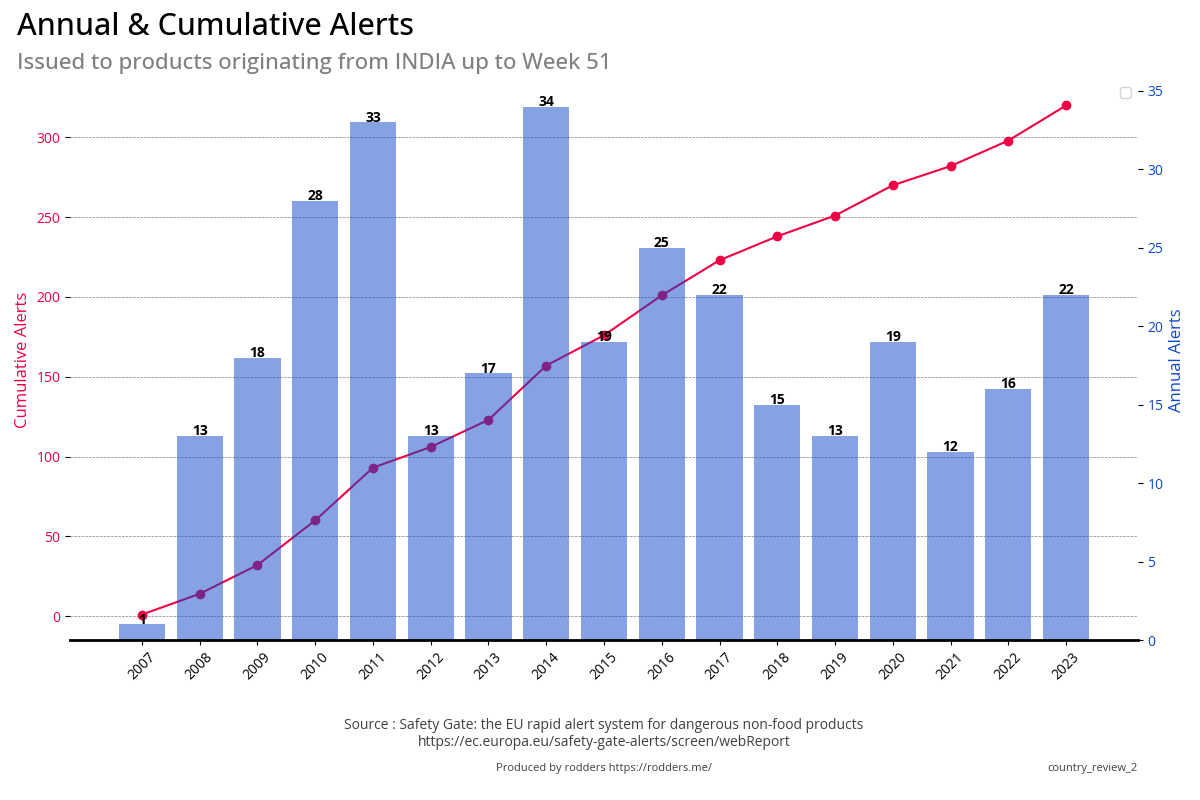 |
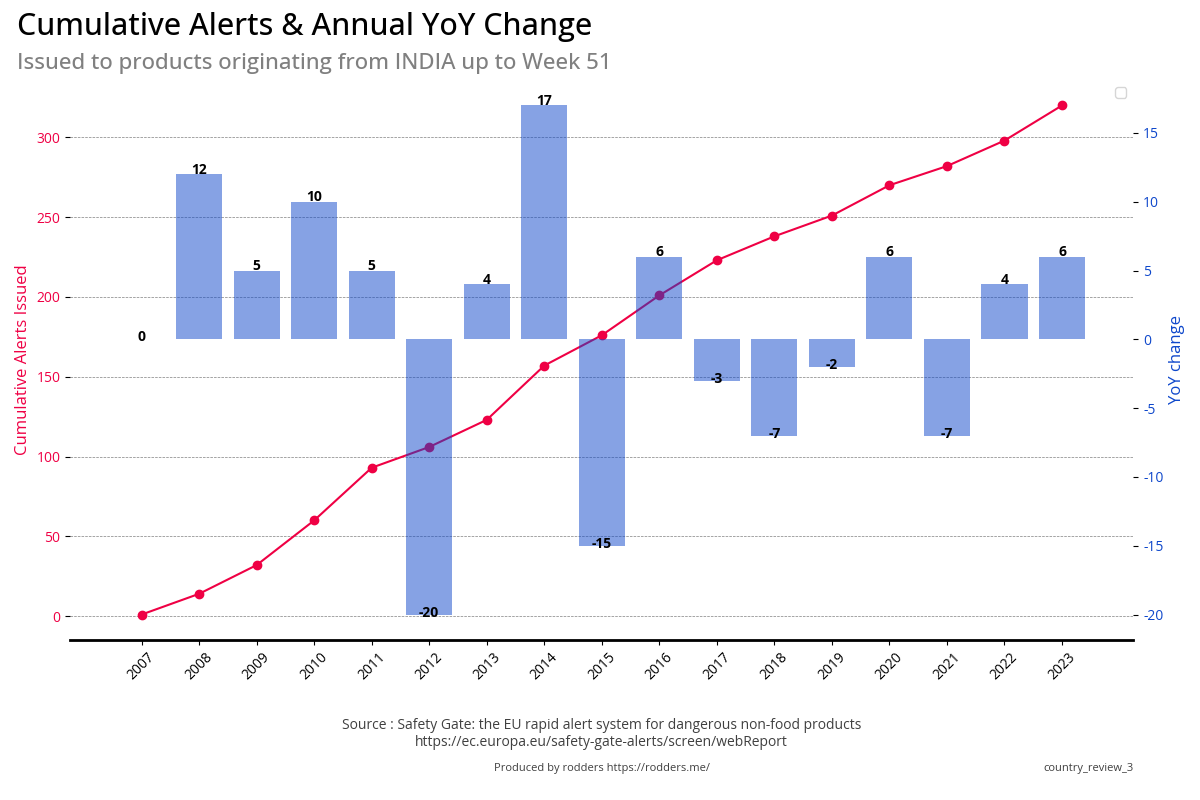 |
| India | 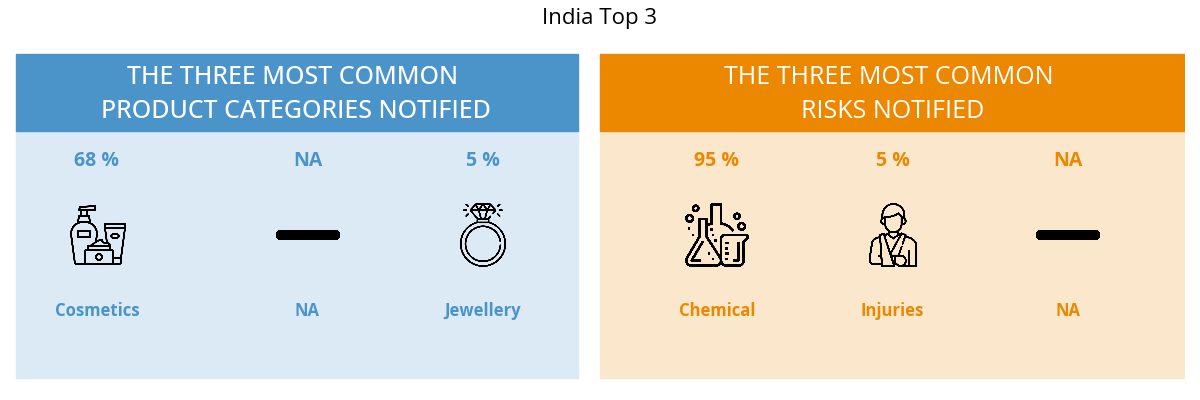 |
|
| Italy | 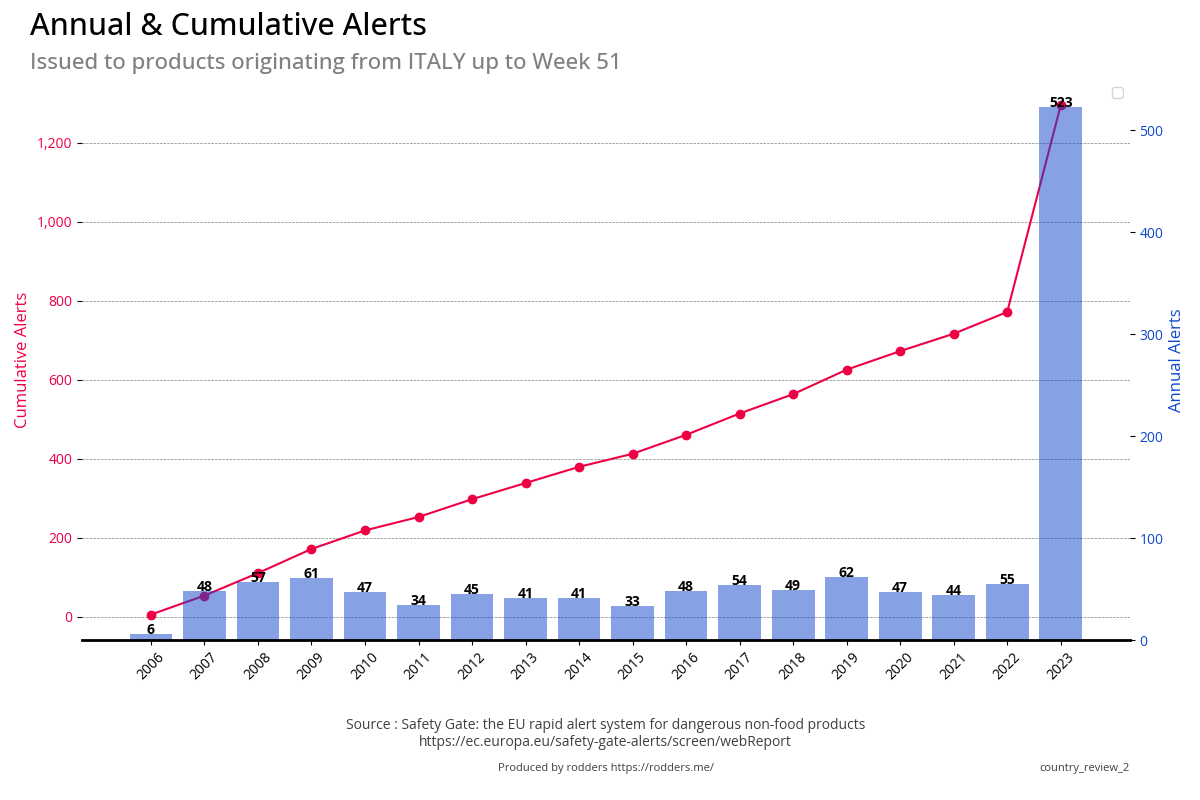 |
 |
| Italy | 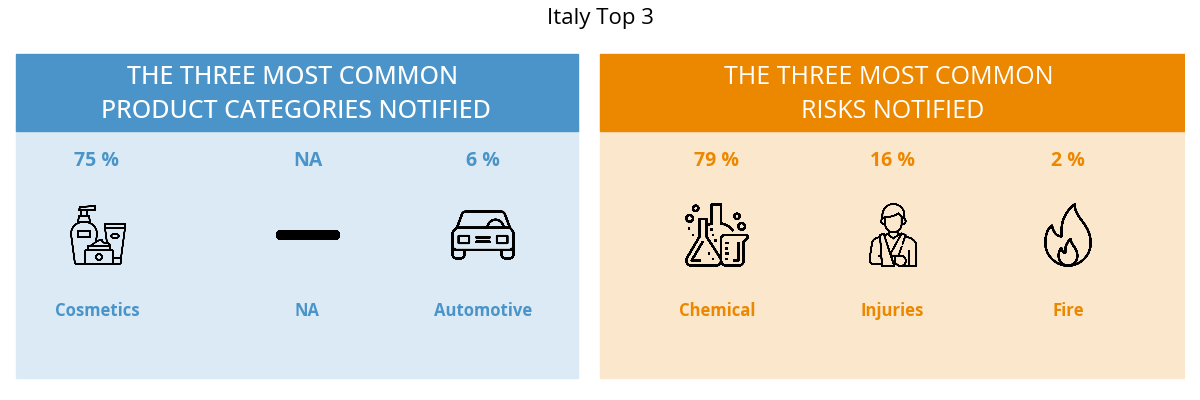 |
|
| Japan | 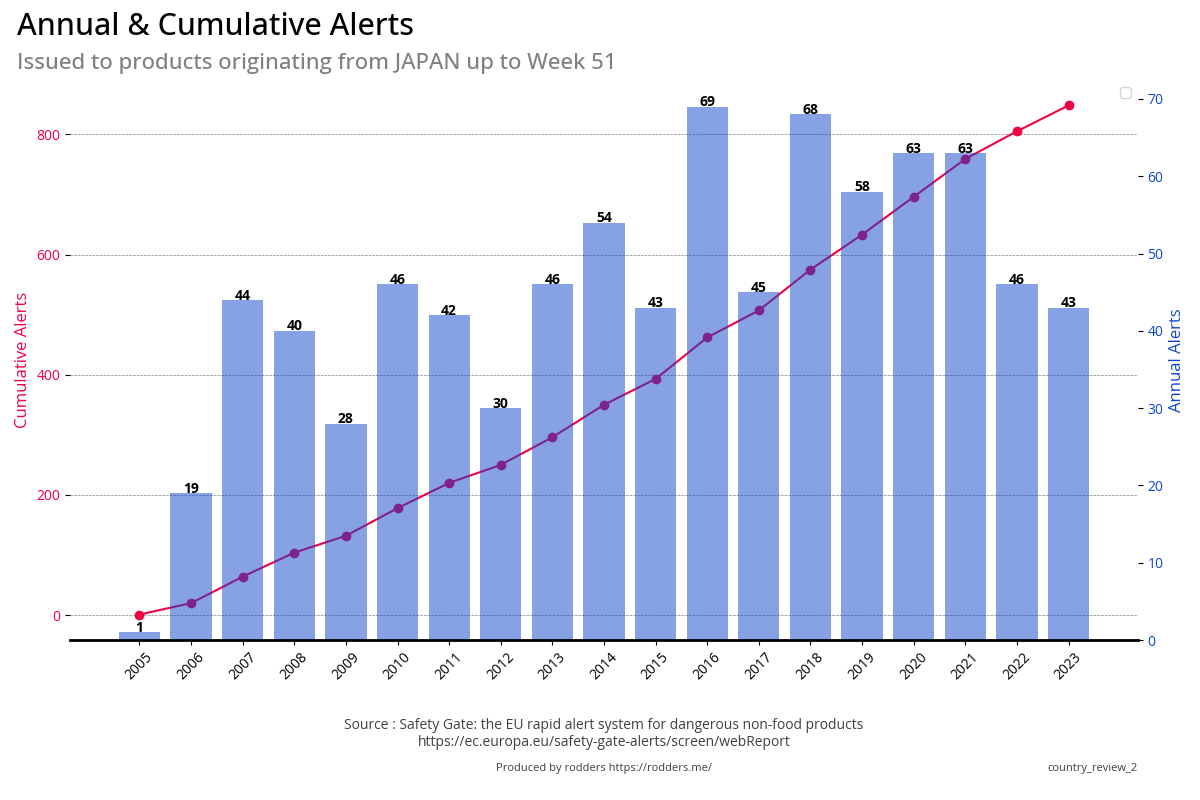 |
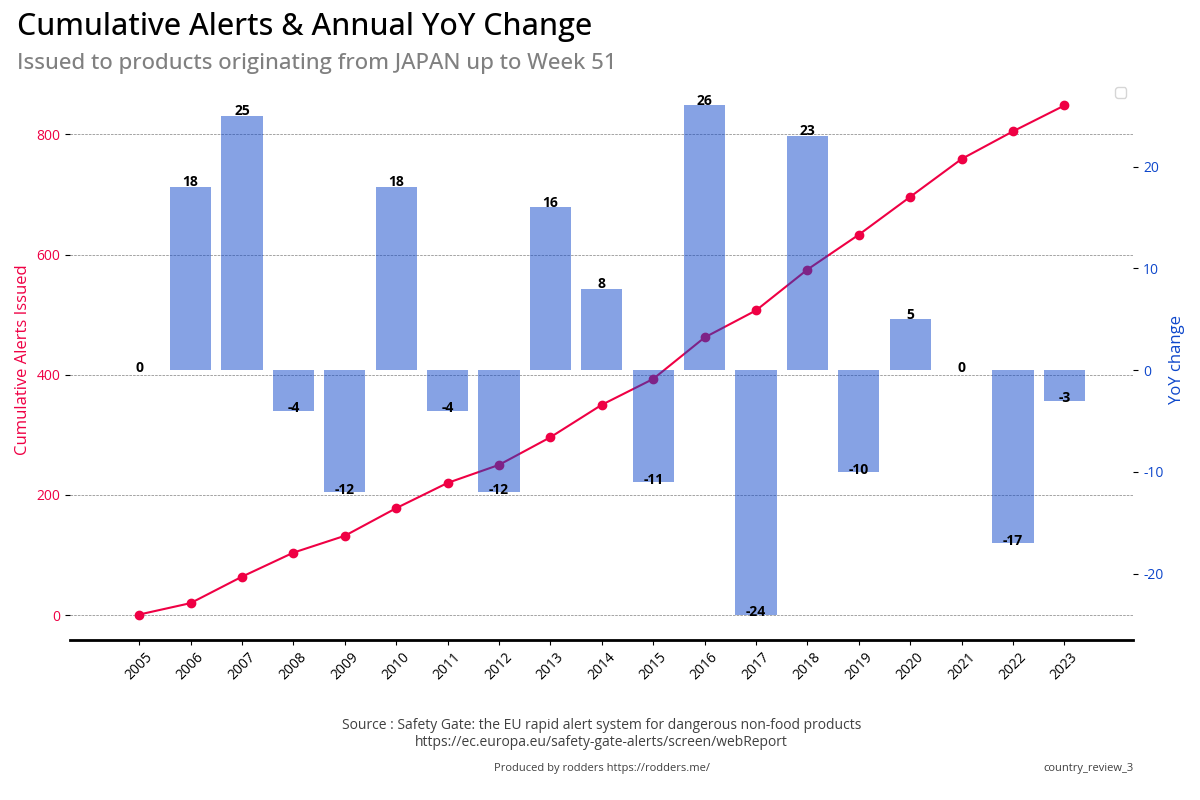 |
| Japan | 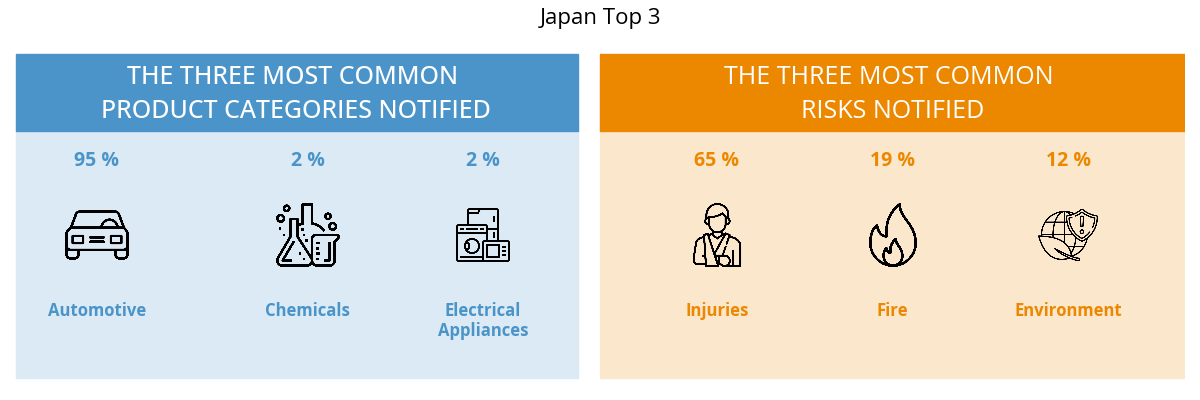 |
|
| Poland | 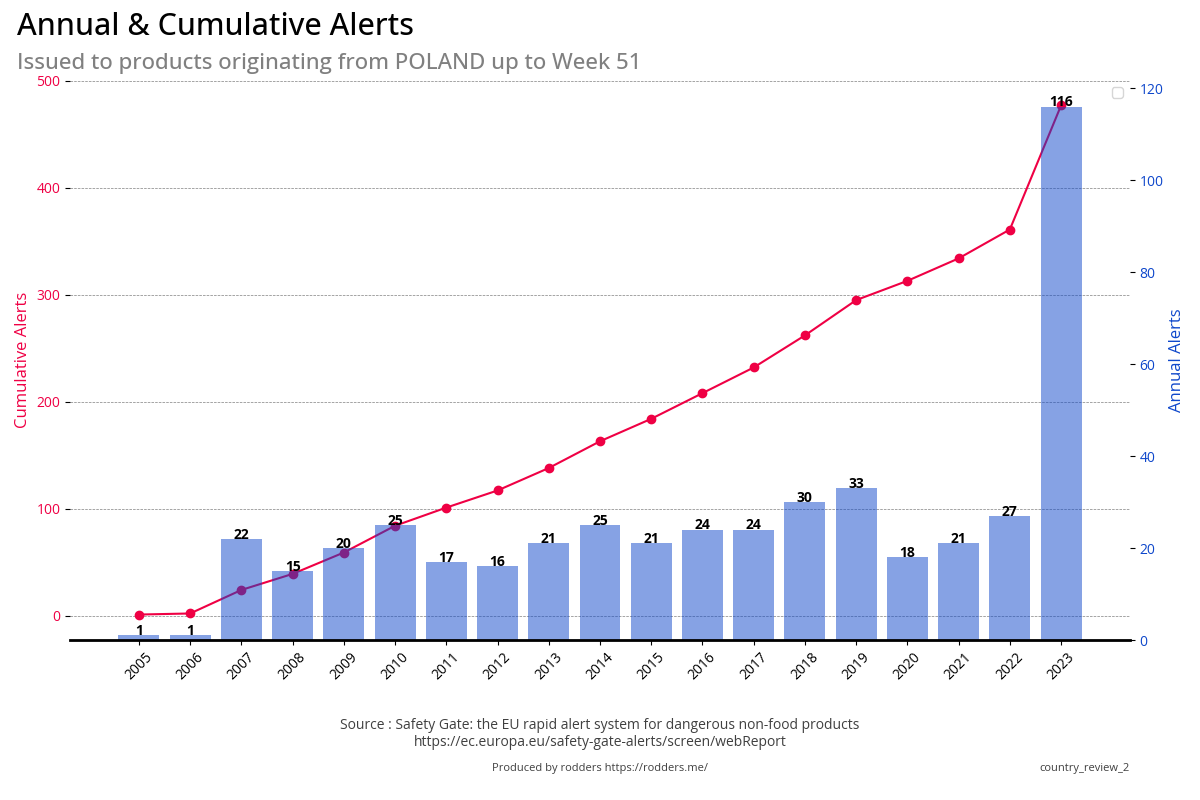 |
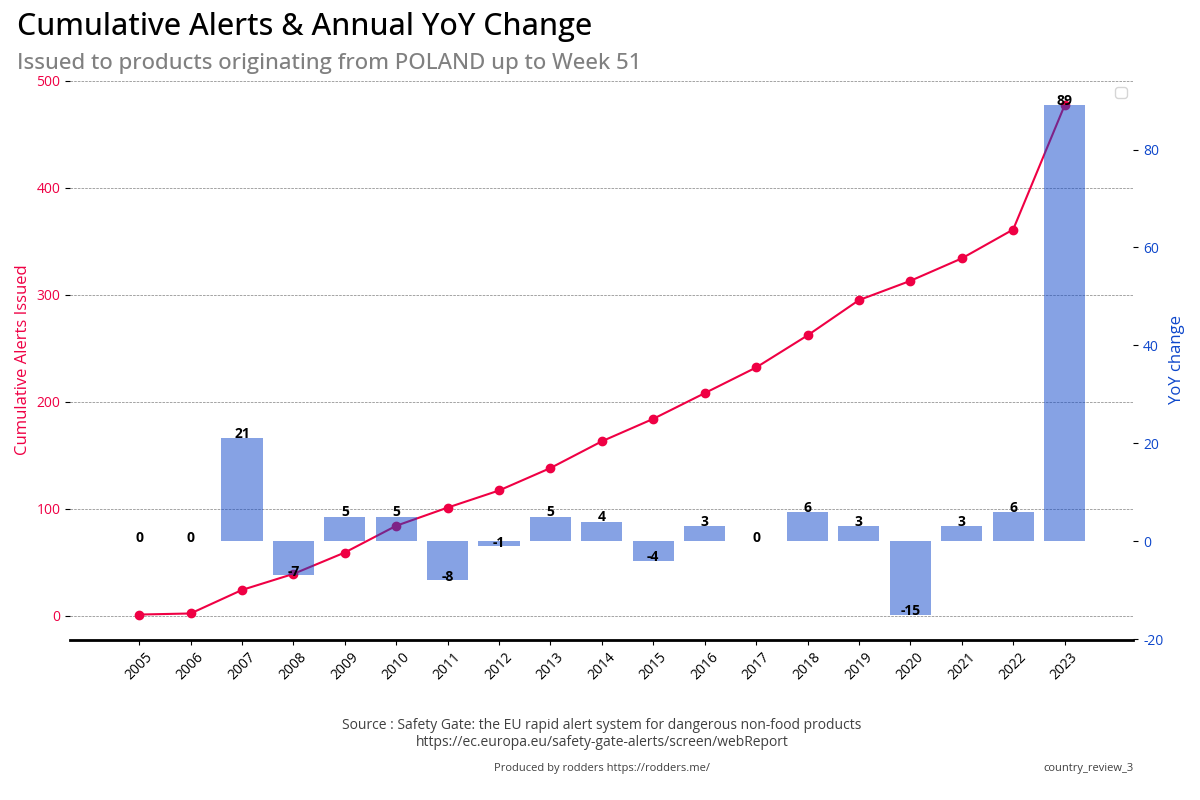 |
| Poland | 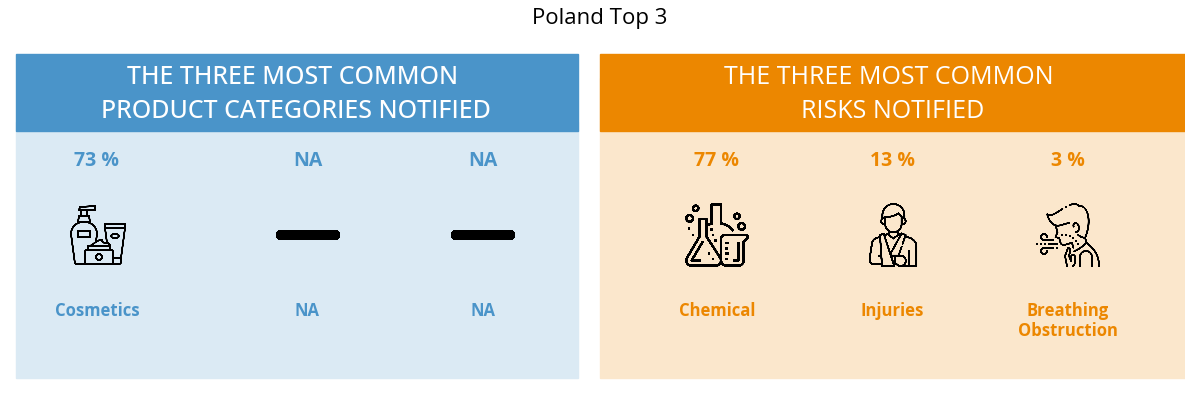 |
|
| Spain | 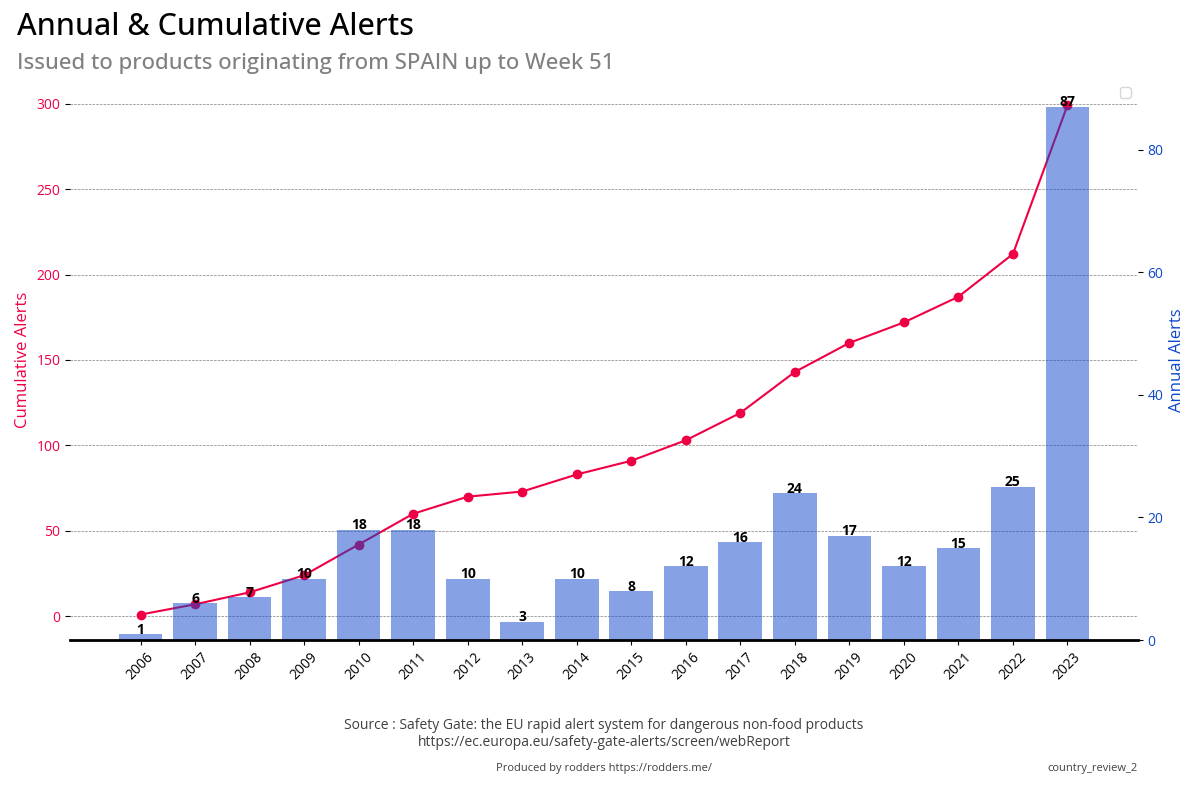 |
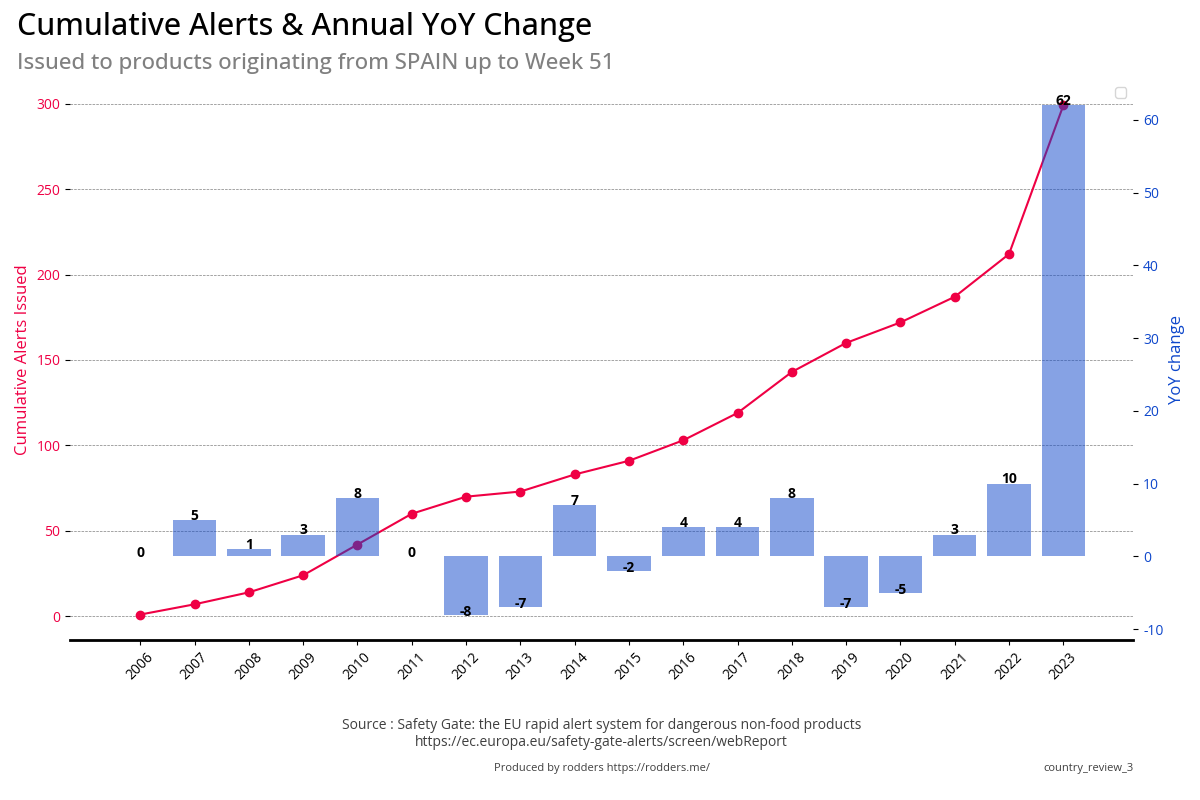 |
| Spain | 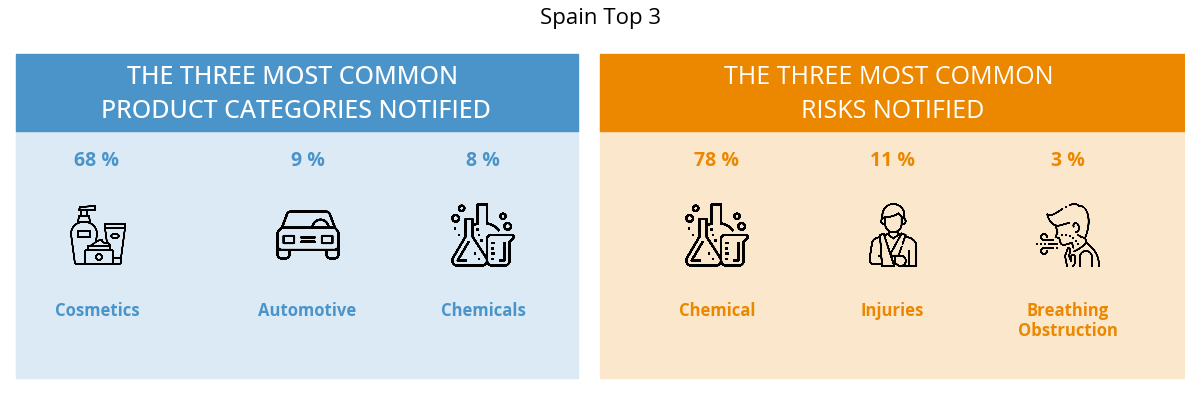 |
|
| Sweden | 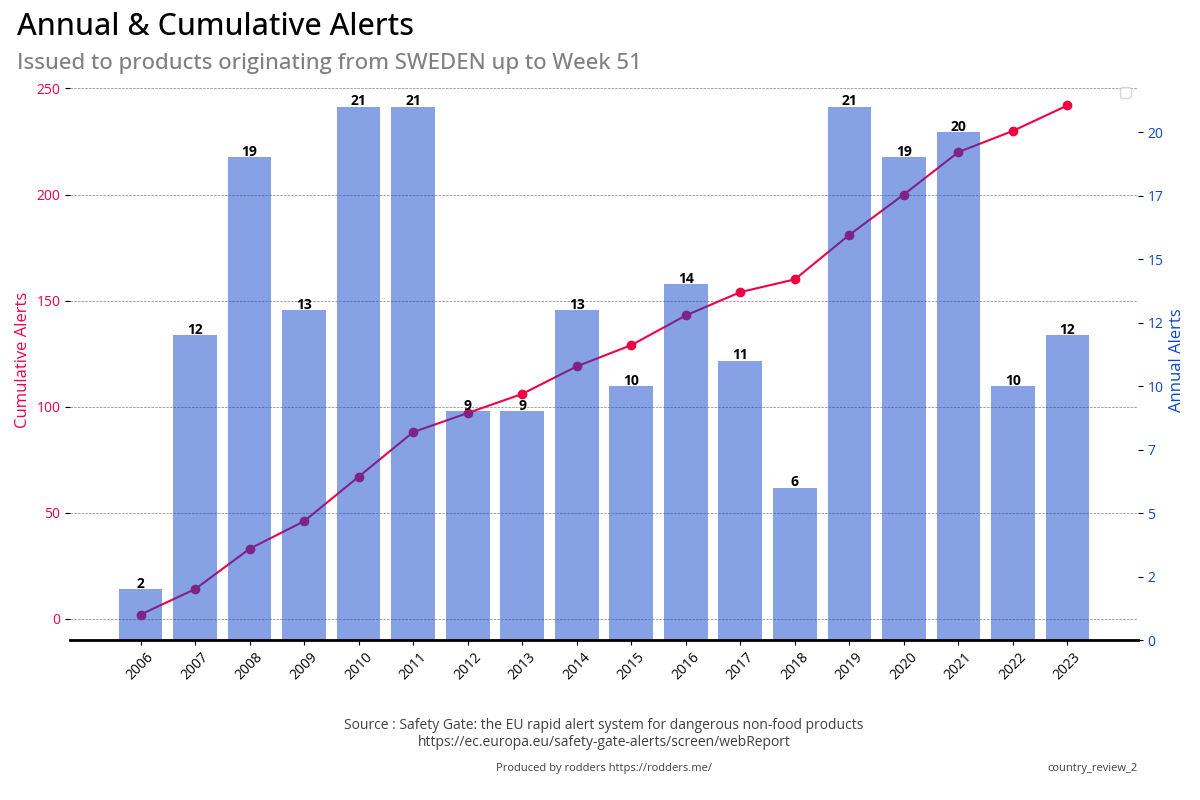 |
 |
| Sweden | 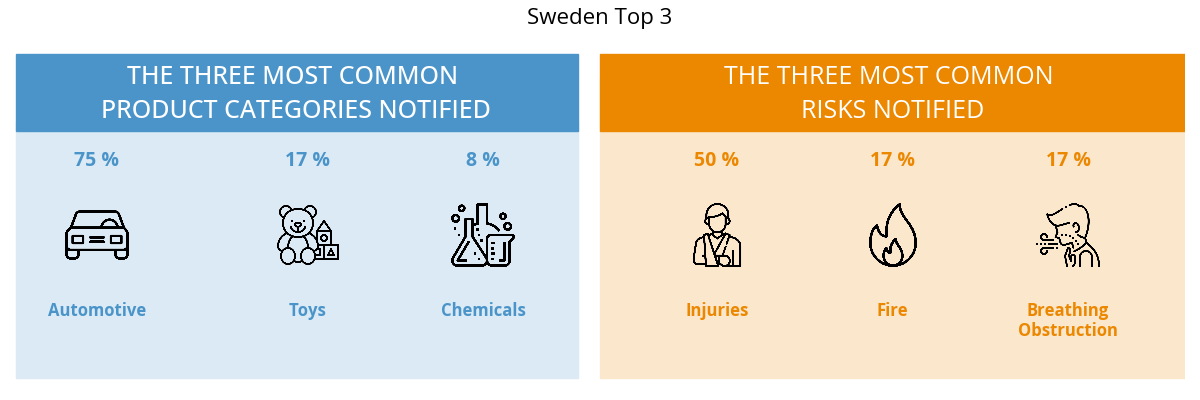 |
|
| Taiwan | 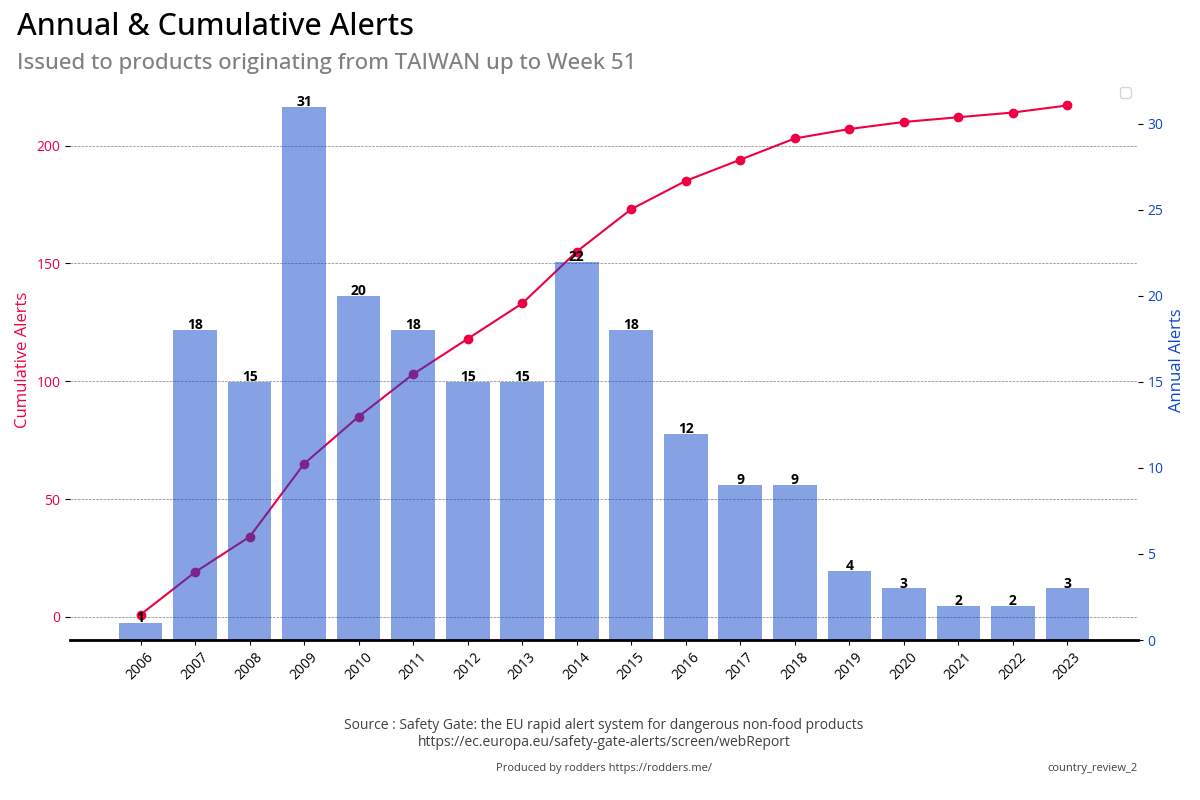 |
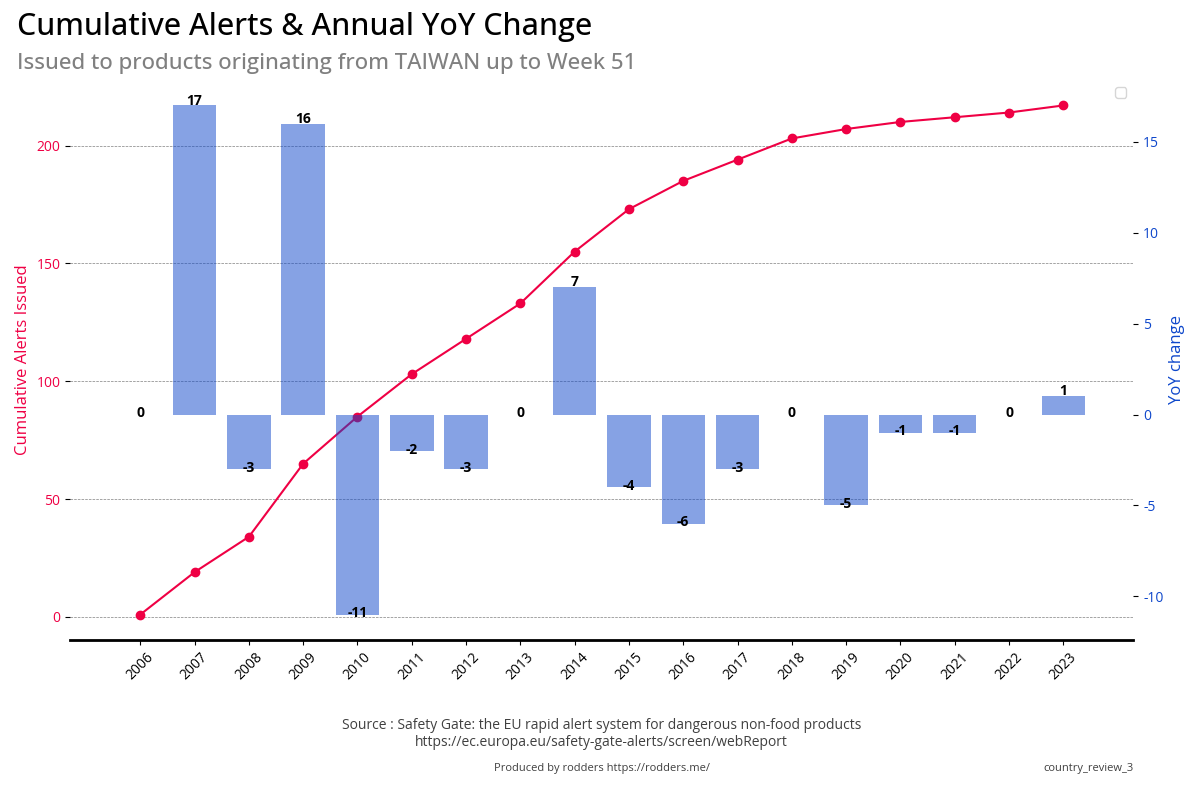 |
| Taiwan | 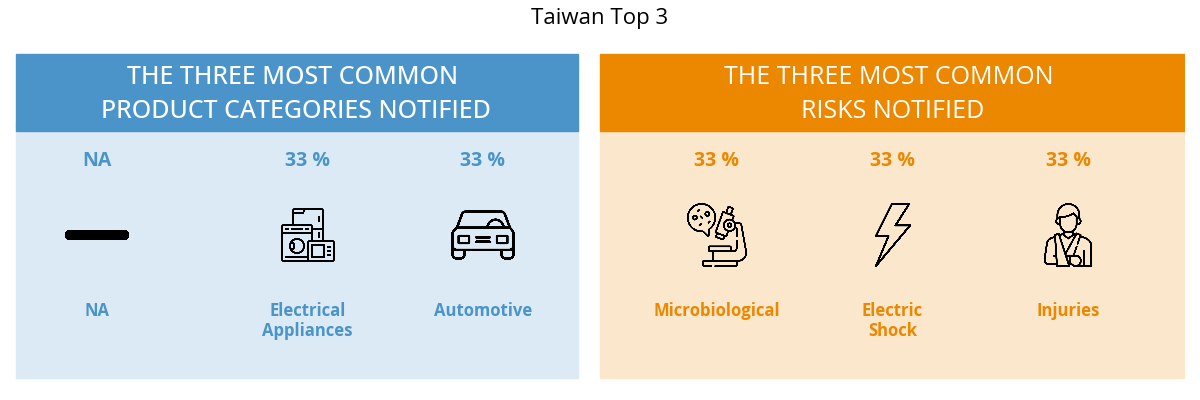 |
|
| UK | 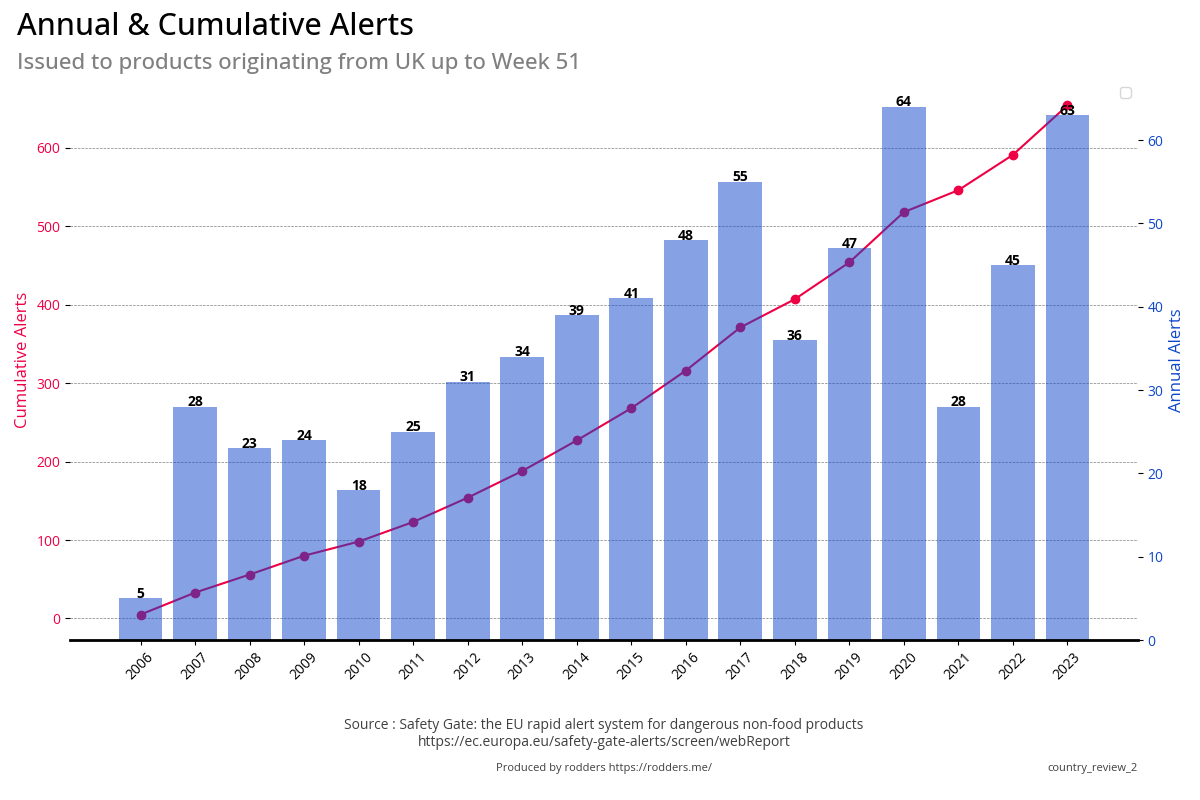 |
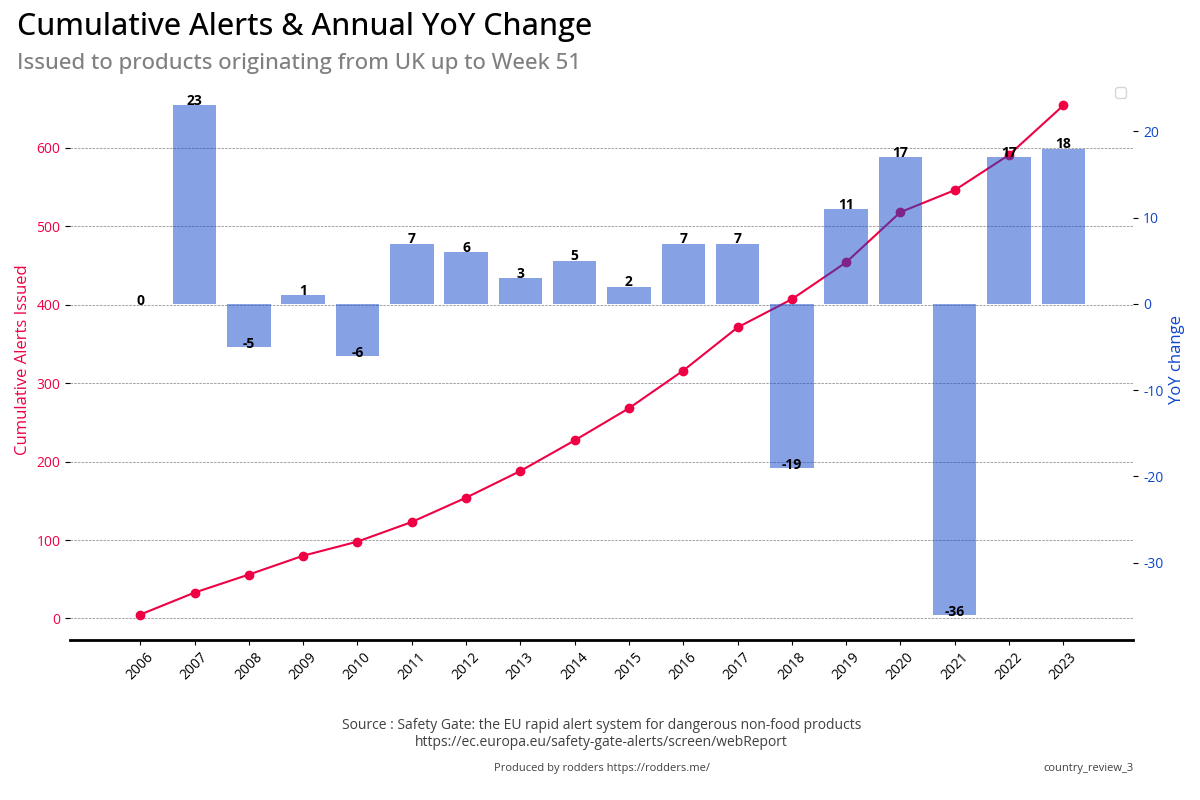 |
| UK | 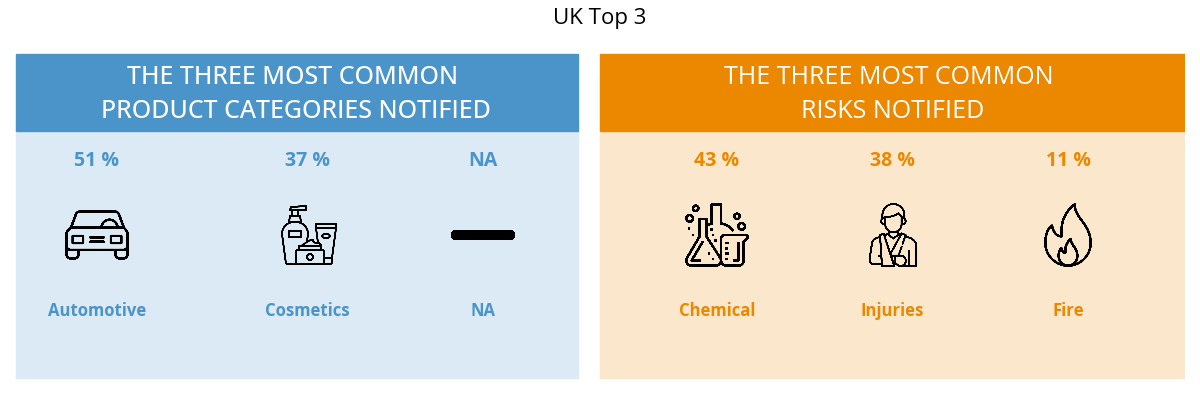 |
|
| USA | 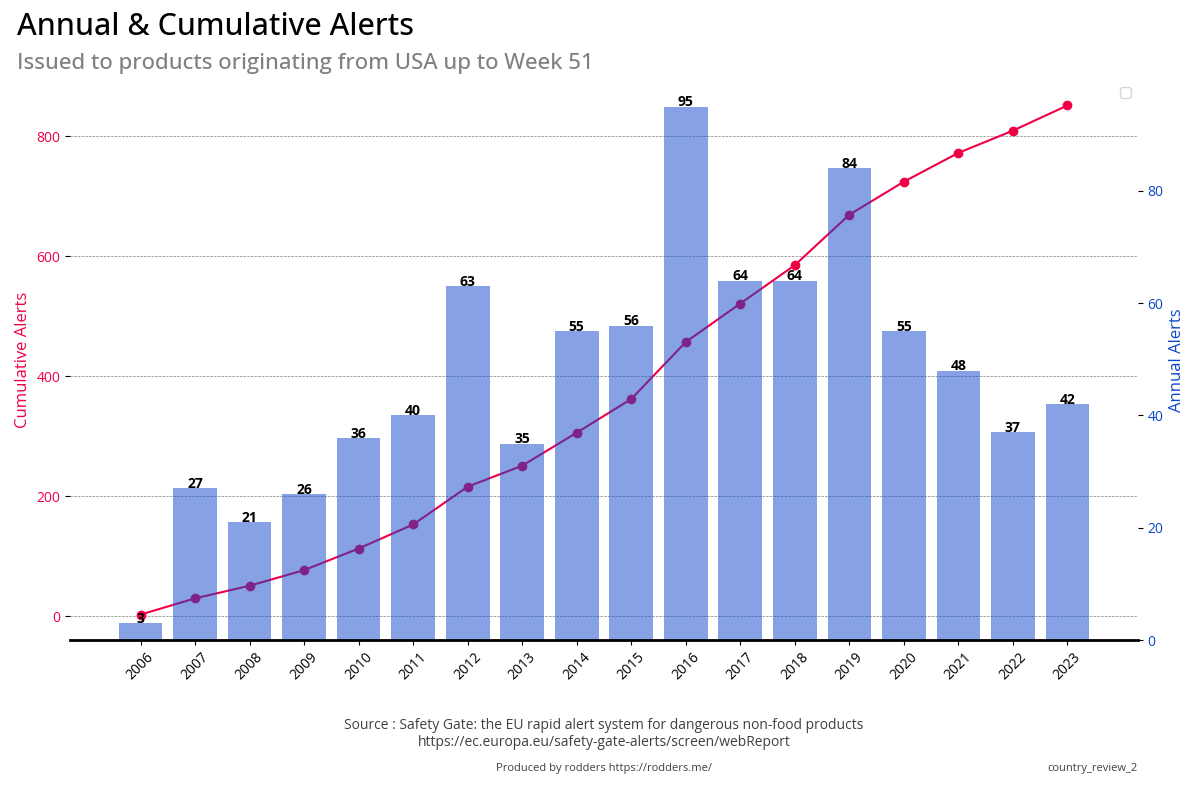 |
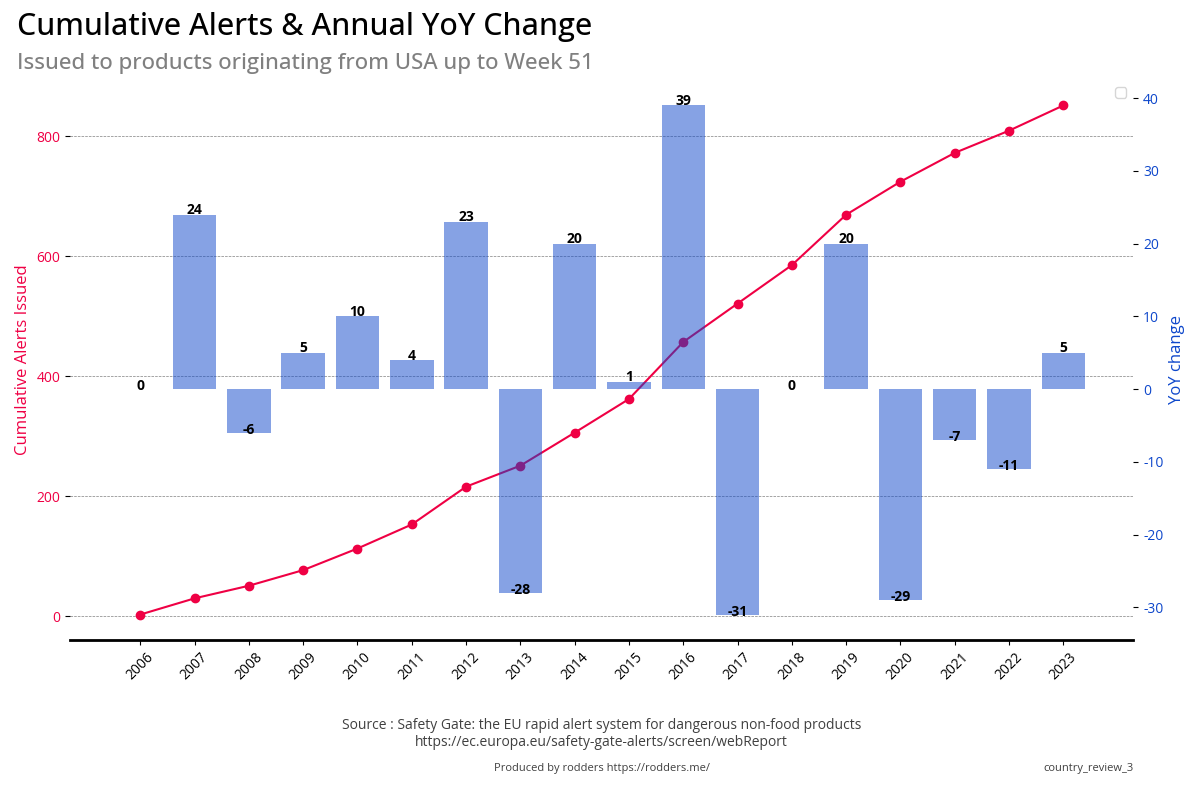 |
| USA | 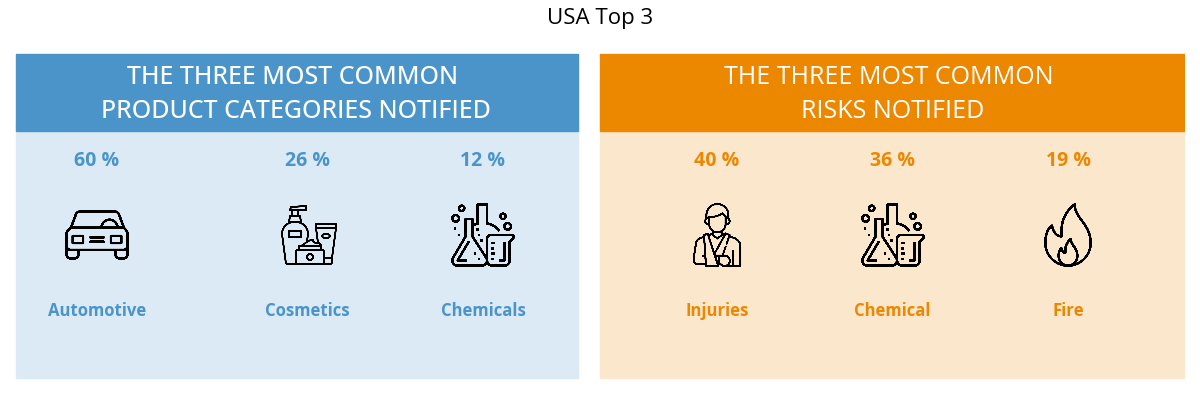 |
|
| Other | 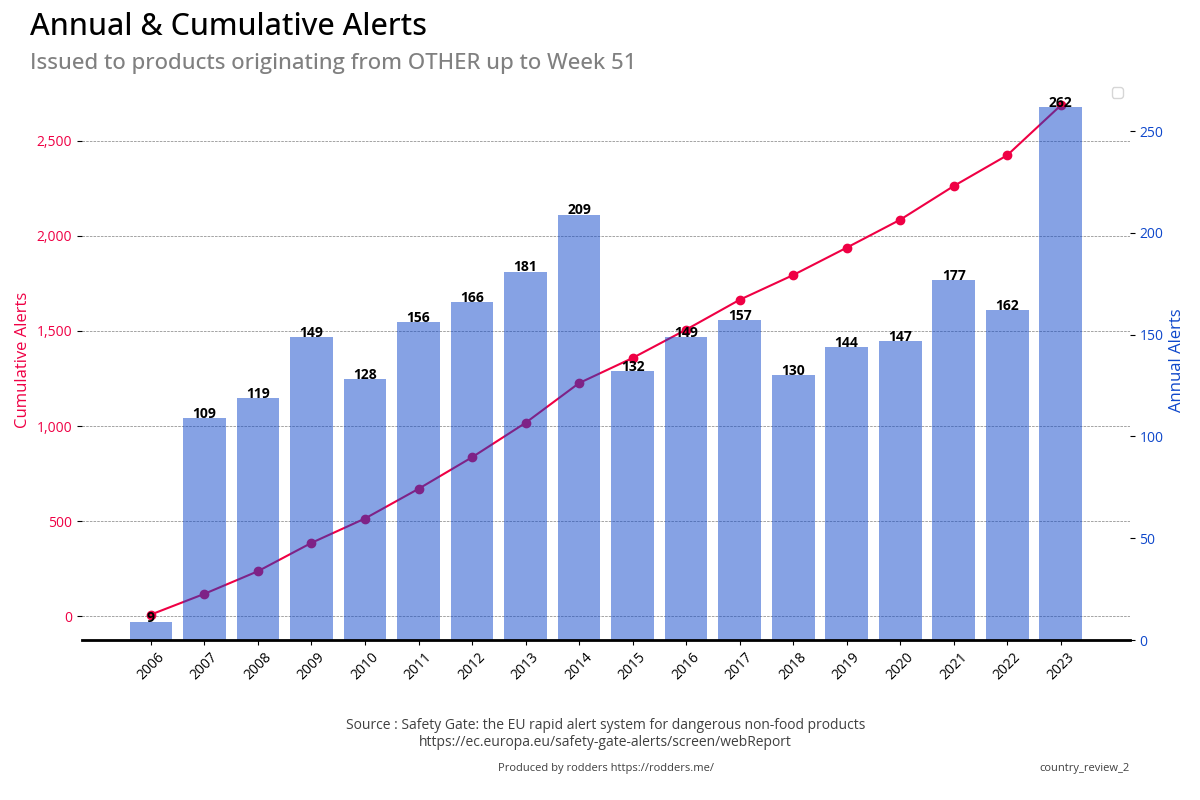 |
 |
| Other | 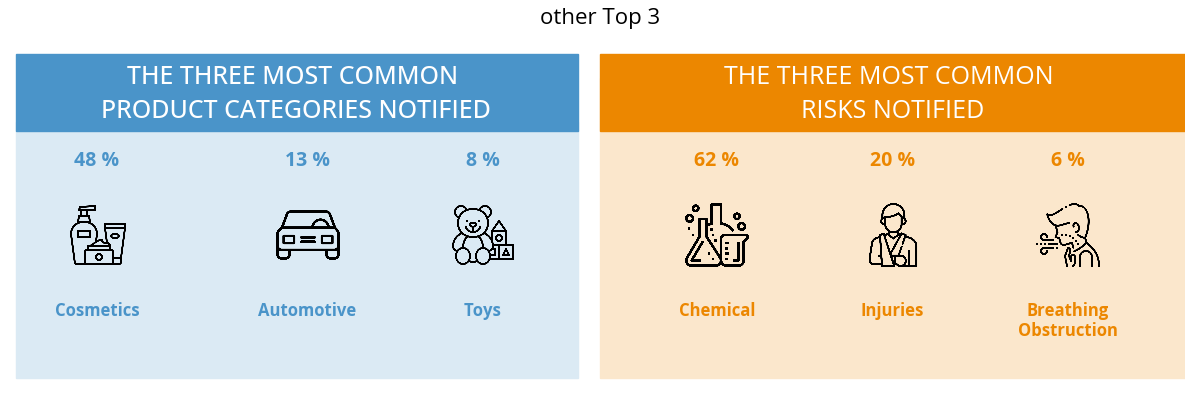 |
|
| Unknown | 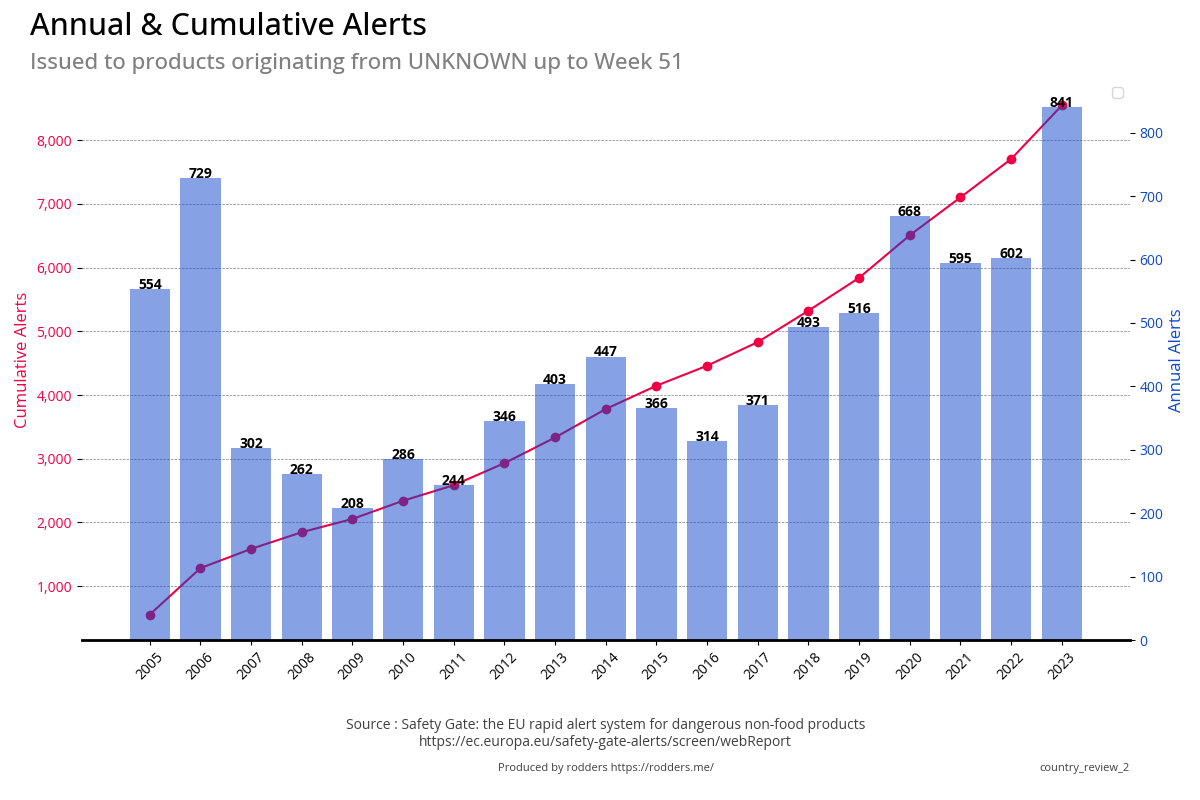 |
 |
| Unknown | 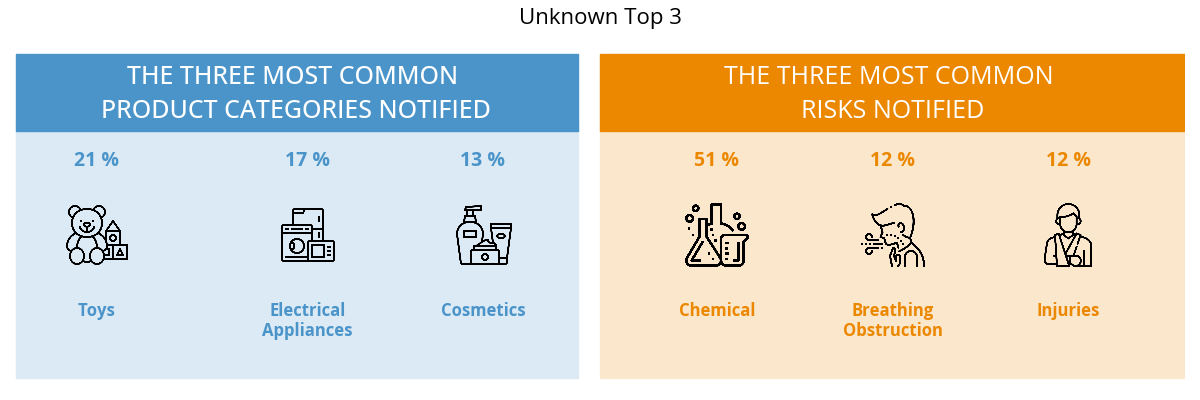 |
|
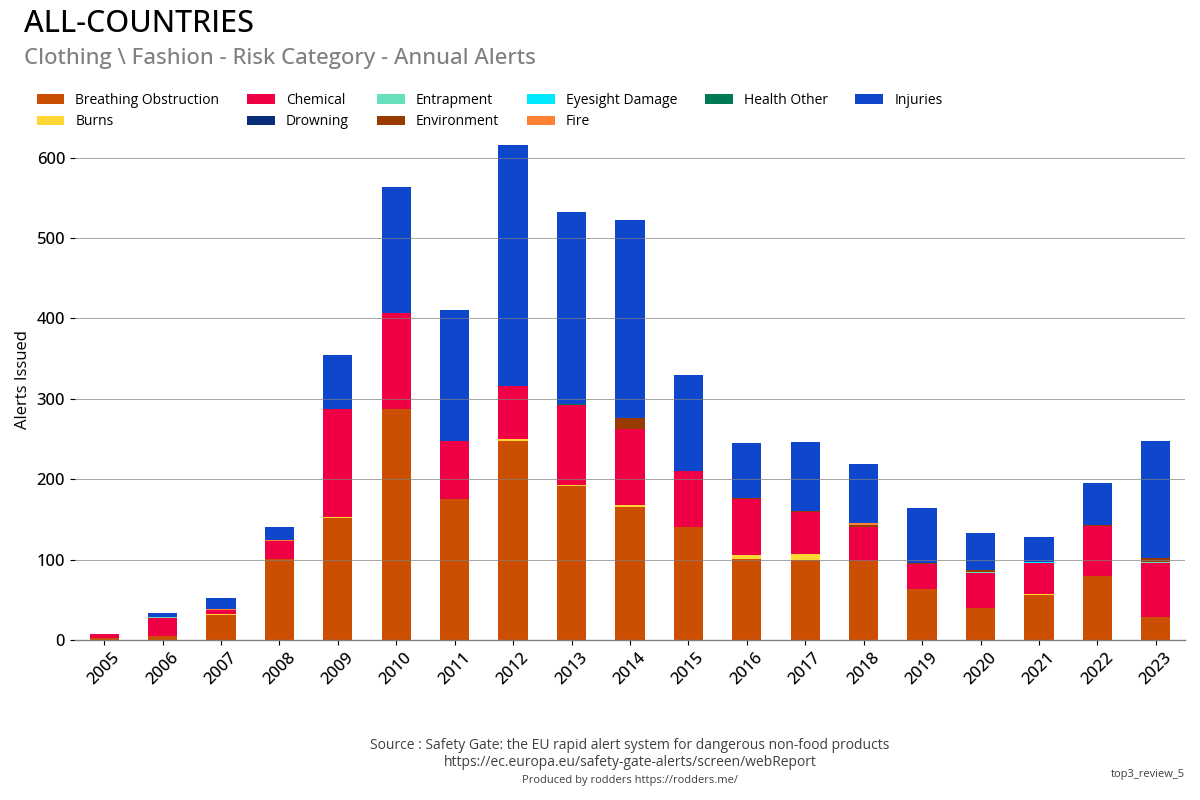
Top 3 Worldwide Product Categories
#1 - Top 3 Product Categories
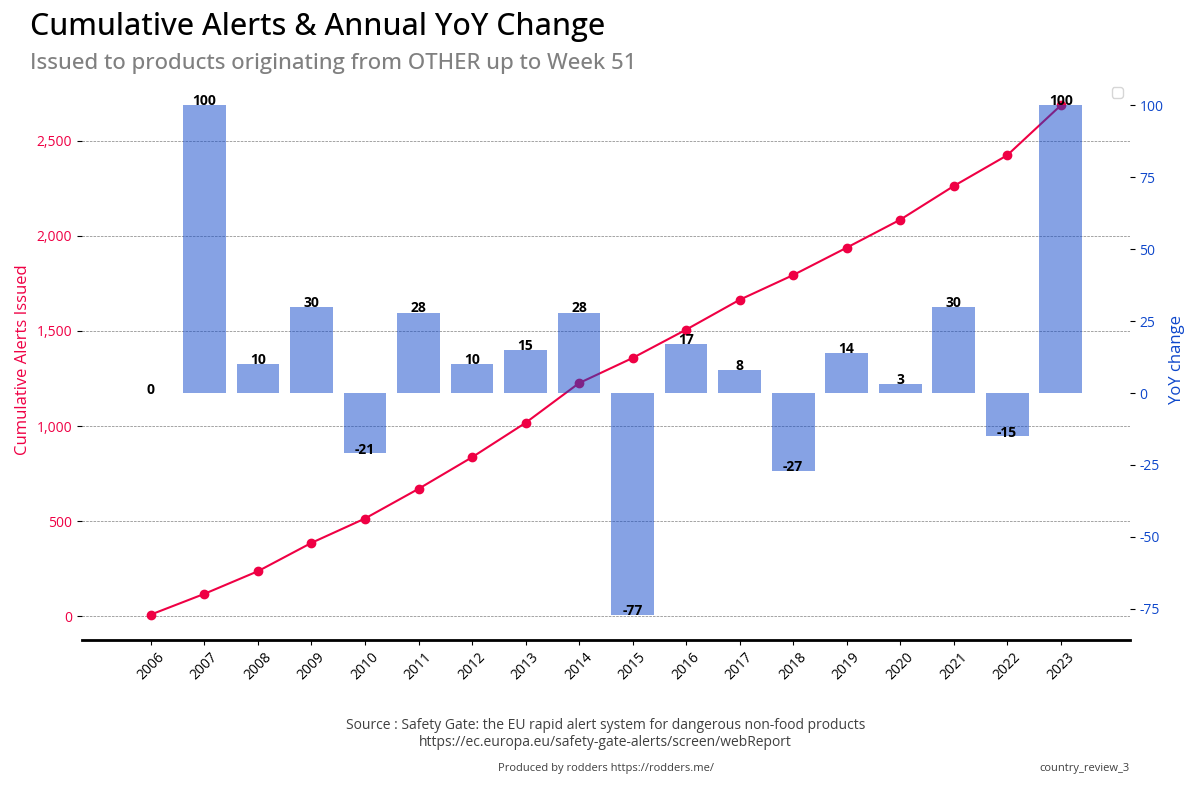
Total, Annual and Cumulative Alerts
| Annual Alerts | Cumulative Total and YoY Change |
|---|---|
|
|
#1 - Submitting Country
Previous Year Vs Current Year
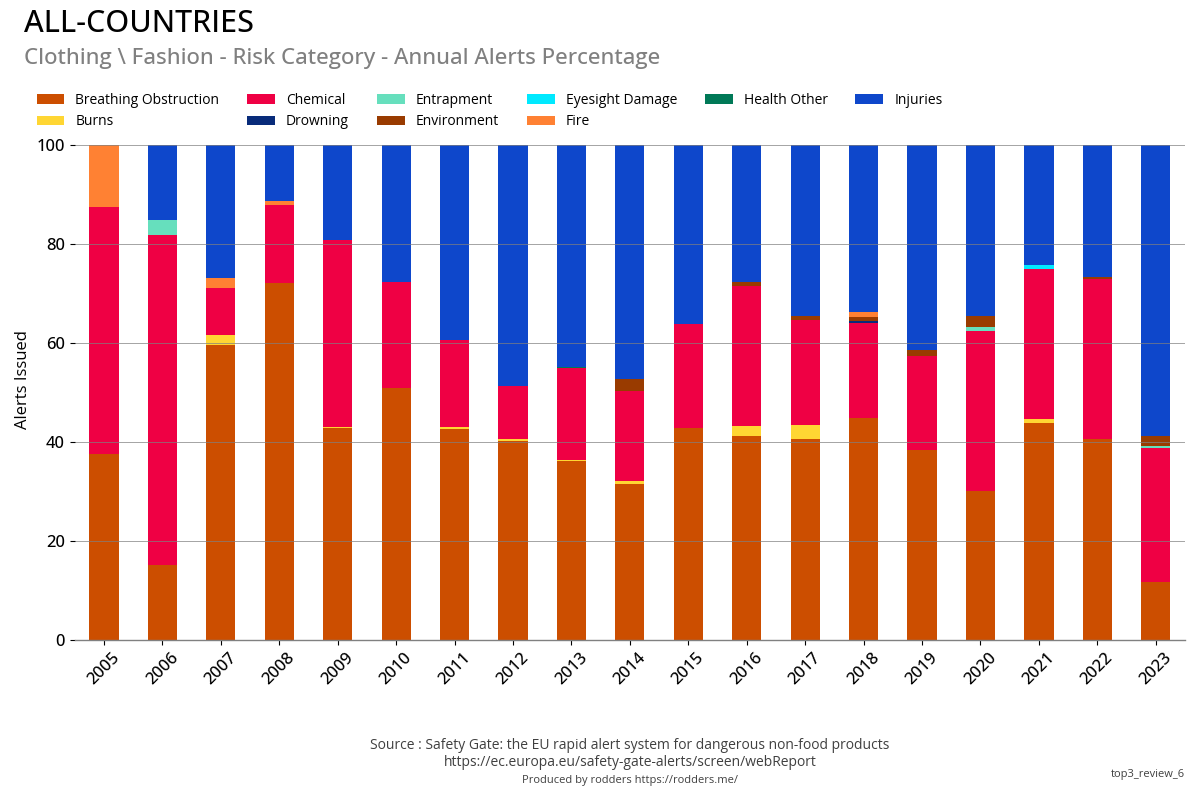
Annual Total and Annual Percentage of Total
| Annual Total | Annual % of total |
|---|---|
|
|
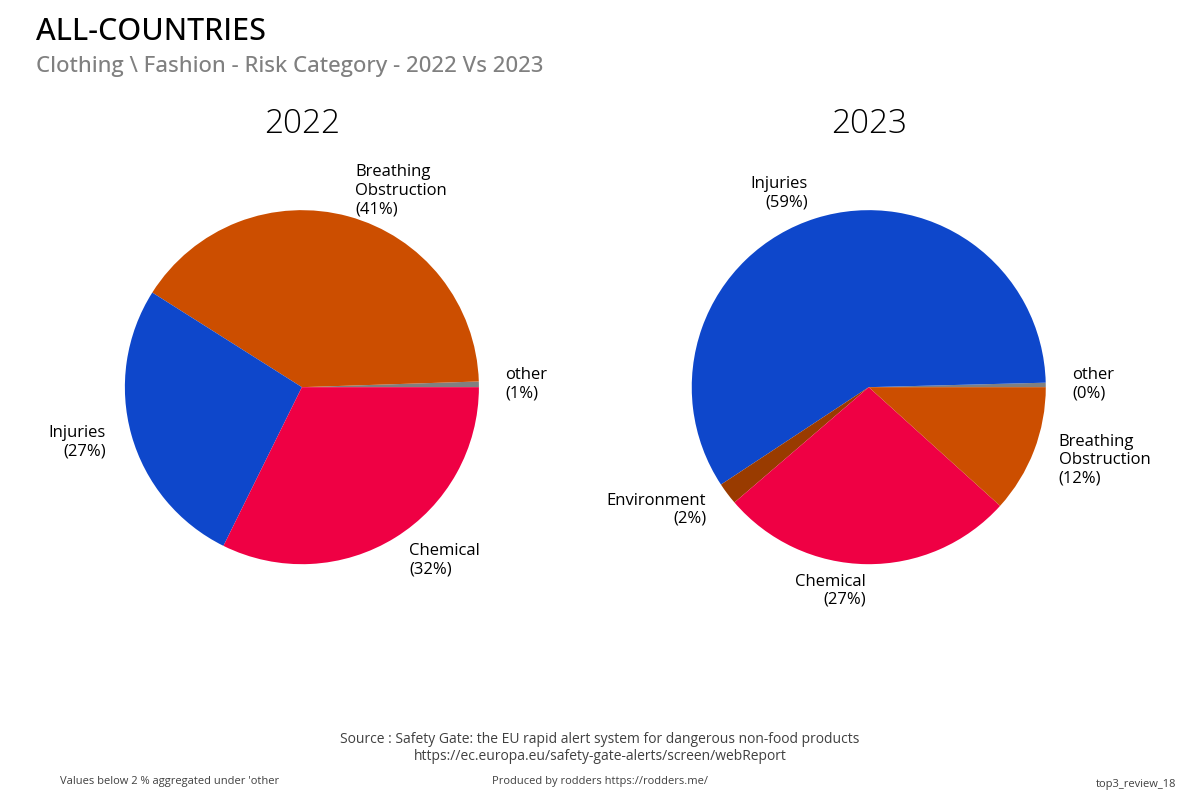
#1 - Risk Category
Previous Year Vs Current Year
Annual Total and Annual Percentage of Total
| Annual Total | Annual % of Total |
|---|---|
|
|
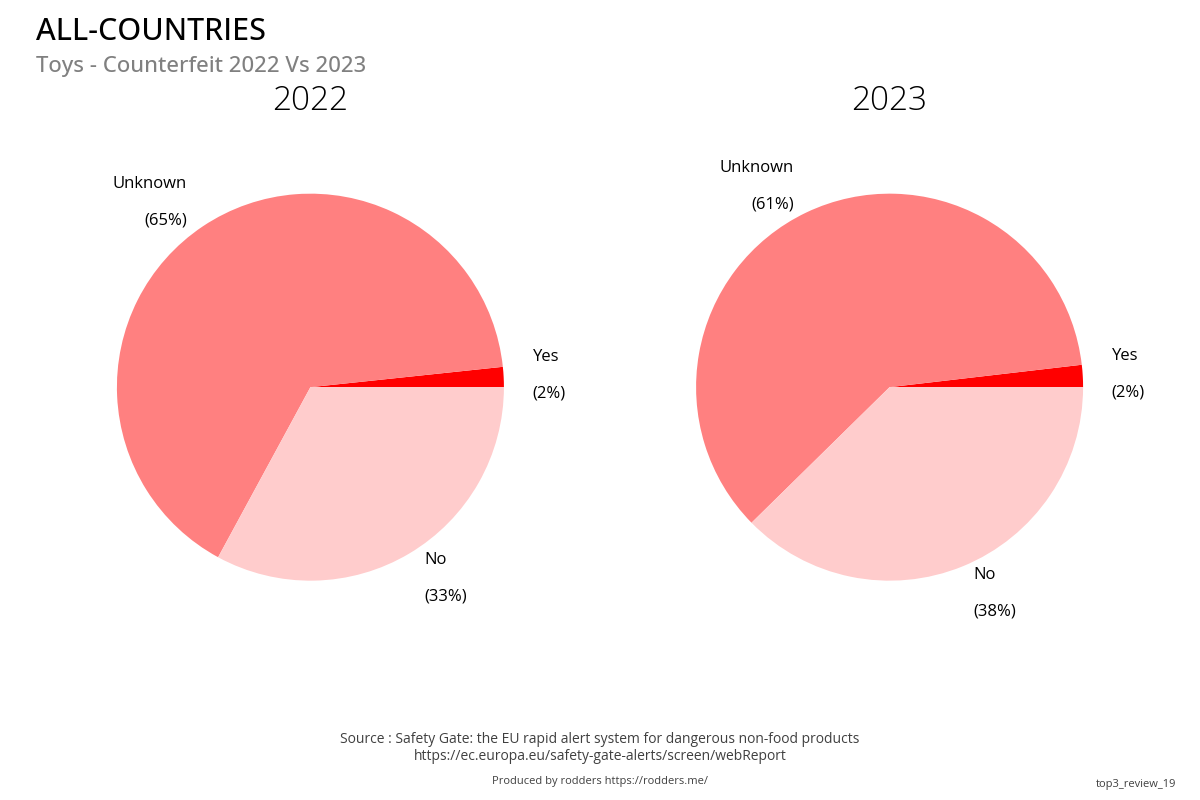
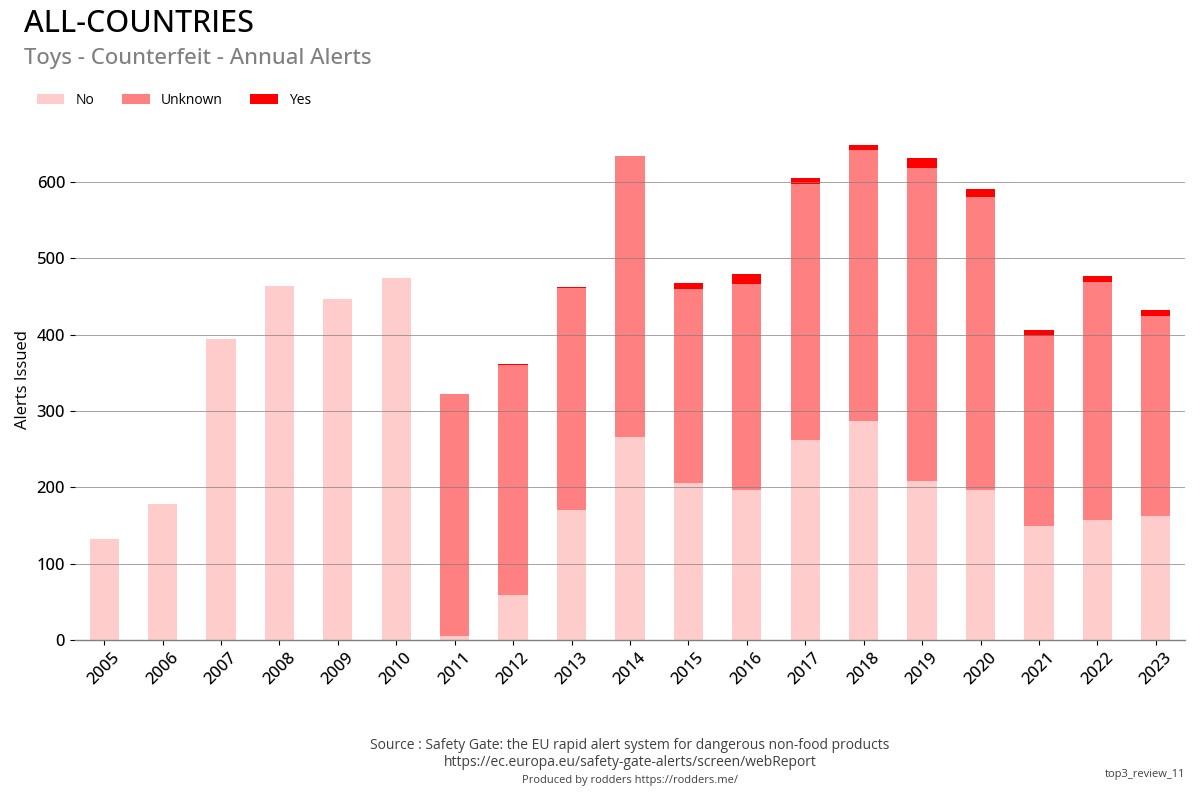
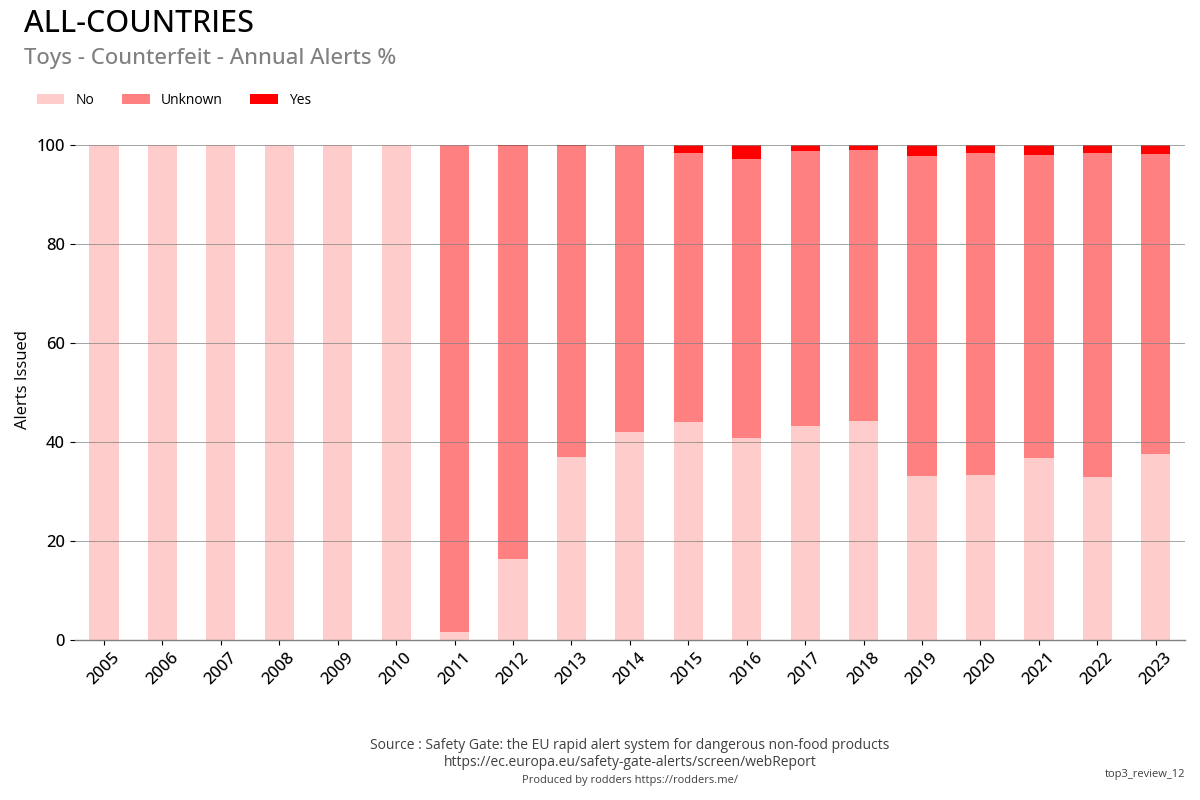
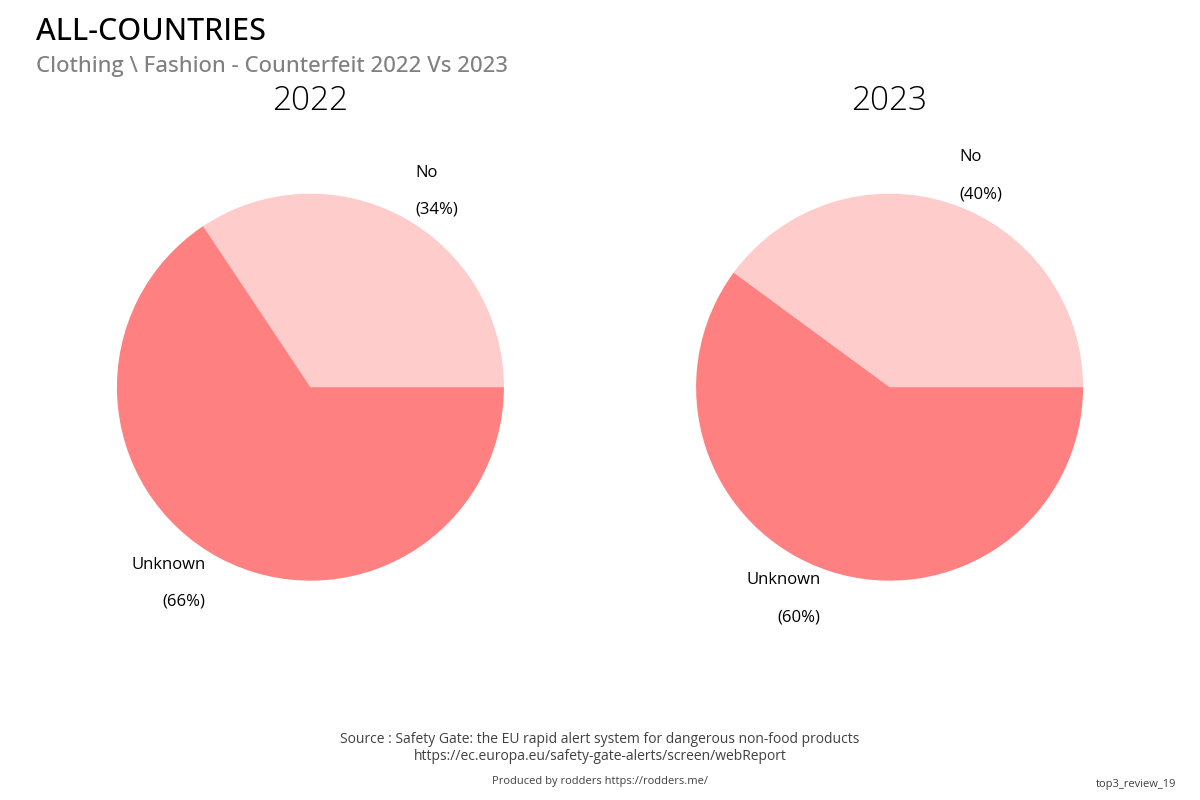
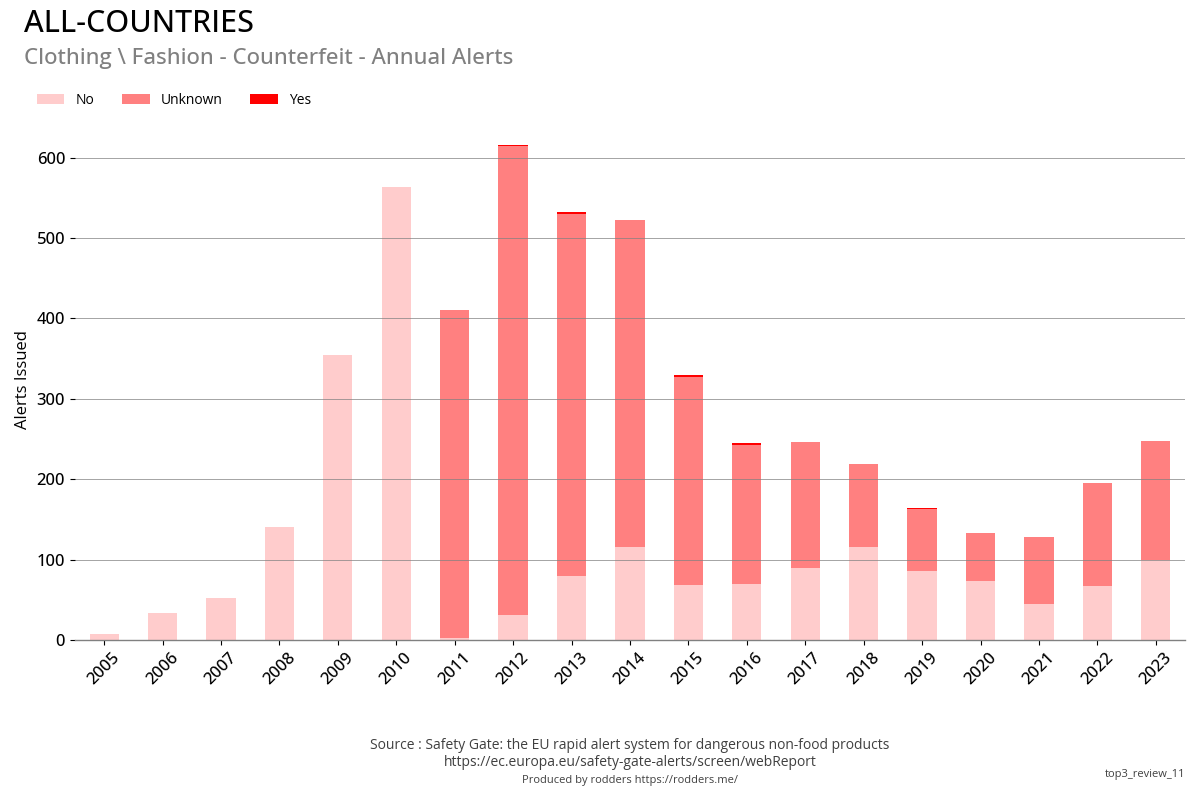
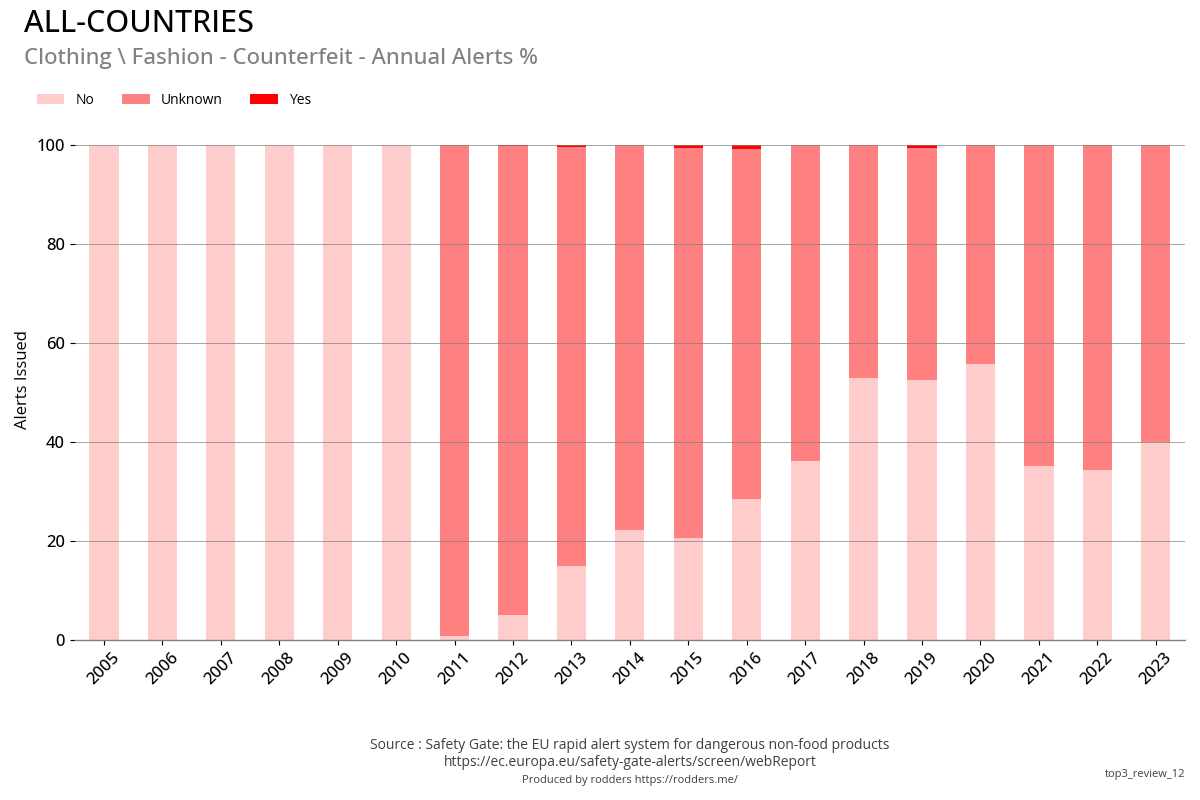
#1 - Counterfeit
Previous Year Vs Current Year
Annual Total and Annual Percentage of Total
| Annual Total | Annual % of Total |
|---|---|
|
|
Compulsory / Voluntary Action Required /Responsible Party
#1 - Compulsory / Voluntary Action Required
Previous Year Vs Current Year
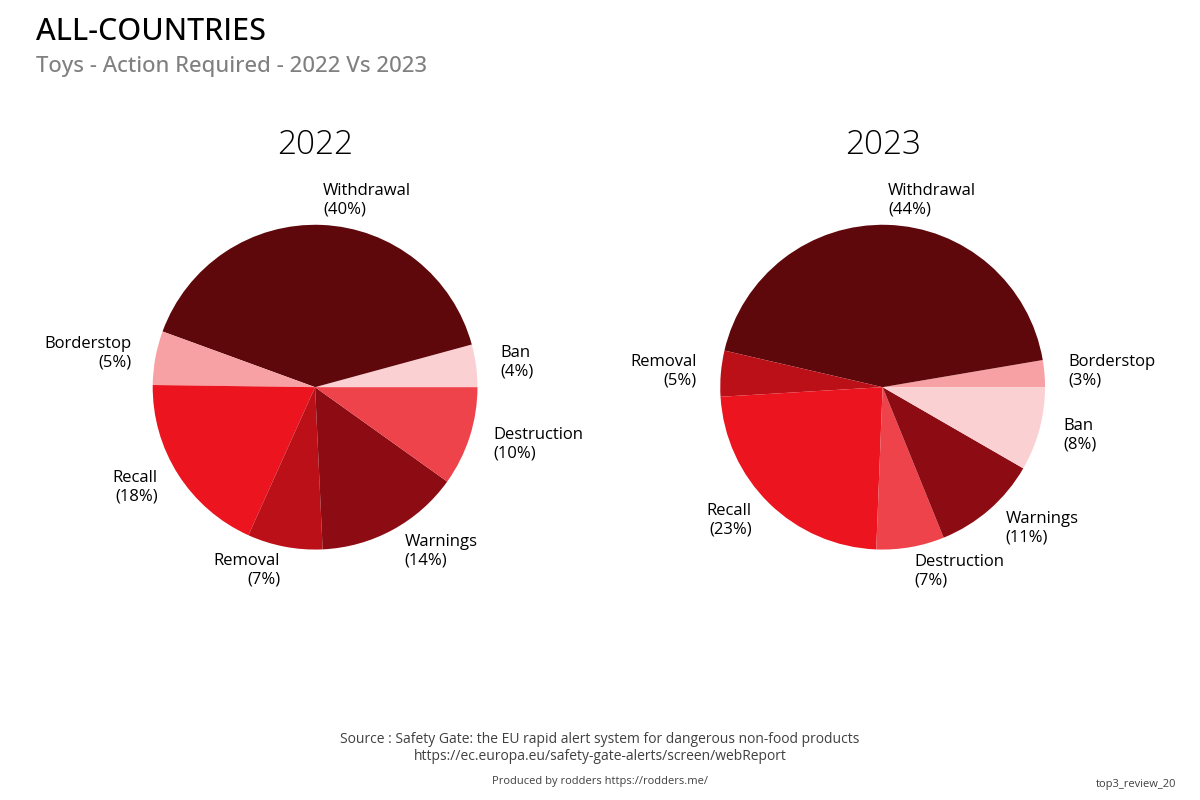
Annual Total / Compulsory Vs Voluntary
| Annual Total | Compulsory Vs Voluntary |
|---|---|
|
|
#1 - Compulsory / Voluntary Responsible Party
Previous Year Vs Current Year
Annual Total / Compulsory Vs Voluntary
| Annual Total | Compulsory Vs Voluntary |
|---|---|
|
|
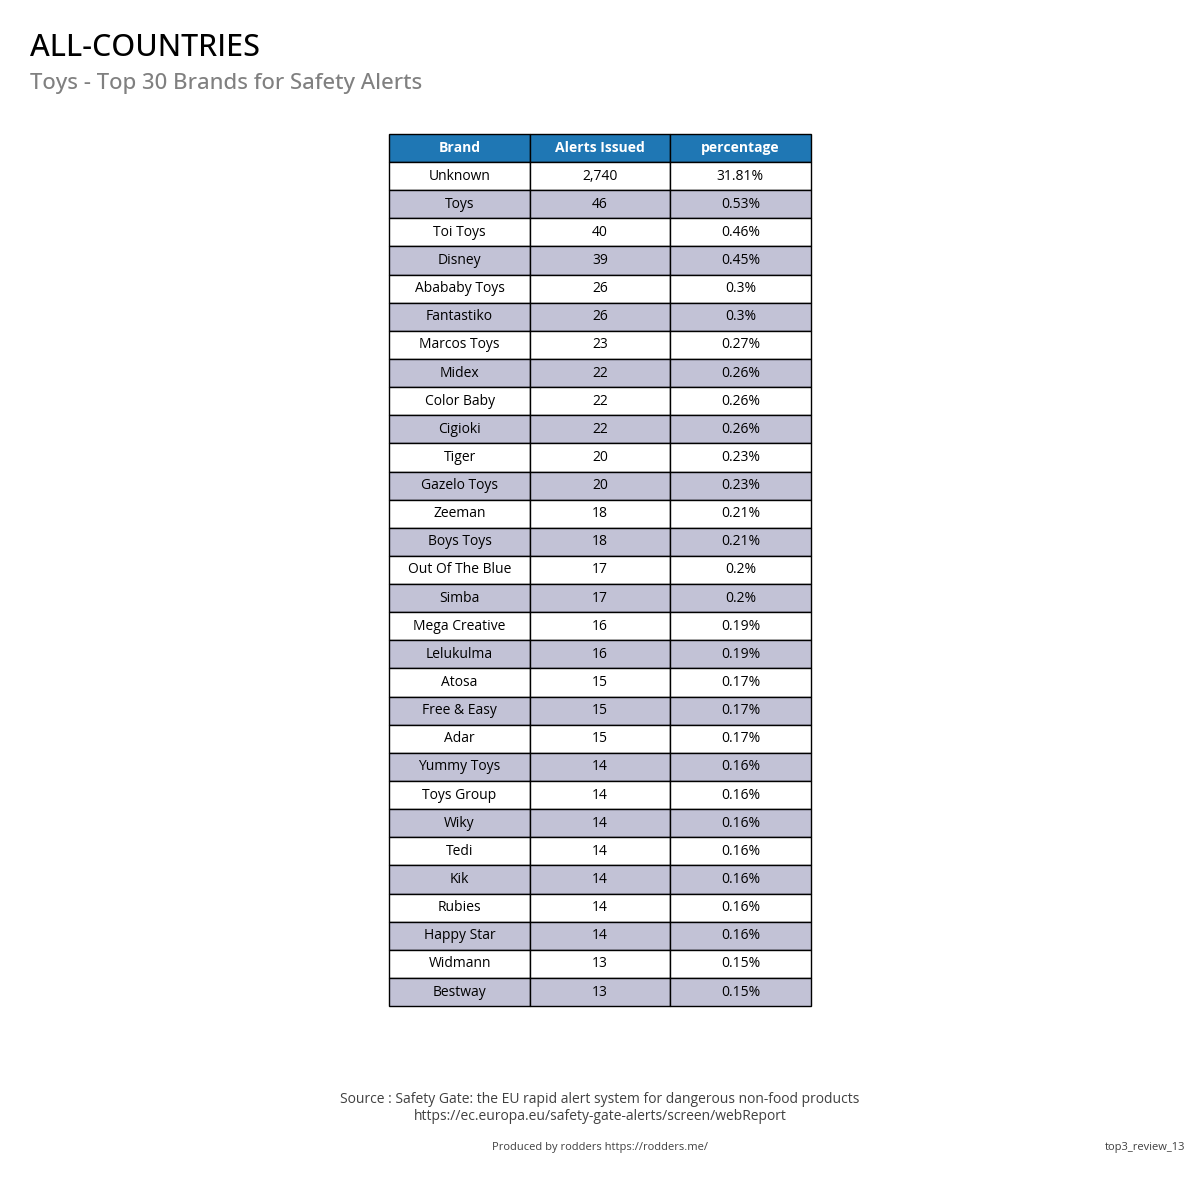
#1 - Top 30 Brands for Safety Alerts
| Top 30 Brands |
|---|
|
#2 - Top 3 Product Categories
#2 - Total, Annual and Cumulative Alerts
| Annual Alerts | Cumulative Total and YoY Change |
|---|---|
|
|
Previous Year Vs Current Year
#2 - Submitting Country
| Annual Total | Cumulative Total and YoY Change |
|---|---|
|
|
#2 - Risk Category
Previous Year Vs Current Year
Annual Total / Annual Percentage of Total
| Annual Total | Cumulative Total and YoY Change |
|---|---|
|
|
#2 - Counterfeit
Previous Year Vs Current Year
Annual Total and Annual Percentage of Total
| Annual Total | Cumulative Total and YoY Change |
|---|---|
|
|
#2 - Compulsory / Voluntary Action Required
Previous Year Vs Current Year
Annual Total / Compulsory Vs Voluntary Total
| Annual Total | Compulsory Vs Voluntary Total |
|---|---|
|
|
#2 - Compulsory / Voluntary Responsible Party
Previous Year Vs Current Year
Annual Total / Compulsory Vs Voluntary Total
| Annual Total | Compulsory Vs Voluntary Total |
|---|---|
|
|
Top Brands for Safety Alerts
| #2 - Top 30 Brands |
|---|
 |
#3 - Top 3 Product Categories
#3 - Total, Annual and Cumulative Alerts
| Annual Alerts | Cumulative Total and YoY Change |
|---|---|
|
|
#3 - Submitting Country
Previous Year Vs Current Year
Annual Total and Annual Percentage of Total
| Annual Total | Cumulative Total and YoY Change |
|---|---|
|
|
#3 - Risk Category
Previous Year Vs Current Year
Annual Total and Annual Percentage of Total
| Annual Total | Annual Percentage of Total |
|---|---|
|
|
#3 - Counterfeit
Previous Year Vs Current Year
Annual Total and Annual Percentage of Total
| Annual Total | Annual Percentage of Total |
|---|---|
|
|
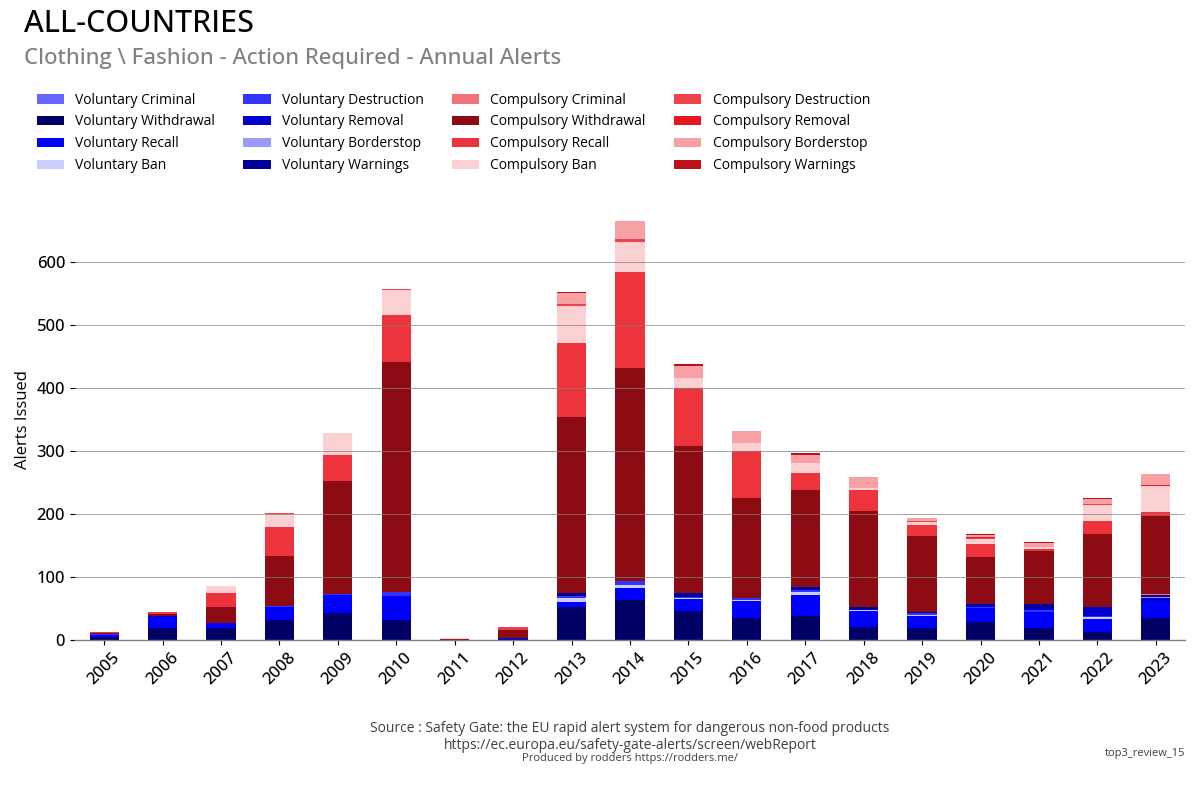
#3 - Compulsory / Voluntary Action Required
Previous Year Vs Current Year
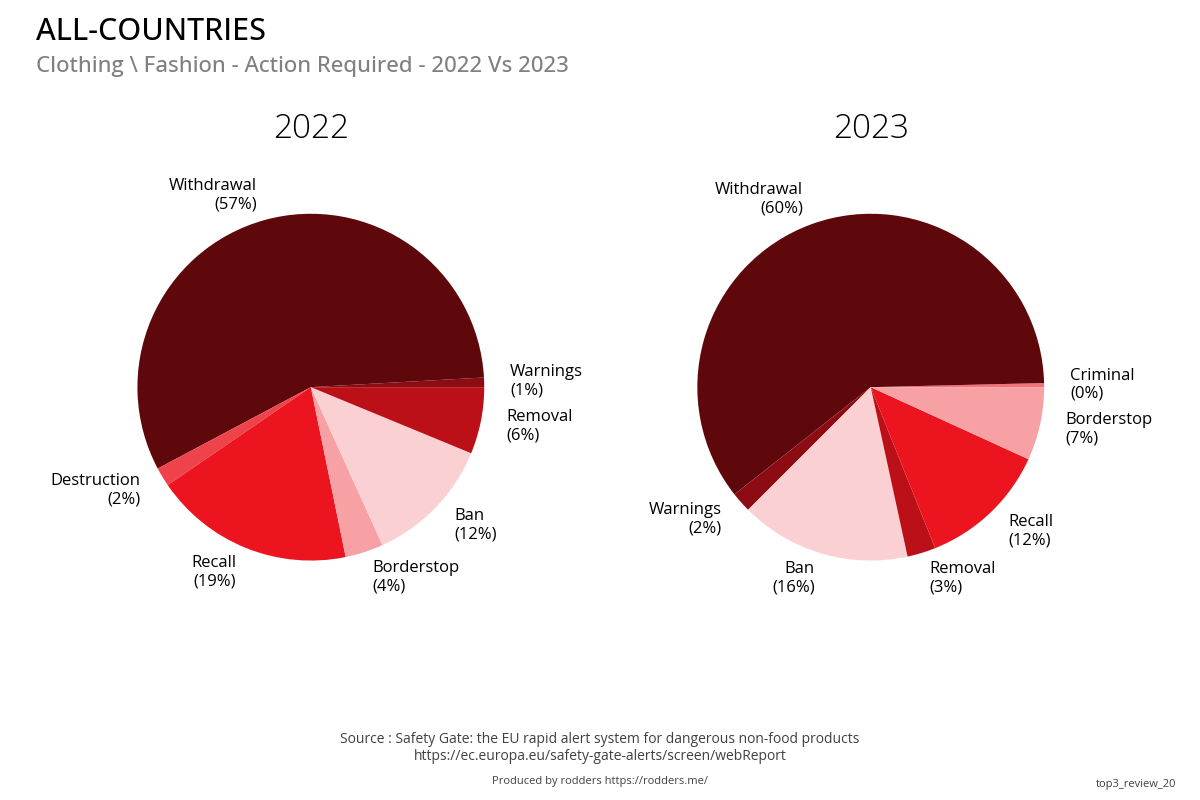
Annual Total and Compulsory Vs Voluntary Total
| Annual Total | Compulsory Vs Voluntary Total |
|---|---|
|
|
#3 - Compulsory / Voluntary Responsible Party
Previous Year Vs Current Year
#3 - Annual Total Compulsory Vs Voluntary Total
| Annual Total | Compulsory Vs Voluntary Total |
|---|---|
|
|
#3 - Top Brands for Safety Alerts
| Top 30 Brands |
|---|
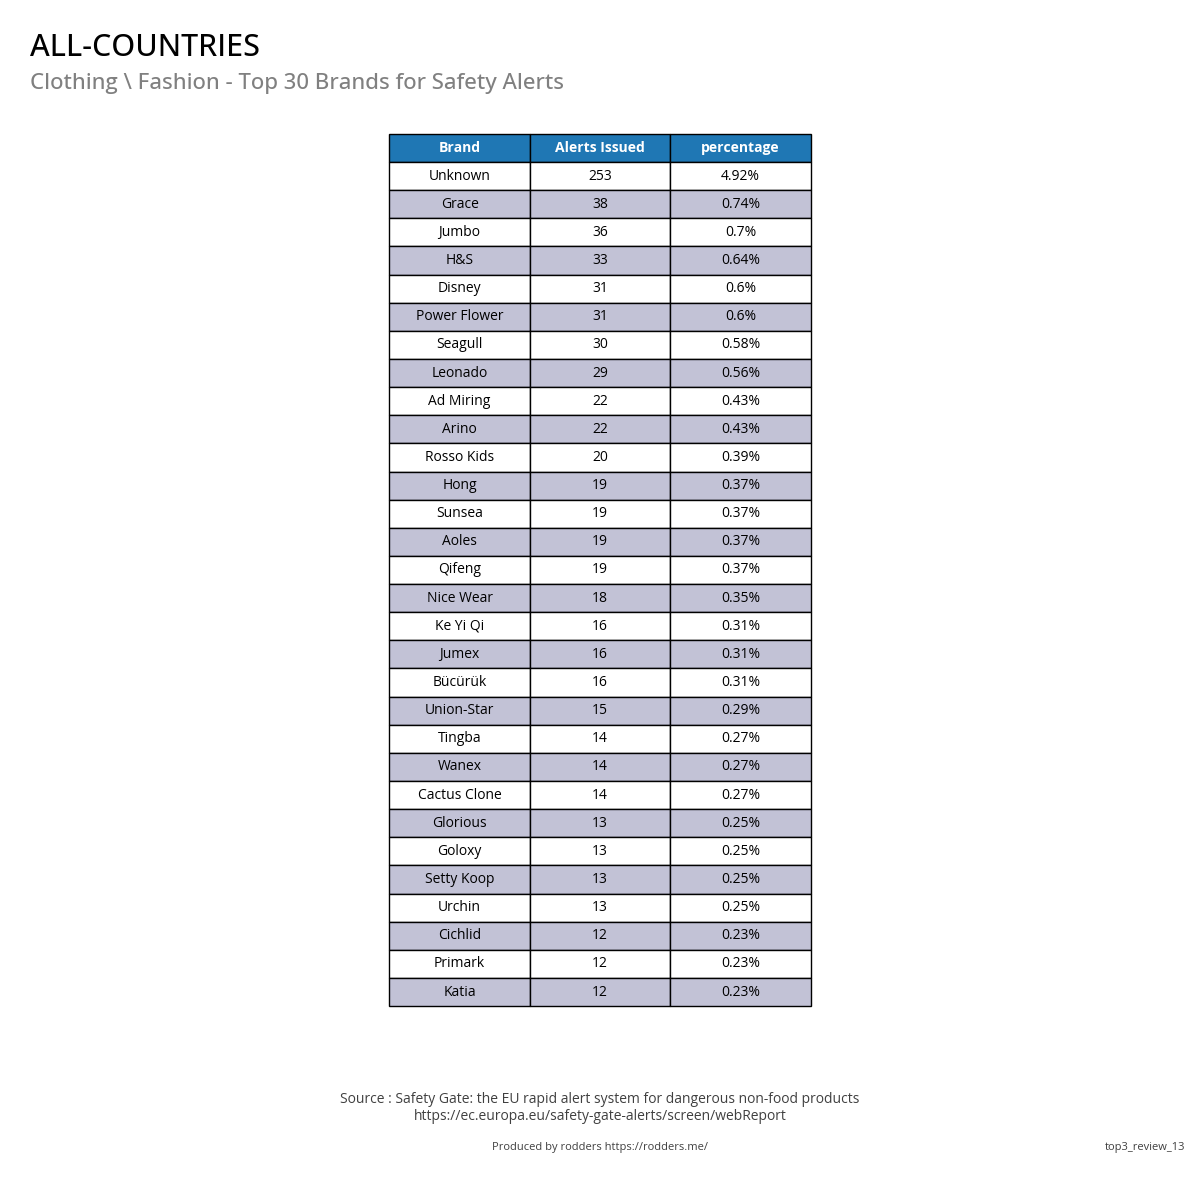
|