Jump to section
EU Safetygate report - 2024 Year to Date
![]()
Last Updated: Tuesday, September 17, 2024 12:55 PM - Data up to Week 37 - 2024
The YEAR TO DATE Annual Summary Report provides a comprehensive overview of safety alerts issued by the European Union for non-food products throughout the year. The data set compares the same time period up to the noted week for each year. This report highlights the most notable data and trends, including significant increases or decreases in alerts.
Data Includes:
- Common types of hazards (Risk Type)
- Categories of products most frequently flagged
- Country of product origin
- Countries submitting alerts
- Regulatory action required
- Regulatory identification of responsible party
- Brand Owners
And more.
It aims to give readers a clear and concise understanding of the key safety concerns and regulatory actions taken within the year.
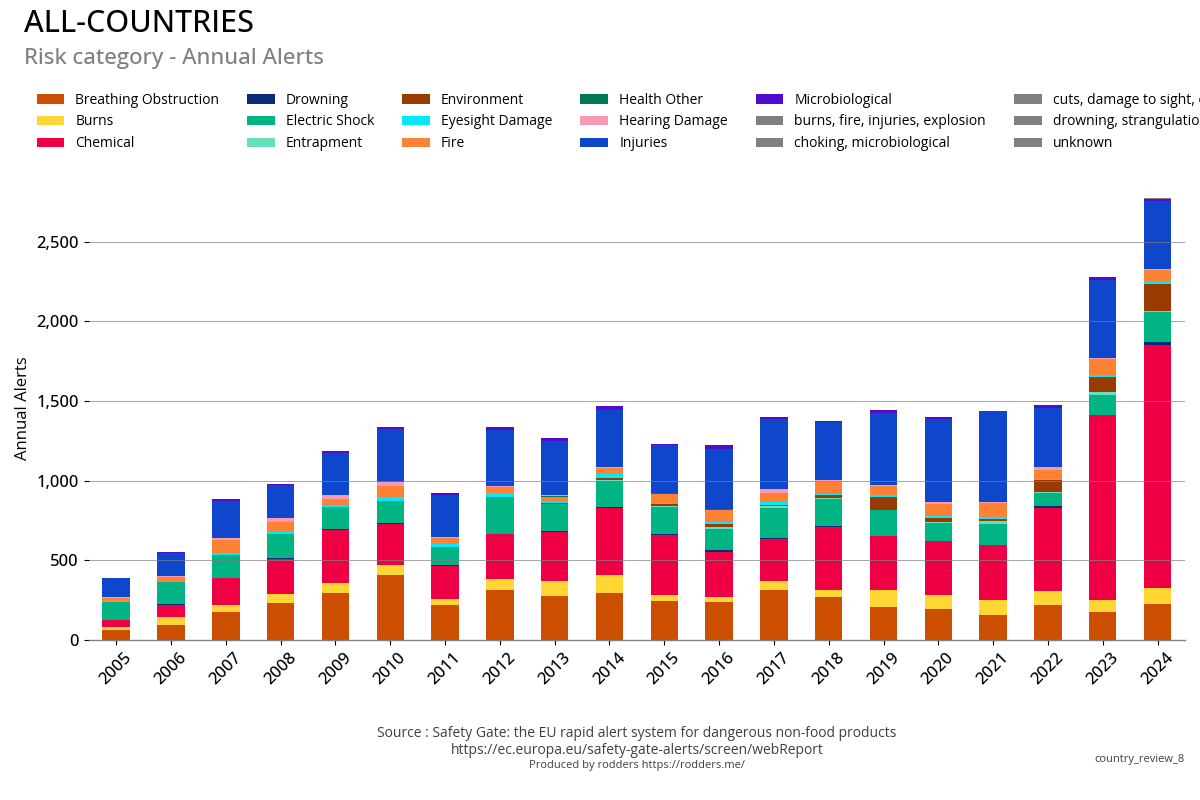
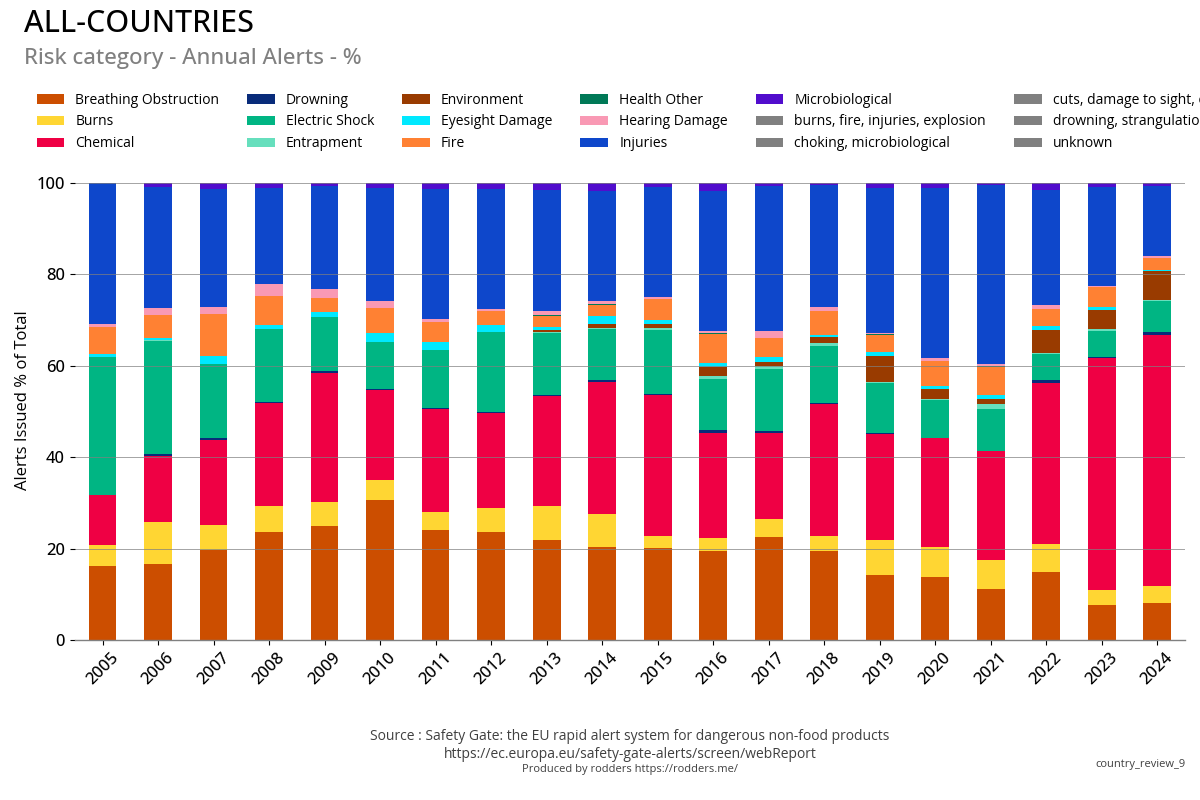
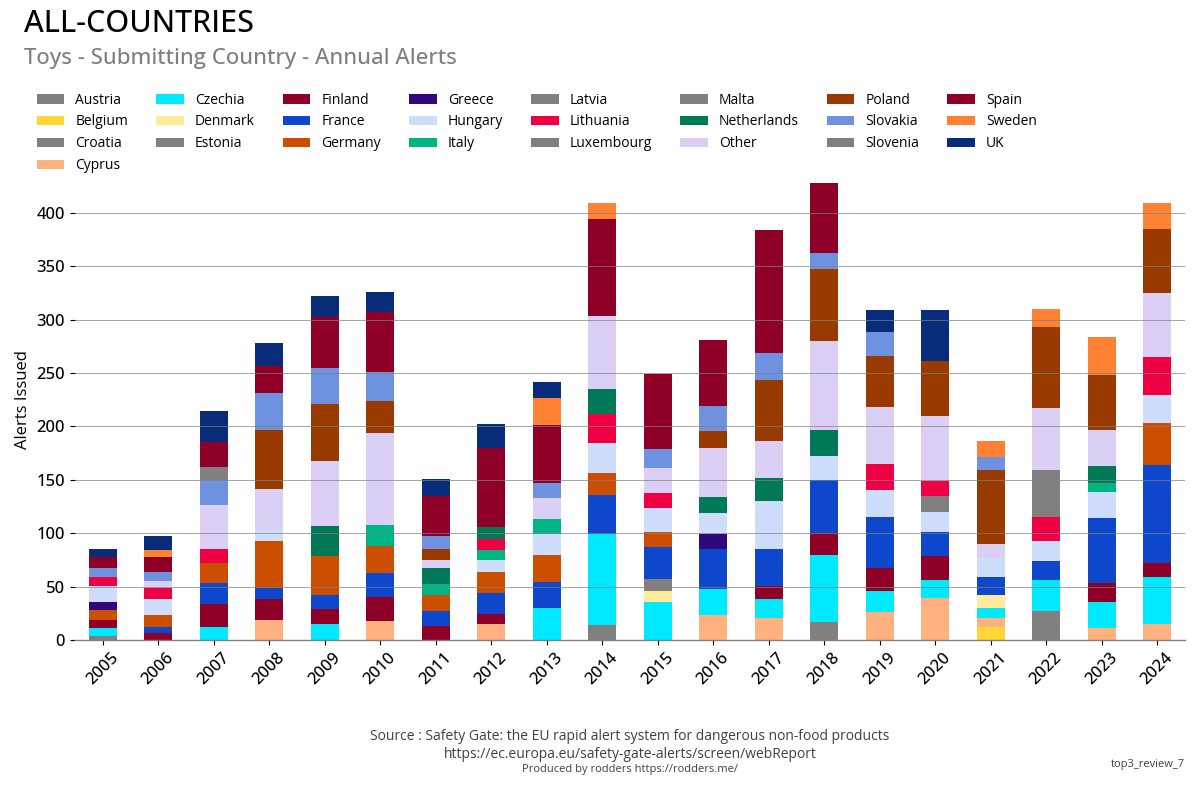
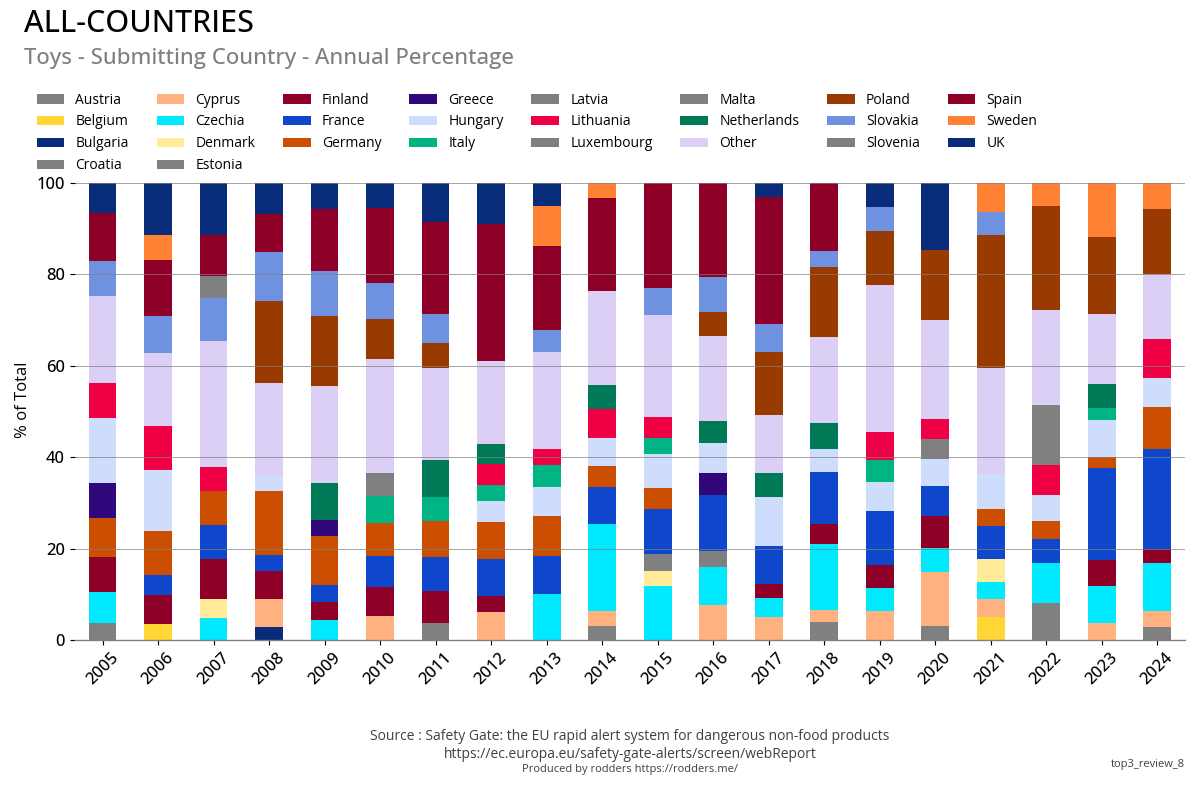
Annual Alerts
Annual alerts for this report compares the same time period up to the noted week for each year, it's an indication of the level of activity across EU member states applying.
Total Annual Alerts Issued
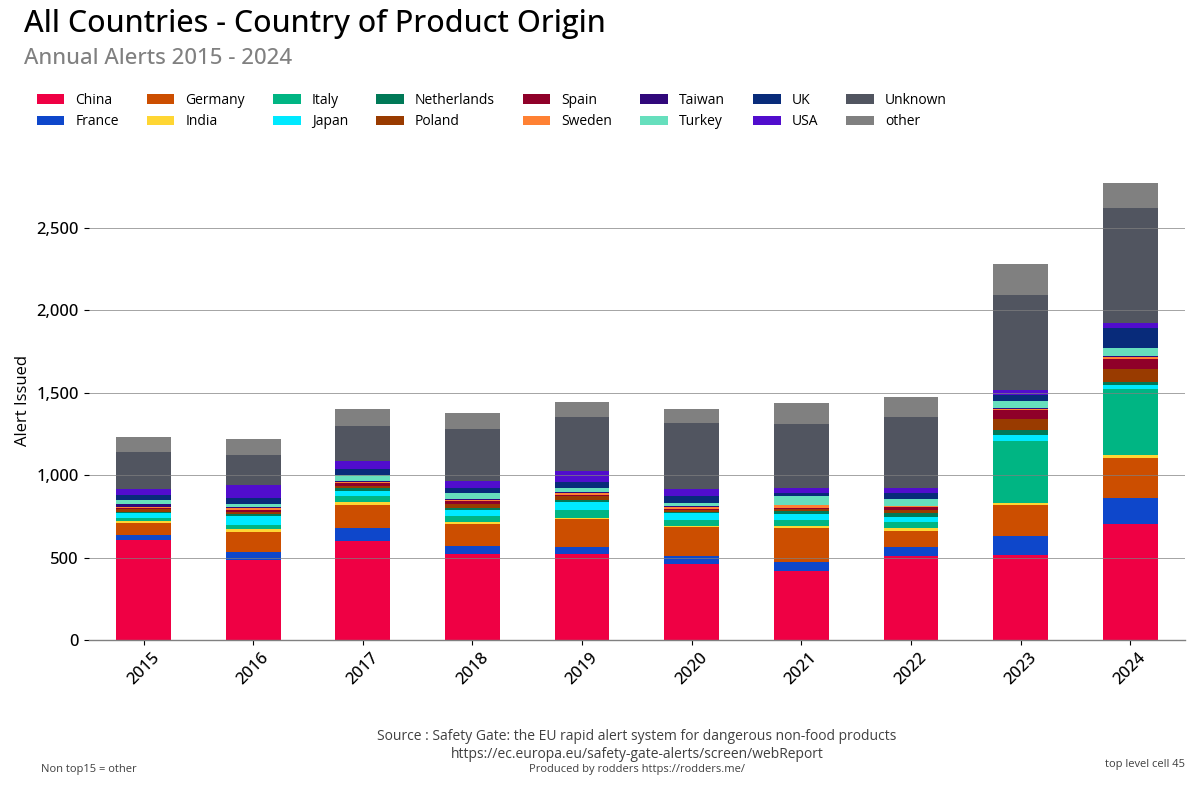
Over the last few years, the EU Safetygate member states issue on average around 2,000 - 2,200 safety alerts per year.
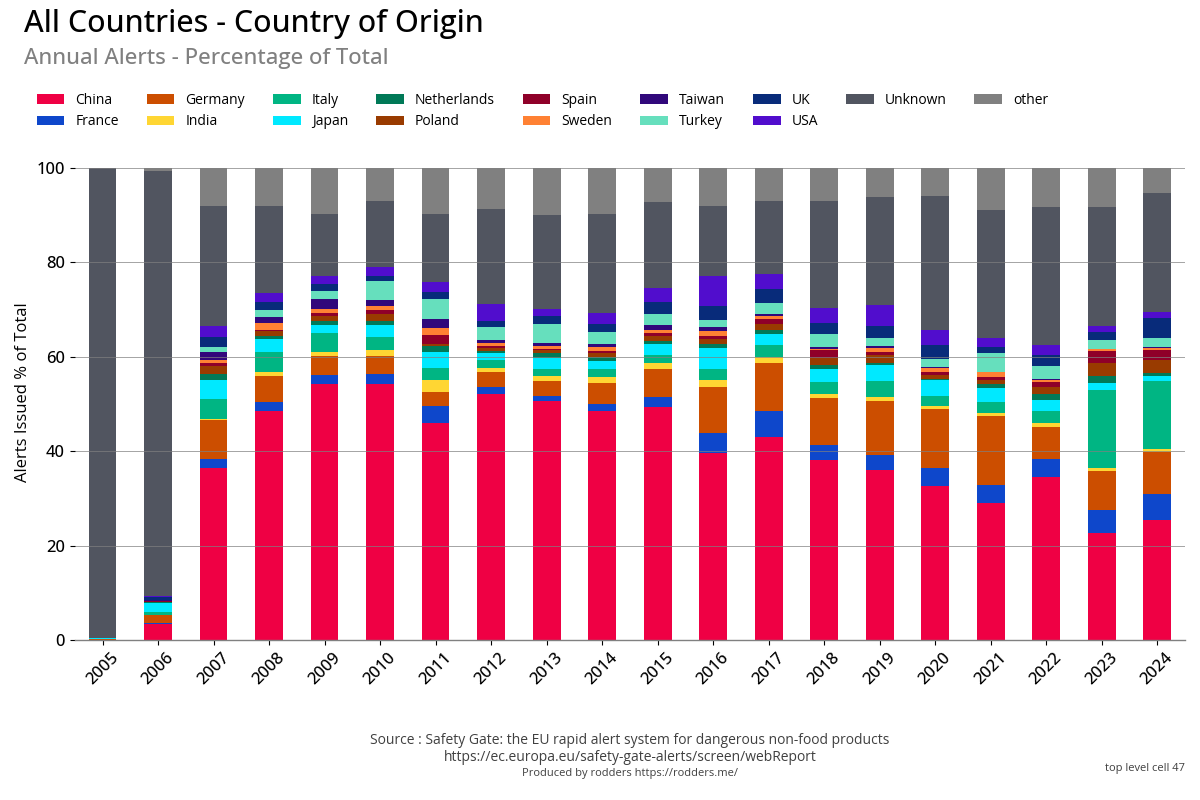
- Around 25% of all alerts issued are for products where the Country of Origin is unknown.
- On average China represents around 50% of Alerts issued.
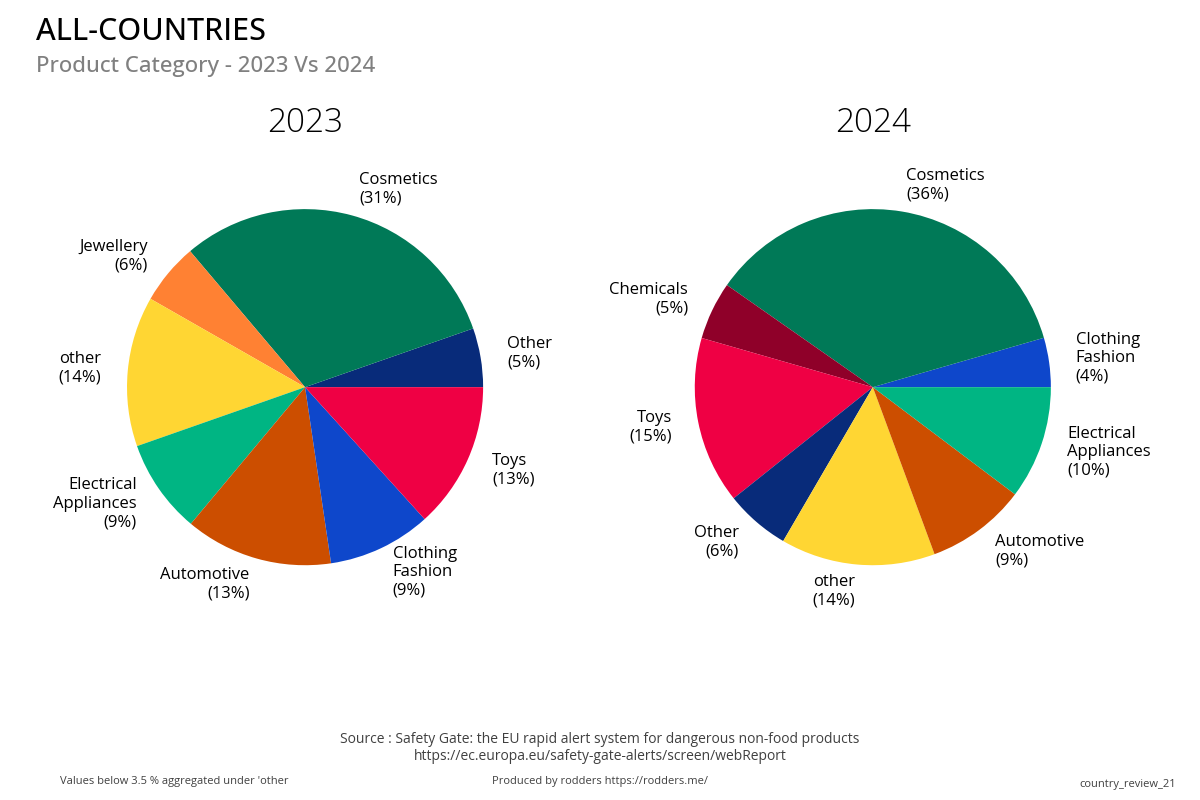
- 2023 was exceptional with 1,072 alerts to cosmetic products containing the chemical BMHCA / Lilial which was banned in 2022 for use in cosmetics.
- 2024 continues the exceptions with 929 new alerts issued for non compliant cosmetic products. 37% of all alerts issued are for Cosmetics.
So far, over 2,200 cosmetic products have been withdrawn or banned from sale in the EU.
Comparing annual totals up to YTD 2024
| Metric | 2005 | 2006 | 2007 | 2008 | 2009 | 2010 | 2011 | 2012 | 2013 | 2014 | 2015 |
|---|---|---|---|---|---|---|---|---|---|---|---|
| Count | 559 | 831 | 1,274 | 1,465 | 1,577 | 1,854 | 1,520 | 1,873 | 2,008 | 2,236 | 1,851 |
| % Change | 0 | 49 | 53 | 15 | 8 | 18 | -18 | 23 | 7 | 11 | -17 |
| Change | 0 | 272 | 443 | 191 | 112 | 277 | -334 | 353 | 135 | 228 | -385 |
| Metric | 2016 | 2017 | 2018 | 2019 | 2020 | 2021 | 2022 | 2023 | 2024 | 2025 | 2026 |
|---|---|---|---|---|---|---|---|---|---|---|---|
| Count | 1,868 | 2,013 | 2,030 | 2,113 | 2,156 | 2,055 | 2,072 | 3,245 | 2,773 | ||
| % Change | 0 | 8 | 1 | 4 | 2 | -5 | 1 | 57 | -15 | ||
| Change | 0 | 145 | 17 | 83 | 43 | -101 | 17 | 1,173 | -472 |
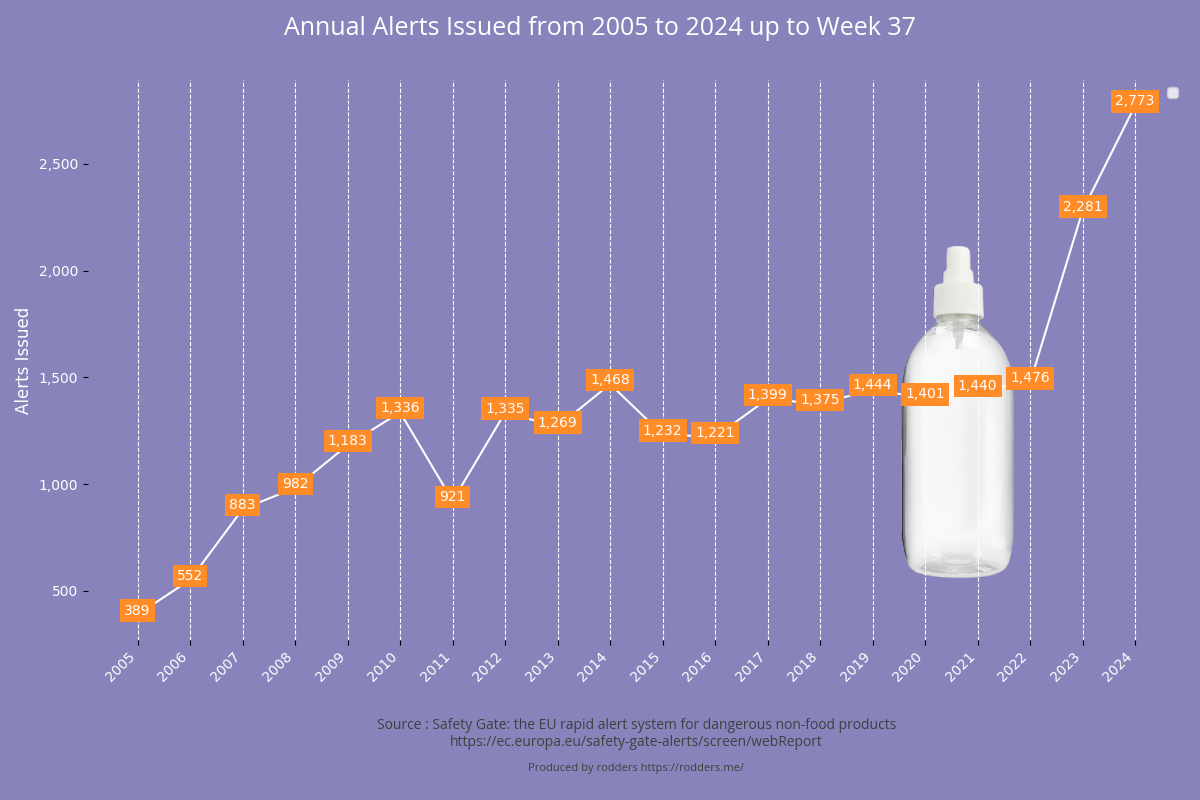
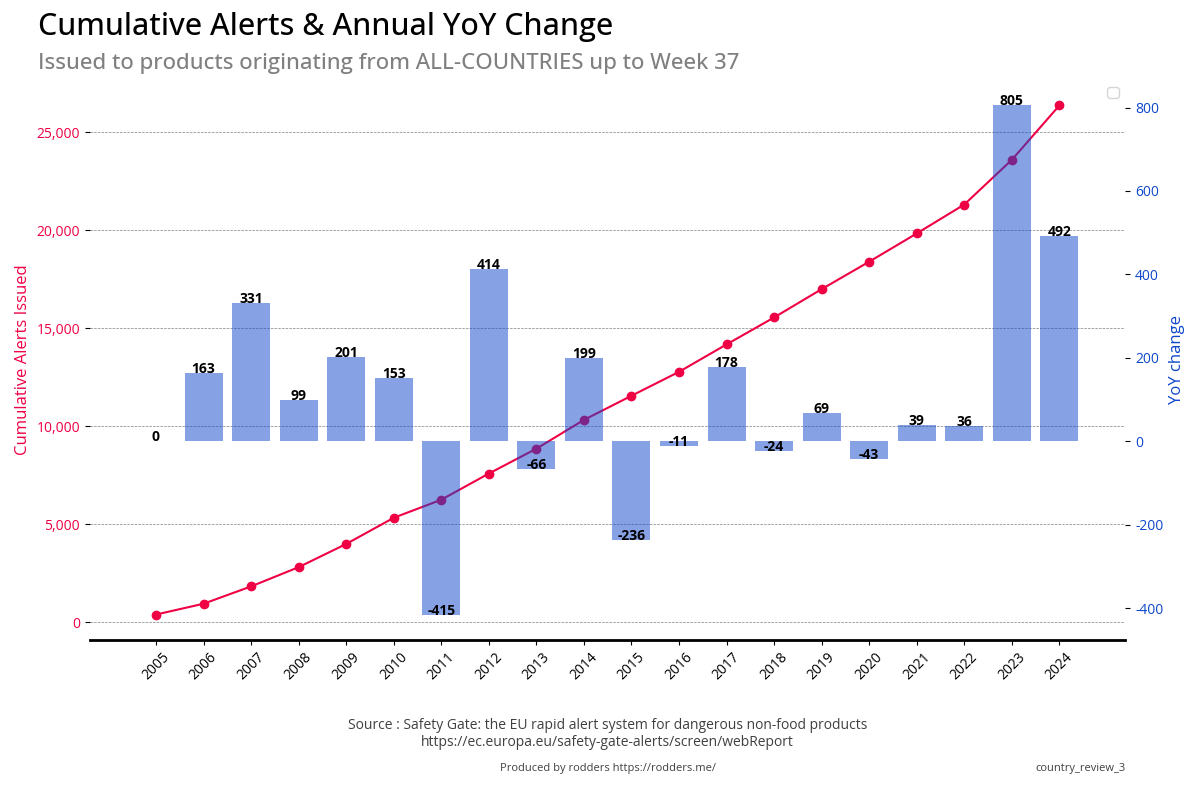
Comparing up to the same week for each year
| Metric | 2005 | 2006 | 2007 | 2008 | 2009 | 2010 | 2011 | 2012 | 2013 | 2014 | 2015 |
|---|---|---|---|---|---|---|---|---|---|---|---|
| Count | 389 | 552 | 883 | 982 | 1,183 | 1,336 | 921 | 1,335 | 1,269 | 1,468 | 1,232 |
| % Change | 0 | 42 | 60 | 11 | 20 | 13 | -31 | 45 | -5 | 16 | -16 |
| Change | 0 | 163 | 331 | 99 | 201 | 153 | -415 | 414 | -66 | 199 | -236 |
| Metric | 2016 | 2017 | 2018 | 2019 | 2020 | 2021 | 2022 | 2023 | 2024 | 2025 | 2026 |
|---|---|---|---|---|---|---|---|---|---|---|---|
| Count | 1,221 | 1,399 | 1,375 | 1,444 | 1,401 | 1,440 | 1,476 | 2,281 | 2,773 | ||
| % Change | 0 | 15 | -2 | 5 | -3 | 3 | 2 | 55 | 22 | ||
| Change | 0 | 178 | -24 | 69 | -43 | 39 | 36 | 805 | 492 |
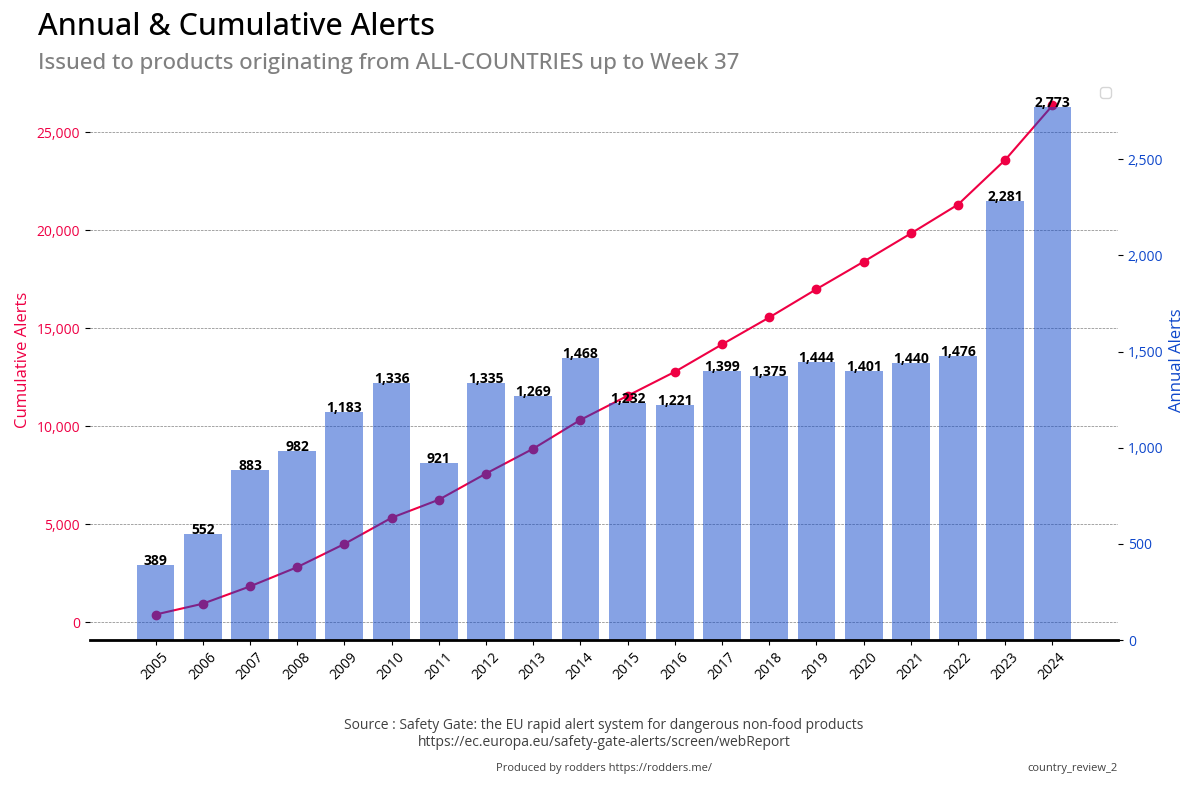
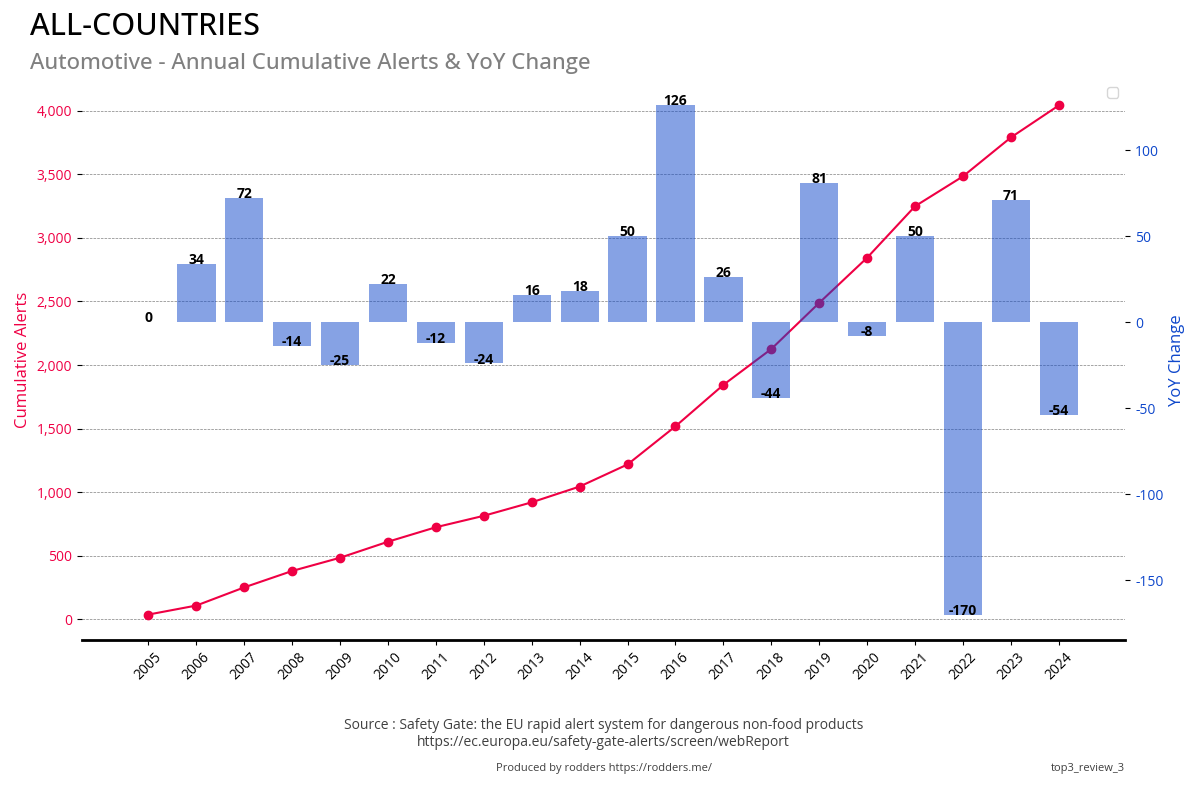
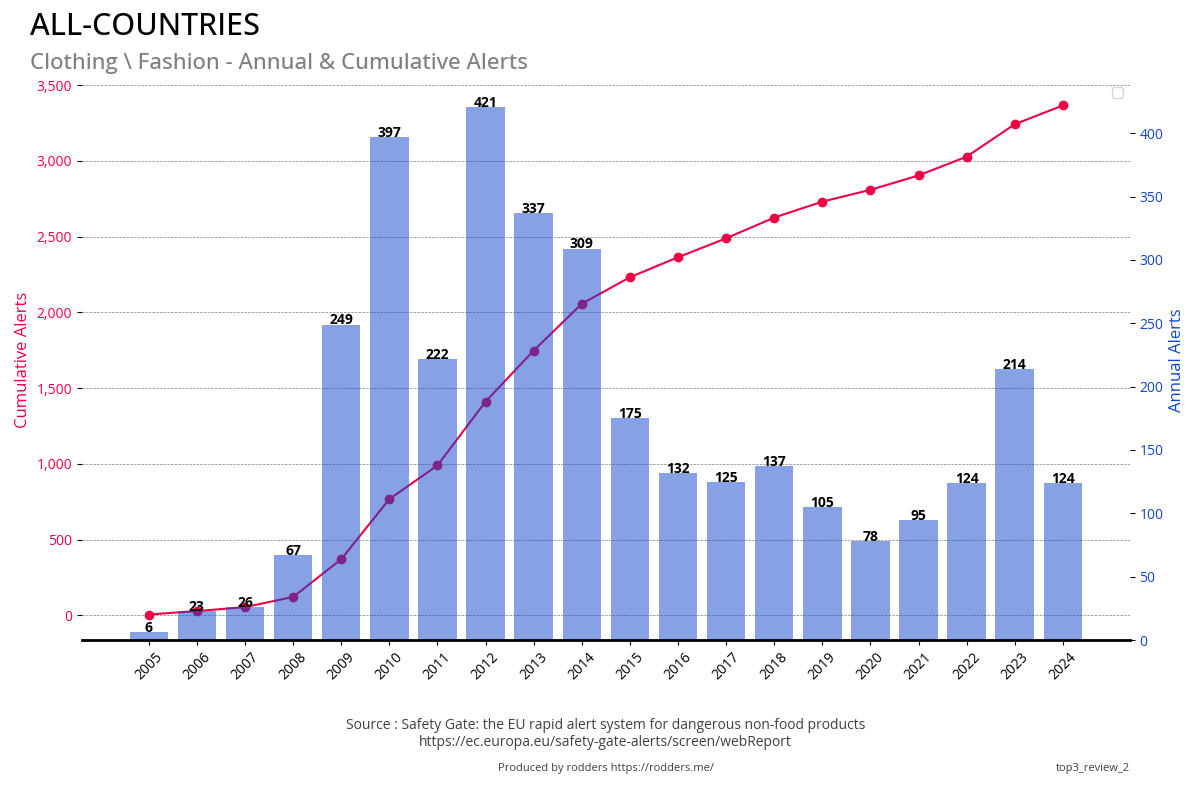
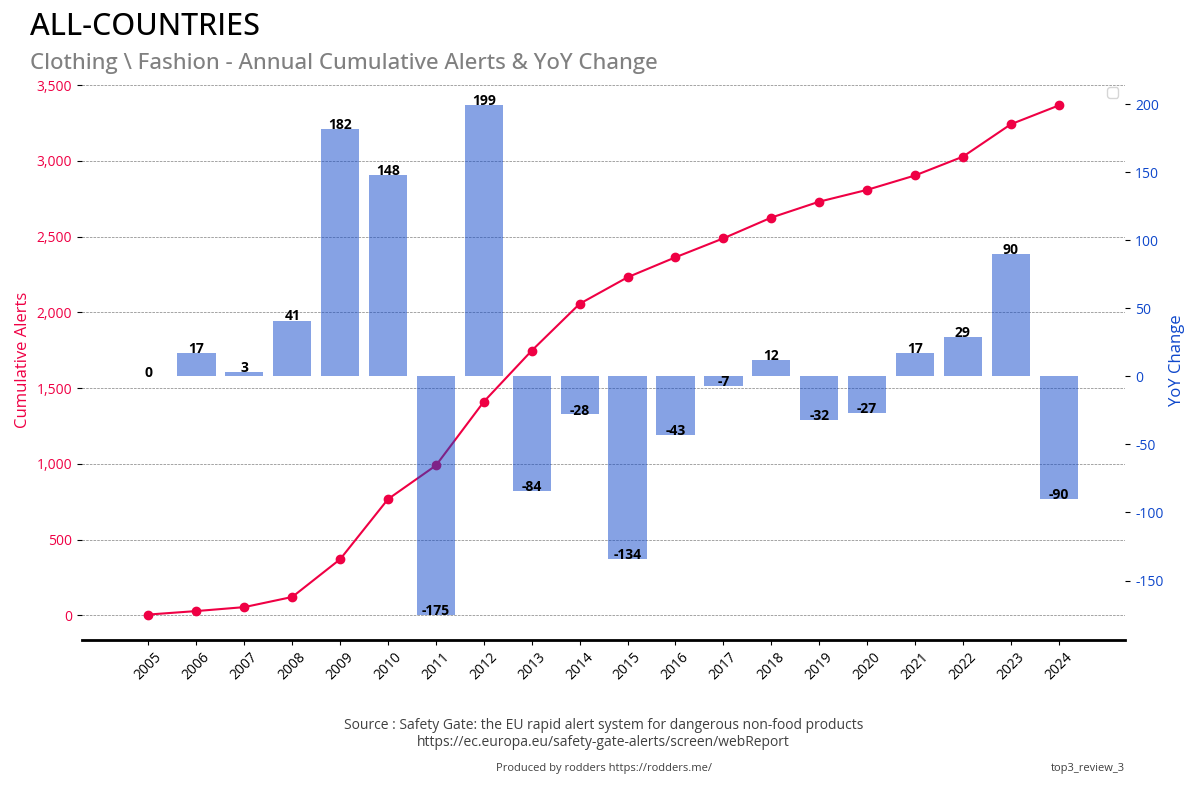
Annual and Cumulative Alerts
2023 saw a 59% increase in the average number of alerts issued in a year, with the total alerts issued increasing from 2,100 alerts in 2022 to 3,349 in 2023, an increase of 1,249 over the previous year.
2024 Year to date, there has been a 29% increase in the number of alerts issued compared to the same time period the previous year.
| All Countries | Excluding Unknown |
|---|---|
|
|
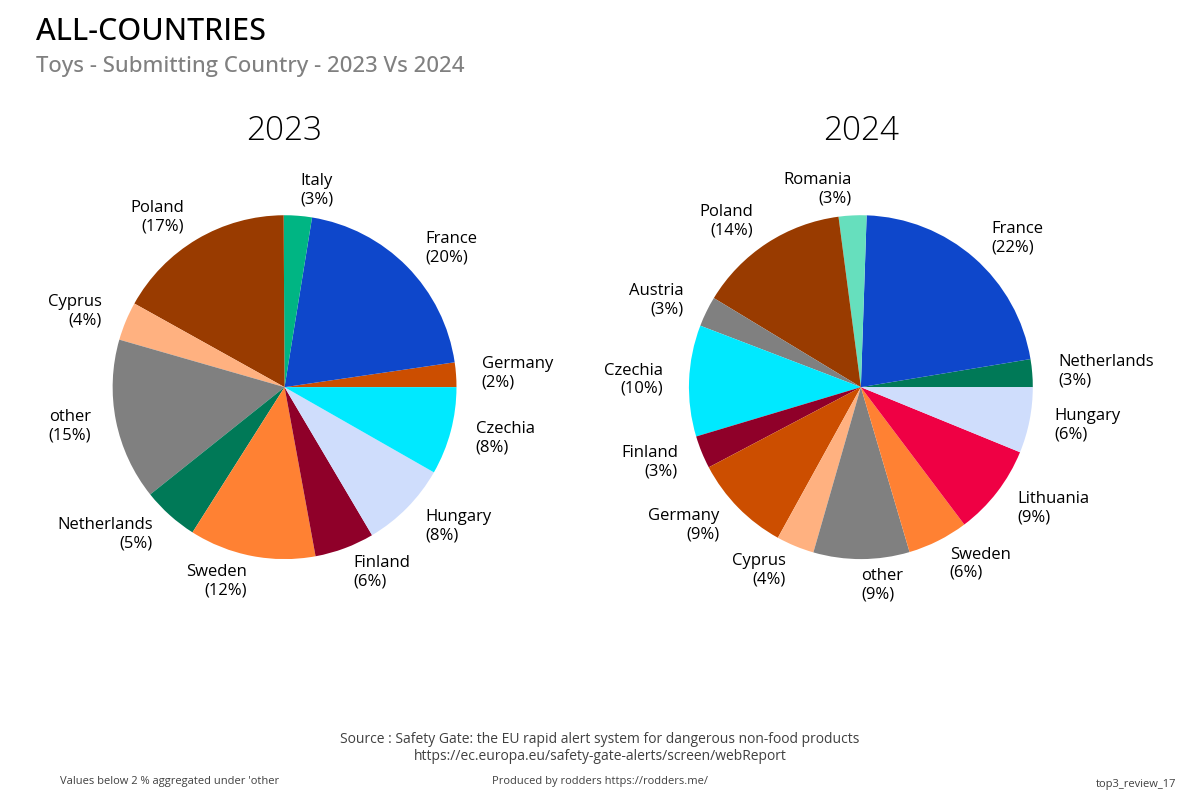
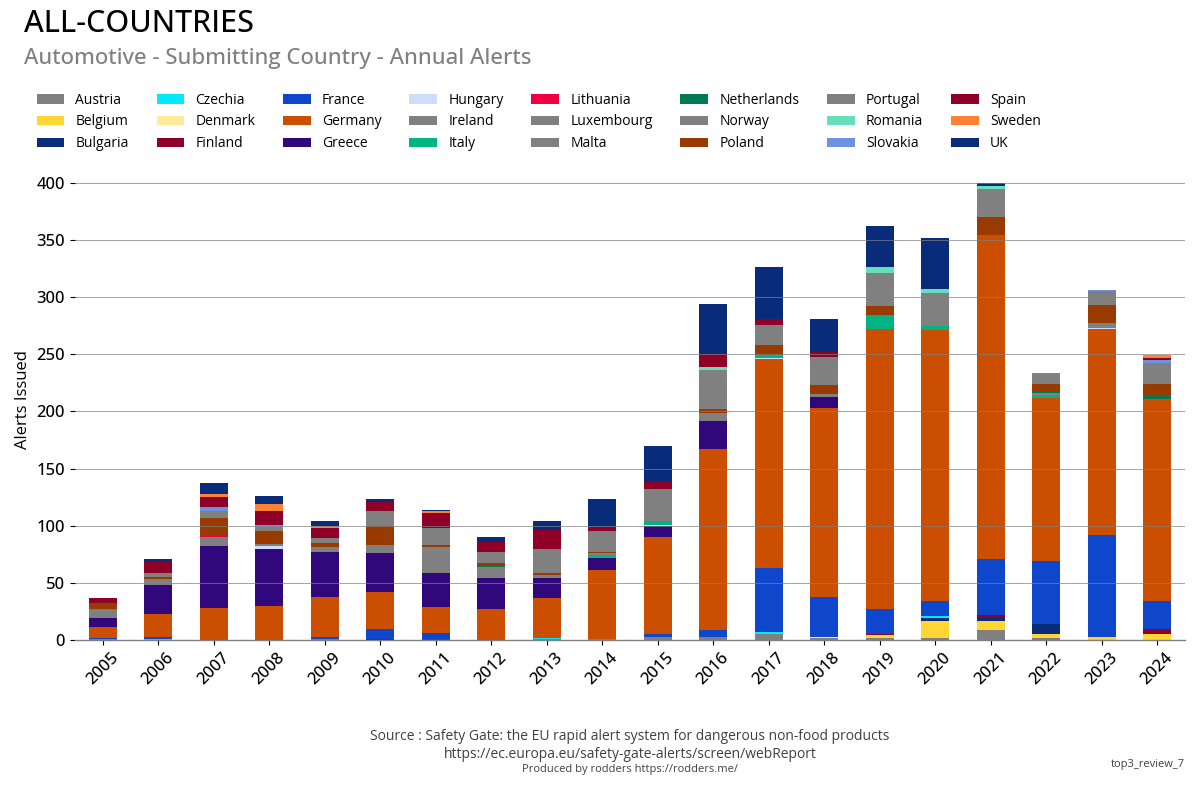
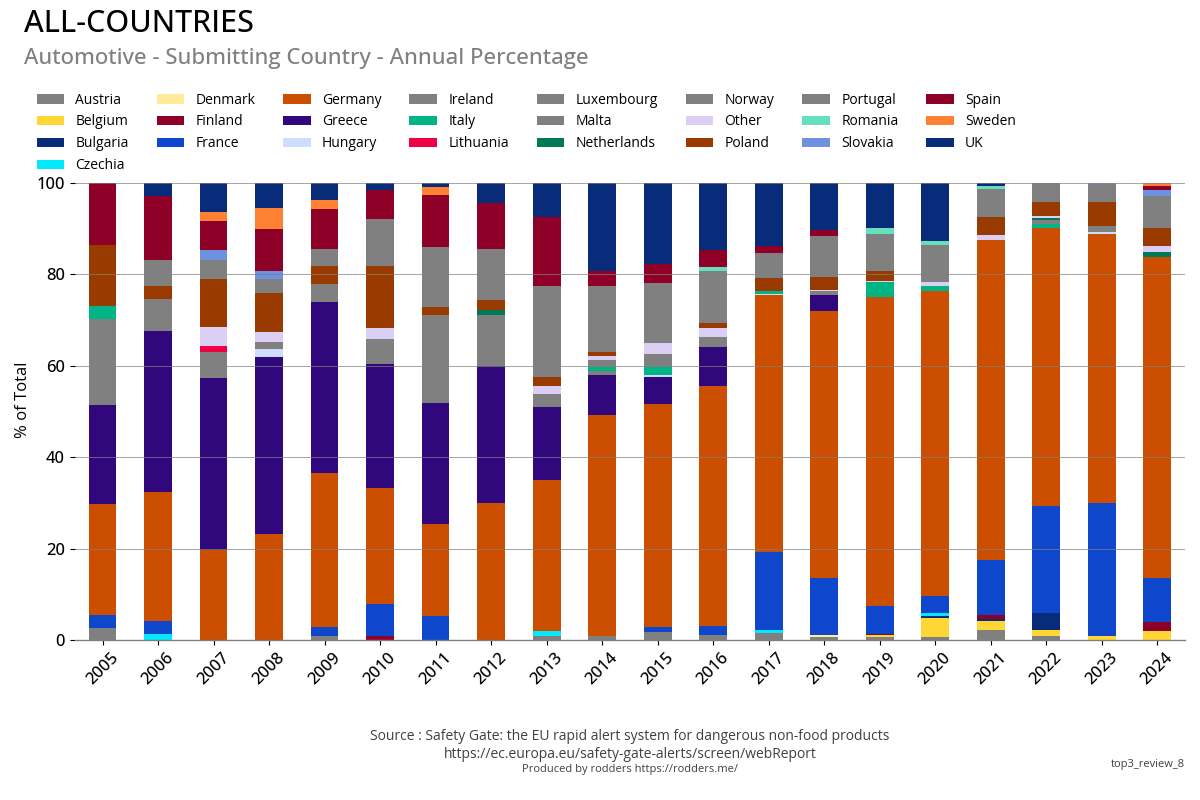
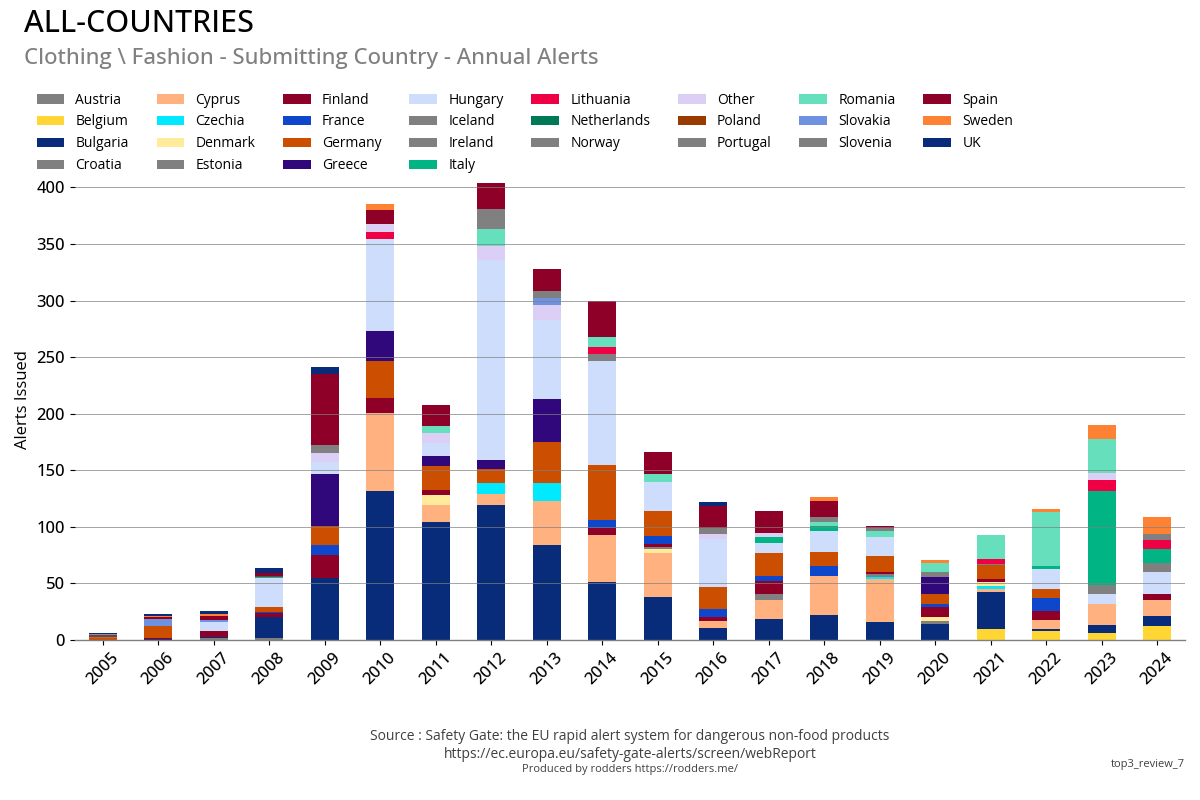
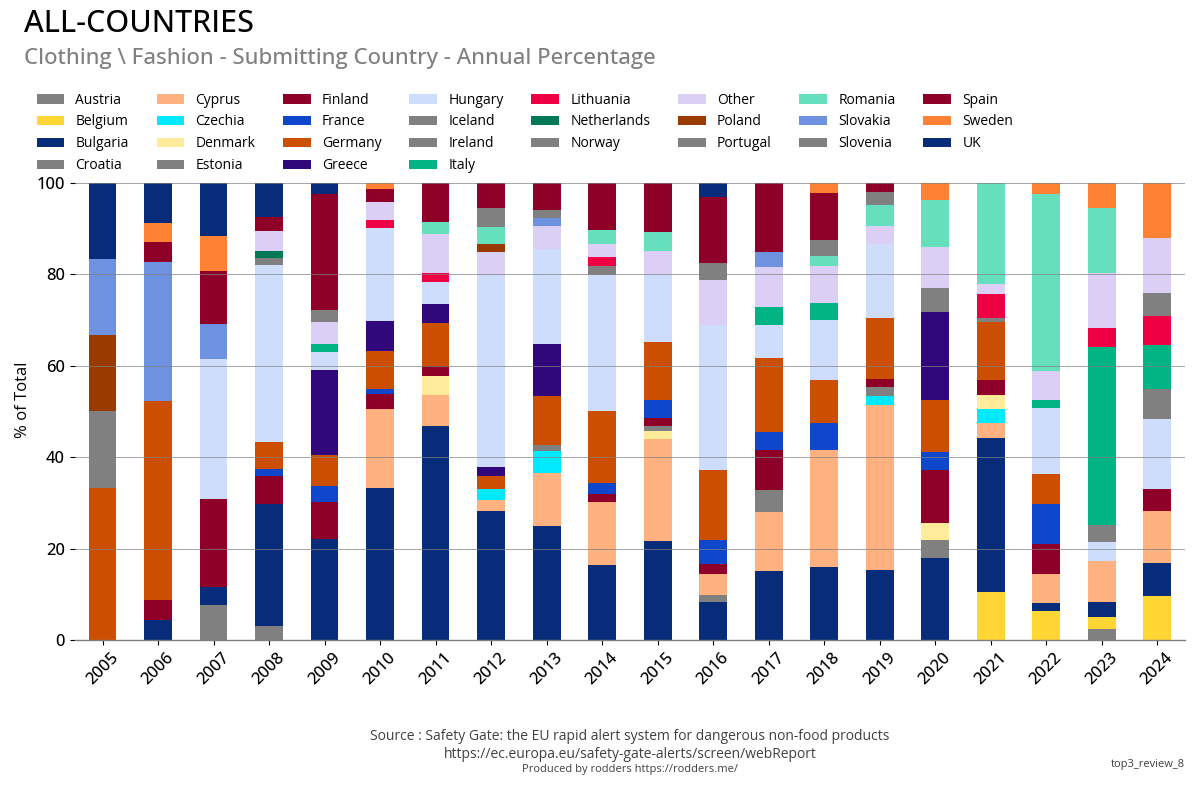
Submitting Country
Previous Year Vs Current Year

Annual Alerts and Annual Percentage of Total
| Annual Count | Annual Percent of Total |
|---|---|
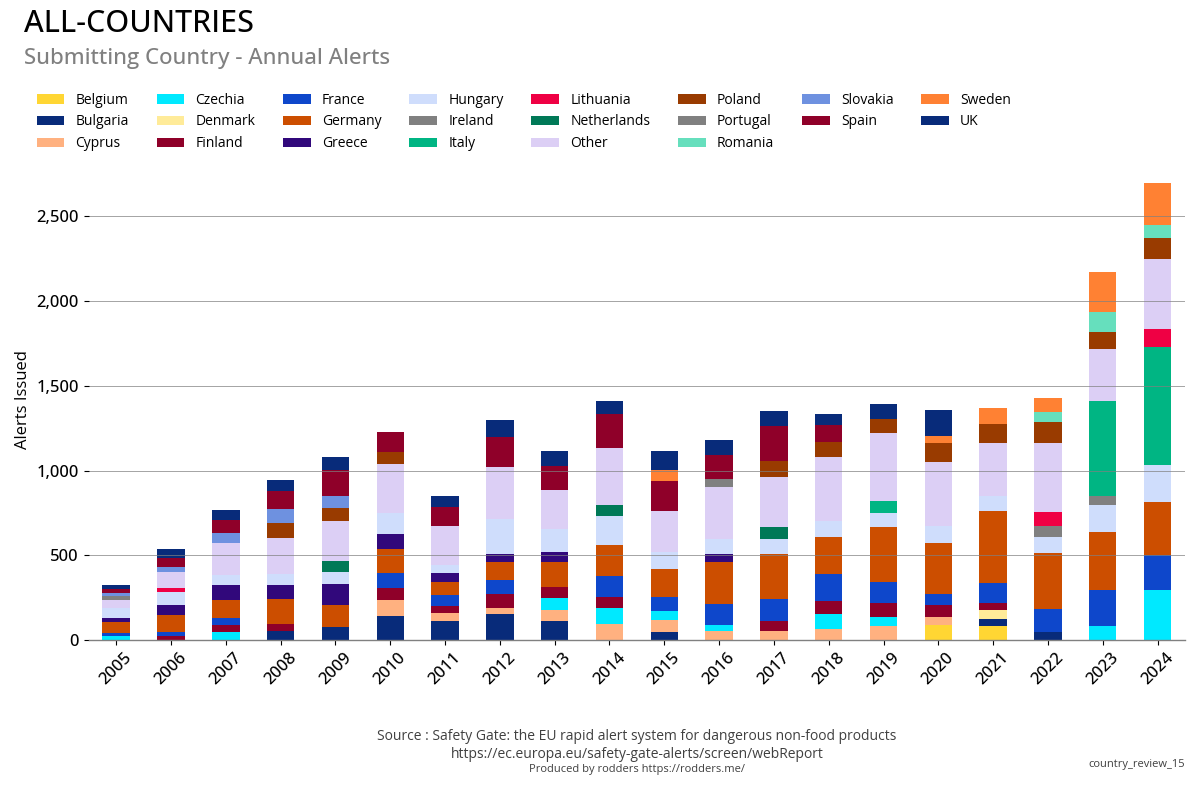
|
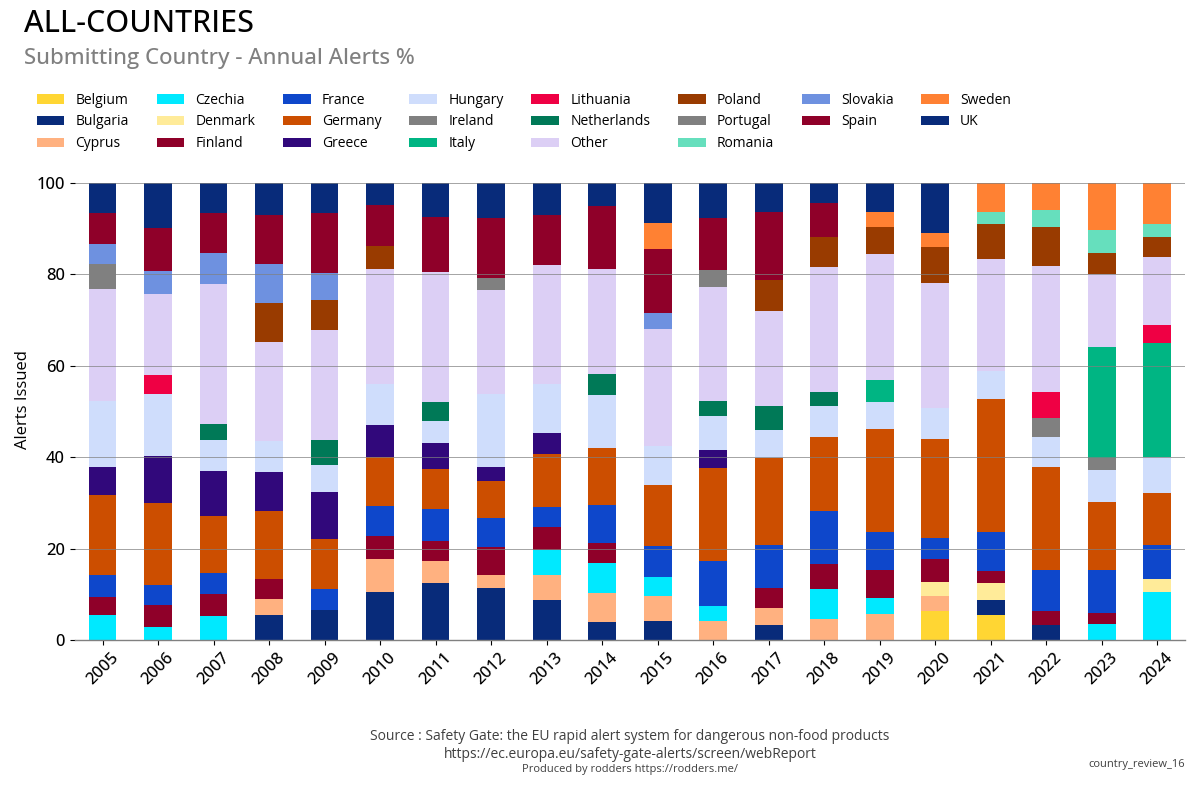
|
What's happening with Cosmetics?
European Ban on Lilial in Cosmetics - March 2021
2023 was an exception with the introduction of the ban on the chemical lilial / BMHCA for use in cosmetics on 1st March 2022.
The significant increase seen 2023 over 2022 is due to a change in regulations for a Butylphenyl Methylpropional (BMHCA, trade name 'Lilial') BMHCA, a chemical commonly used in cosmetics.
BMHCA is now deemed to be hazardous and unsuitable for use in cosmetic products due to the fact that it is included in so many products. While an individual exposure poses a minimal risk, cumulative exposure from the use of multiple products containing this chemical increases the risk considerably.
It's also worth noting that BMHCA is a fragrance commonly used in household cleaning products, however no guidance has been issued for the it's use in cleaning products at this stage.
BMHCA "Lilial" Molecule
Since 1 March 2022, butylphenyl methylpropional (BMHCA/'Lilial') is classified as a Carcinogenic, Mutagenic or Reprotoxic (CMR) category 1B substance under the EU and GB Classification, Labelling and Packaging (CLP) Regulations.
This ban affected around 1,100 - 1,200 products (90-95% of the annual increase of (1,249) alerts or 32-35% of all alerts issued (3,349) in 2023), and is the reason for the significant increase seen in the Safetygate analysis.
Safety Gate alerts issued for Cosmetics (Total)
| Metric | 2005 | 2006 | 2007 | 2008 | 2009 | 2010 | 2011 | 2012 | 2013 | 2014 | 2015 |
|---|---|---|---|---|---|---|---|---|---|---|---|
| Count | 7 | 23 | 57 | 40 | 52 | 47 | 74 | 52 | 67 | 57 | 34 |
| % Change | 0 | 229 | 148 | -30 | 30 | -10 | 57 | -30 | 29 | -15 | -40 |
| Change | 0 | 16 | 34 | -17 | 12 | -5 | 27 | -22 | 15 | -10 | -23 |
| Metric | 2016 | 2017 | 2018 | 2019 | 2020 | 2021 | 2022 | 2023 | 2024 | |
|---|---|---|---|---|---|---|---|---|---|---|
| Count | 66 | 32 | 83 | 63 | 70 | 40 | 129 | 703 | 993 | |
| % Change | 0 | -52 | 159 | -24 | 11 | -43 | 222 | 445 | 41 | |
| Change | 0 | -34 | 51 | -20 | 7 | -30 | 89 | 574 | 290 |
UK and BMHCA
Article 15 of the UK and EU Cosmetics Regulations requires CMR-classified substances to undergo an exemption process to assess whether they can continue to be used as cosmetic ingredients. This regulatory process has not yet been completed under the UK Cosmetics Regulation. Therefore, the new EU provisions for BMHCA/'Lilial' do not apply in GB. However, a ban is expected in GB on 15 December 2022 (the 'off- shelf' date).
While companies have been working towards the deadline of 1 March 2022 for products for both the EU and UK markets, as advised by CTPA, as of revision date of this statement, BMHCA/'Lilial' can be legally used in cosmetic products in GB until:
- 15 October 2022, as placing on the market deadline;
- 15 December 2022, as making available (off-shelf) deadline.
The Cosmetic, Toiletry and Perfumery Association (CTPA) advised its members to voluntarily remove Lilial from cosmetic products by the end of 2021. The UK's cosmetic regulation has since been updated to include Lilial in Annex II LIST OF SUBSTANCES PROHIBITED IN COSMETIC PRODUCTS
What about other markets?
Lilial is still permitted for use in cosmetics in other countries outside the EU and the UK.
Scientific Opinion on BMHCA
Does the SCCS consider Butylphenyl methylpropional (p-BMHCA) safe for use as a fragrance ingredient in cosmetic leave-on and rinse-off type products in a concentration limit(s) according the ones set up by IFRA as reported above?
On individual product basis, Butylphenyl methylpropional (p-BMHCA) (CAS 80-54-6) with alpha-tocopherol at 200 ppm, can be considered safe when used as fragrance ingredient in different cosmetic leave-on and rinse-off type products. However, considering the first-tier deterministic aggregate exposure, arising from the use of different product types together, Butylphenyl methylpropional at the proposed concentrations cannot be considered as safe.
<>"first-tier deterministic aggregate exposure" refers to an initial, simplified assessment of total exposure to a particular substance from all sources and routes, using fixed input values for variables. This approach provides a preliminary estimate of exposure that can help identify potential risks and determine whether more detailed, possibly probabilistic, and higher-tier assessments are needed. It's a conservative approach that aims to ensure safety by not underestimating potential exposure levels, but it might not capture the full variability and uncertainty inherent in real-world exposure scenarios.
This Opinion is not applicable to the use of p-BMHCA in any sprayable products that could lead to exposure of the consumer's lung by inhalation.
Does the SCCS have any further scientific concerns with regard to the use of Butylphenyl methylpropional (p-BMHCA) as a fragrance ingredient in cosmetic leave-on and/or rinse-off type products?
Evaluation of this substance by other scientific bodies (e.g. under REACH) should also be taken into consideration by the Applicant for potential future assessment of the substance. Butylphenyl methylpropional is also used as a fragrance ingredient in some non-cosmetic products such as household cleaners and detergents. As no specific exposure data were made available to SCCS to assess exposure following these non-cosmetic uses, it was not possible to include them in the aggregated exposure scenarios. Therefore, the actual total exposure of the consumer may be higher than exposure from cosmetic products alone.
https://health.ec.europa.eu/system/files/2021-08/sccs_o_213_0.pdfThe European Cosmetics Industry
It is estimated that the cosmetics and personal care industry brings at least €29 billion in added value to the European economy annually. €11 billion is contributed directly by the manufacture of cosmetic products and €18 billion indirectly through the supply chain (Eurostat 2015).
Including direct, indirect and induced economic activity, the industry supports over 3.6 million jobs. In 2022, over 254,259 people were employed directly, and a further 2.78 million indirectly in the cosmetics value chain.
For every 10 workers employed in the European cosmetics and personal care industry, at least two further jobs are generated in the wider economy as a result of employees spending their wages on goods and services.
Source: https://cosmeticseurope.eu/cosmetics-industry/
Italy and Cosmetics
Italy represents a significant portion of the European cosmetics and personal care products market, with a value of €11.5 billion.
This places Italy among the largest national markets within Europe, following Germany (€14.3 billion) and France (€12.9 billion).
Cosmetic Sub Categories
The cosmetic sub product types that have received Safety Alerts.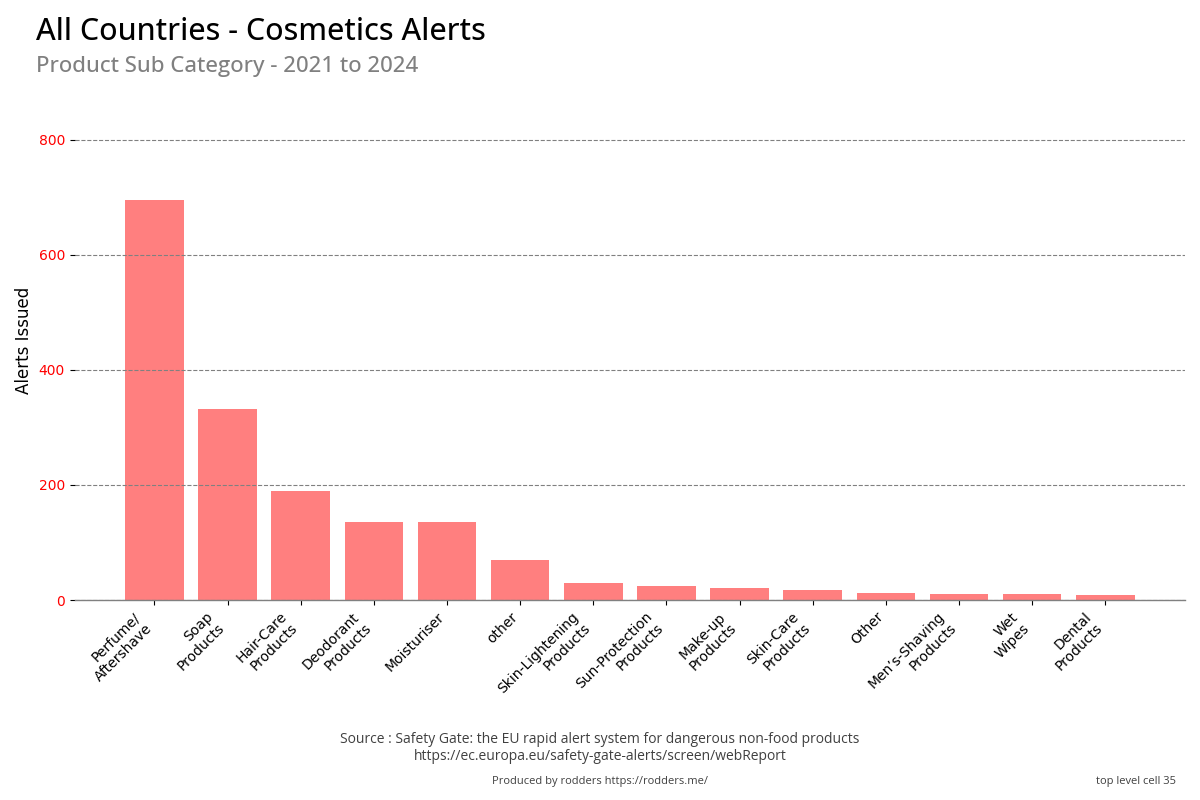
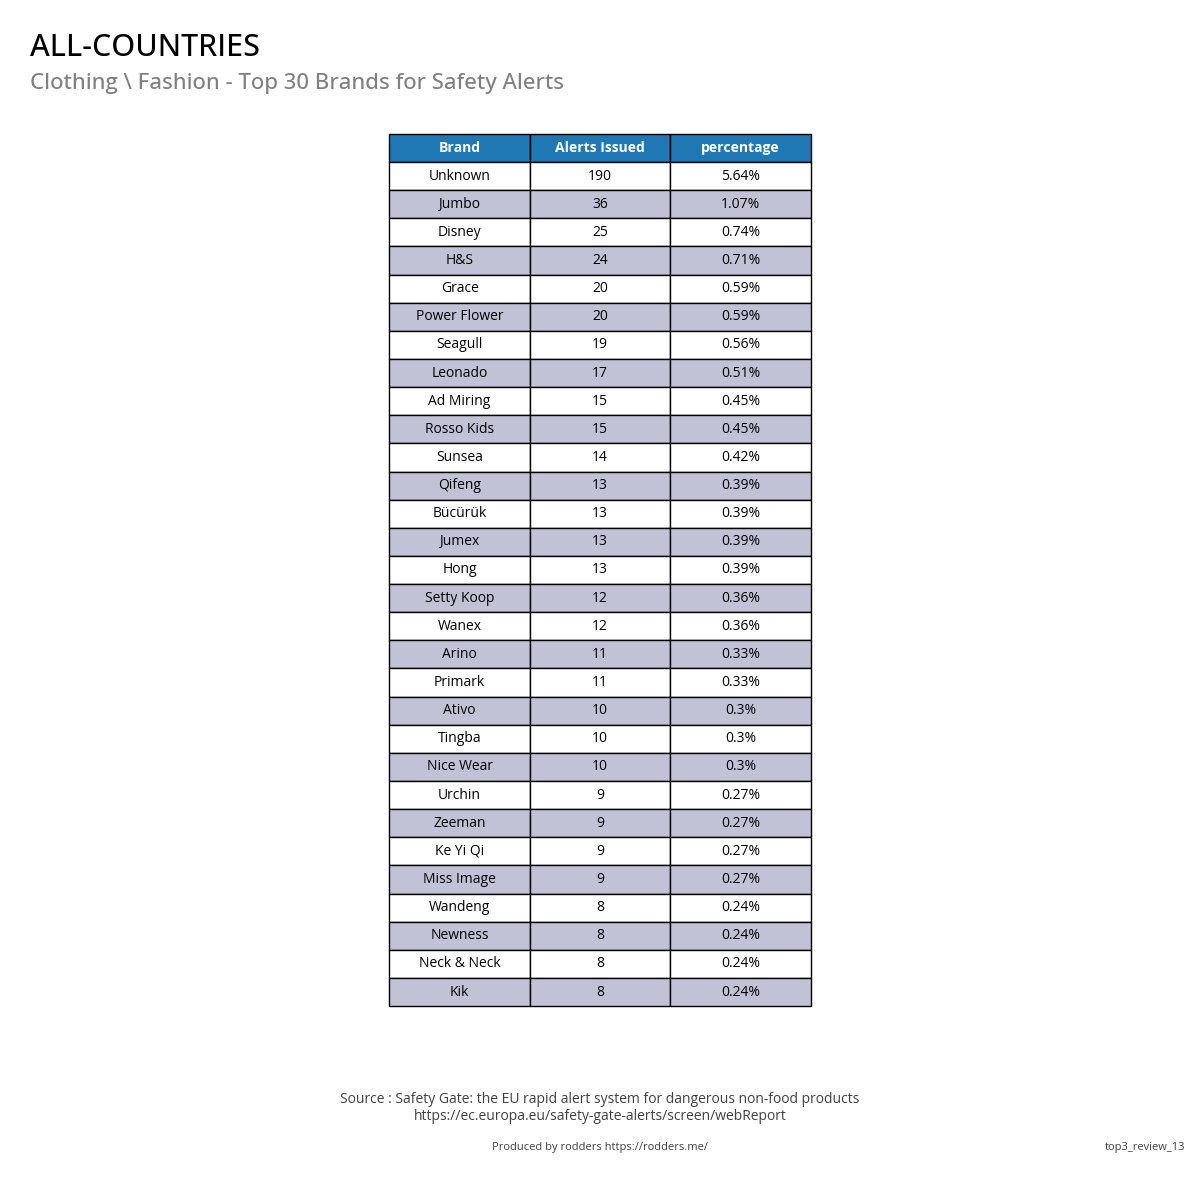
Top 30 Cosmetics Brands for Safety Alerts
| Brand | 2021 | 2022 | 2023 | 2024 |
|---|---|---|---|---|
| Dove | 0 | 0 | 6 | 42 |
| Unknown | 2 | 3 | 33 | 41 |
| Nivea | 0 | 0 | 30 | 32 |
| Garnier | 1 | 0 | 2 | 27 |
| Palmolive | 0 | 0 | 19 | 25 |
| Loreal Paris | 0 | 0 | 11 | 22 |
| Pantene | 0 | 0 | 4 | 16 |
| Schwarzkopf | 0 | 0 | 4 | 15 |
| Fa | 0 | 0 | 1 | 15 |
| Real Time | 0 | 0 | 28 | 14 |
| Malizia | 0 | 0 | 14 | 13 |
| Perlier | 0 | 0 | 1 | 13 |
| Tesori Doriente | 0 | 0 | 19 | 12 |
| Adidas | 0 | 0 | 4 | 12 |
| Jesus Gomez | 0 | 0 | 0 | 12 |
| Neutro Roberts | 0 | 0 | 4 | 12 |
| Bilboa | 0 | 0 | 3 | 12 |
| New Brand | 0 | 0 | 6 | 11 |
| Dorall Collection | 0 | 0 | 8 | 11 |
| Playboy | 0 | 0 | 2 | 10 |
| Sunsilk | 0 | 0 | 6 | 9 |
| Vidal | 0 | 0 | 9 | 9 |
| Creation Lamis | 0 | 0 | 6 | 9 |
| Matrix | 0 | 0 | 0 | 8 |
| Testanera | 0 | 0 | 1 | 8 |
| Setablu | 0 | 0 | 1 | 8 |
| Italiequali | 0 | 0 | 0 | 7 |
| Gordano Parfums | 0 | 0 | 17 | 7 |
| Orchidea Profumi | 0 | 0 | 0 | 7 |
| Infasil | 0 | 0 | 6 | 7 |
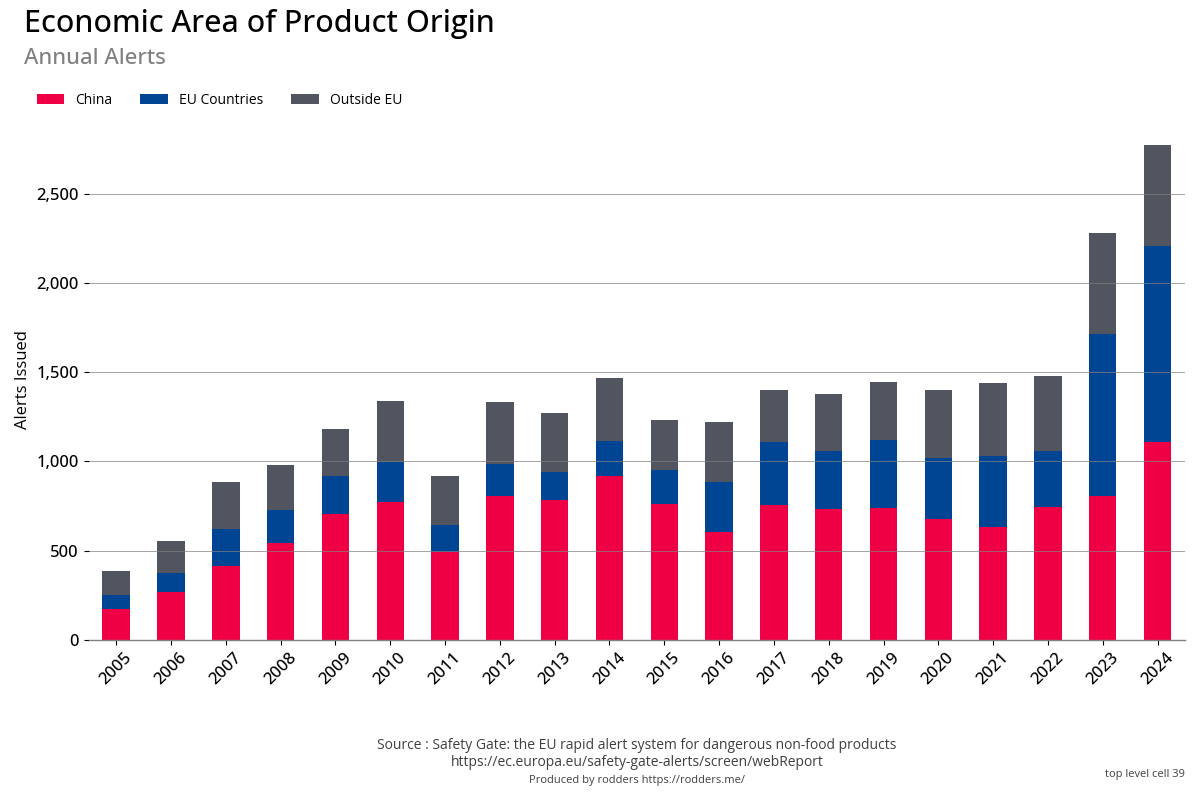
Which countries' products get the most alerts?
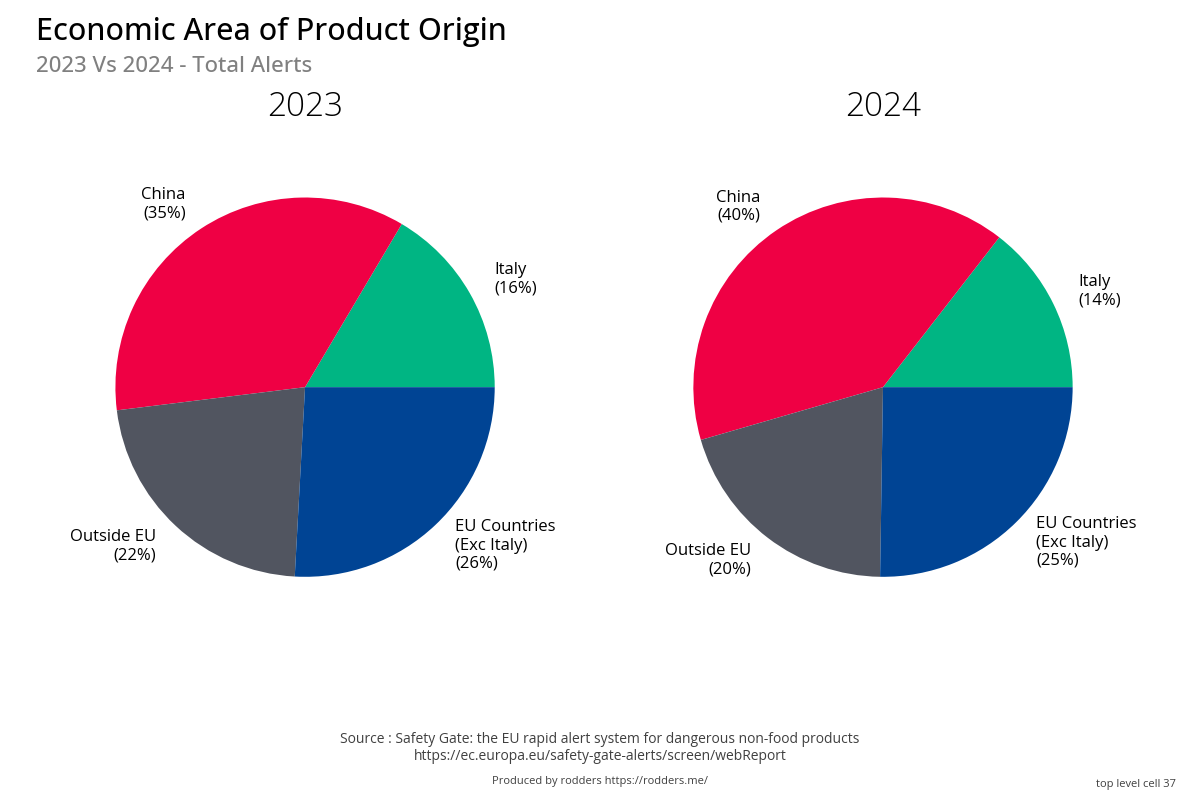
The following visualisations show theEconomic Area of Product Origin with categories defined as:
EU Countrieswithin Schengen or European Economic Area (Ex Italy for visibility of 2023 alerts)Italy- Italy represents around 15% of all alerts issued in 2023 and is highlighted for the 2023 exceptionOutside EU- Every other country not within the Eu CountriesChina- China represents a large proportion of Global Trade
Economic Area of Product origin Annual Alerts
Economic Area of Product origin - Previous Year Vs Current Year
Italy has been highlighted to show the significant number of alerts issued against cosmetics manufactured in Italy.
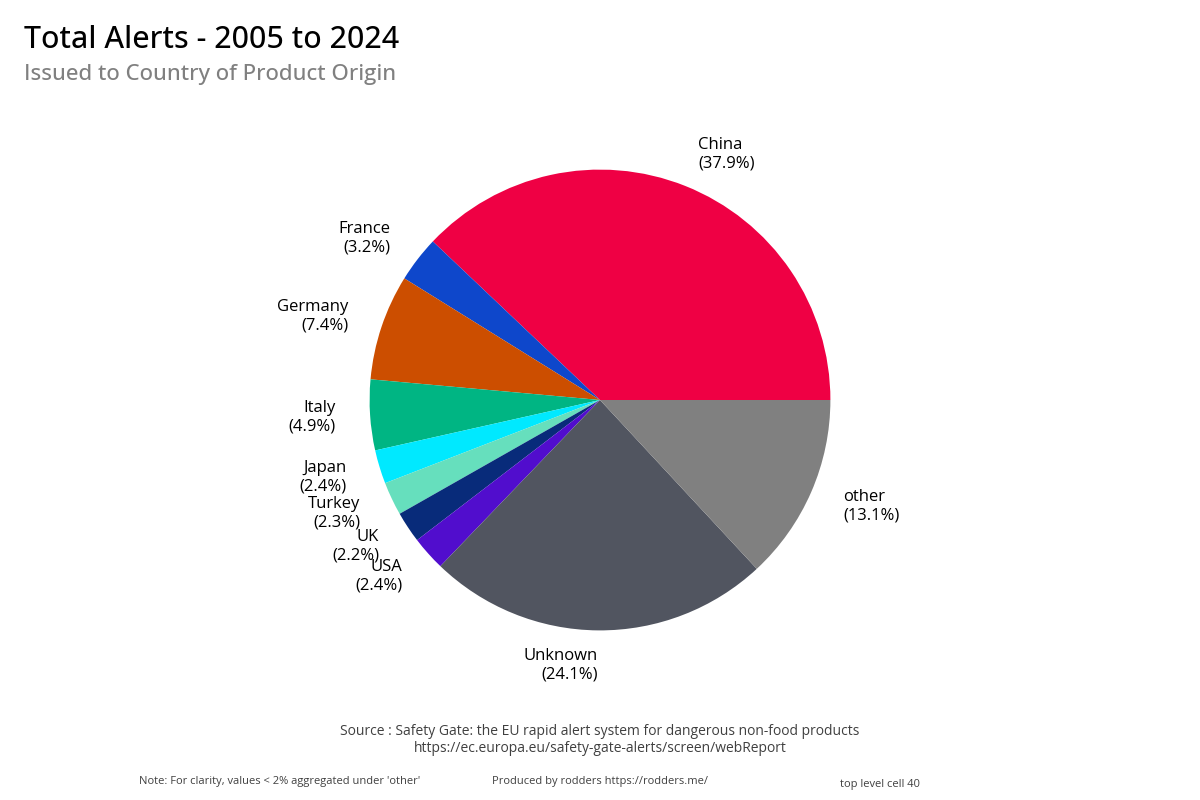
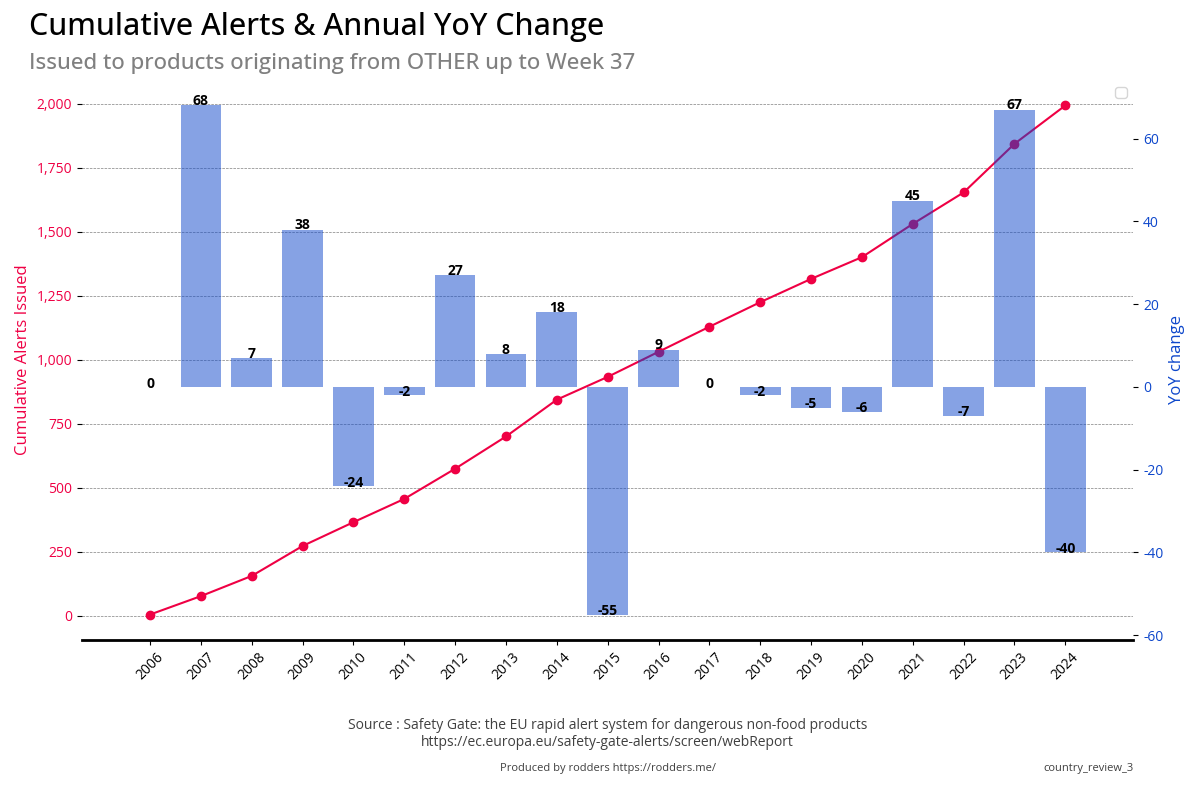
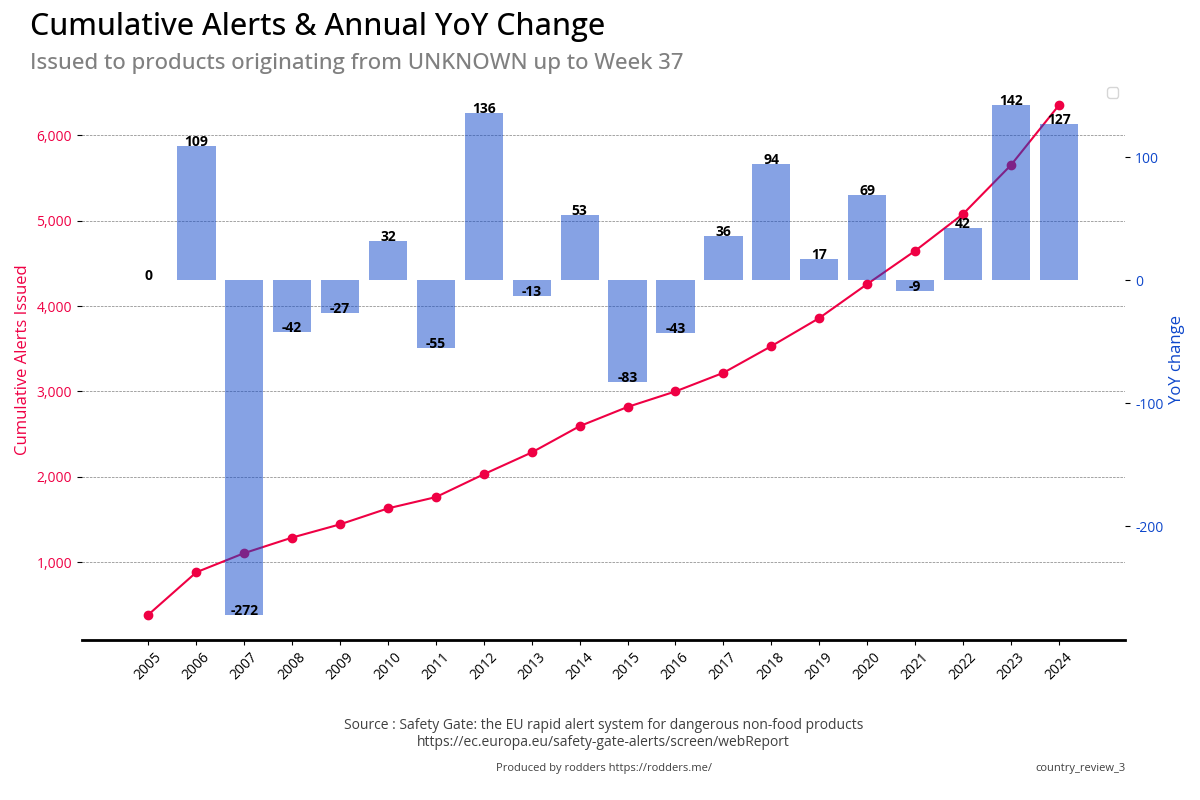
Country of Product Origin
Within the Top 15 countries are two entries :
other Where the country isn't in the top 15, and represents 2,933 products or 8.4% of the total
Unknown Where the reporting member didn't record the country of origin, and represents 9,173
products, or 25.8% of the total Alerts issuedPrevious Year Vs Current Year
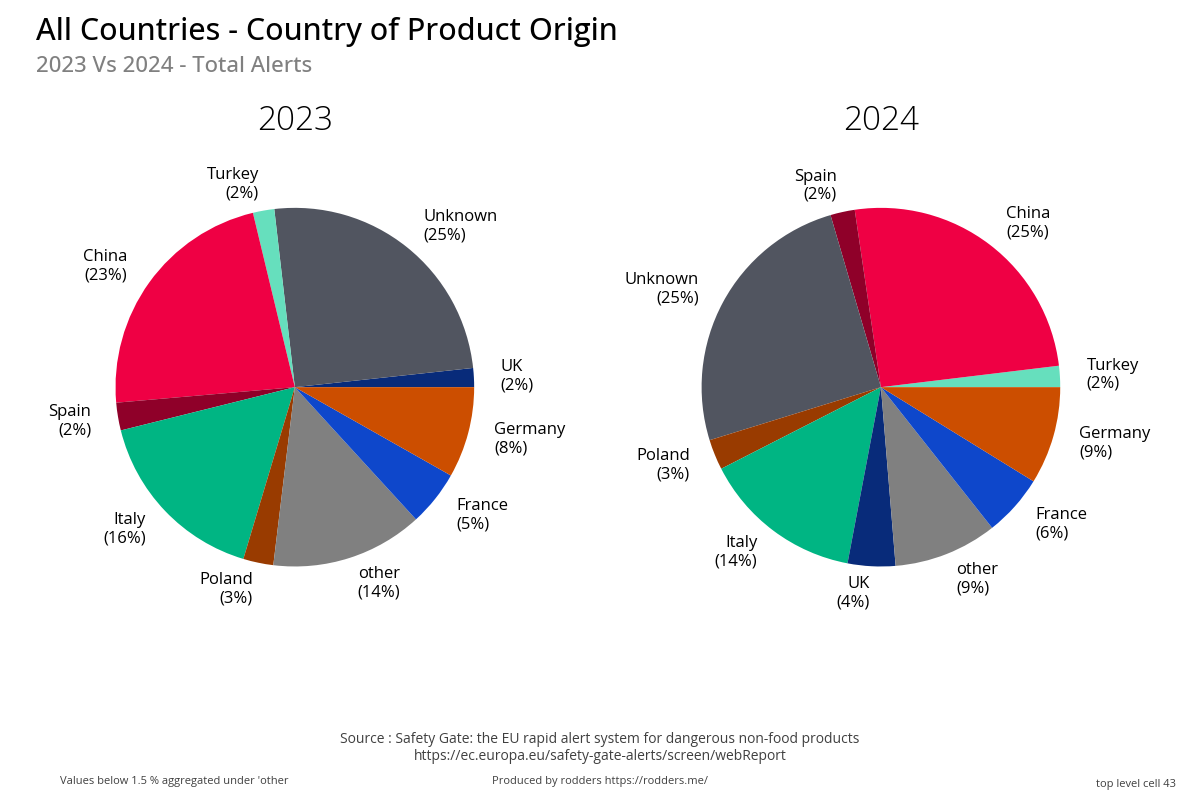
Annual Alerts
| All Countries | Excluding Unknown |
|---|---|
|
|
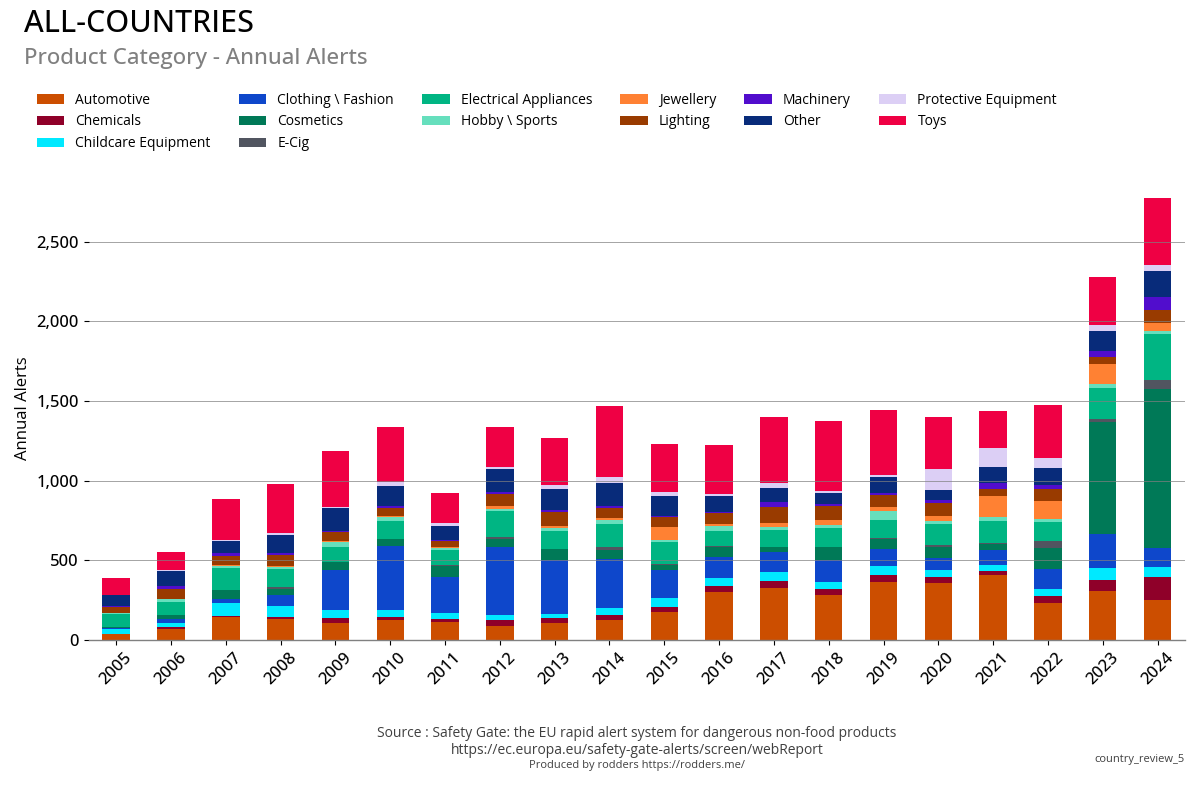
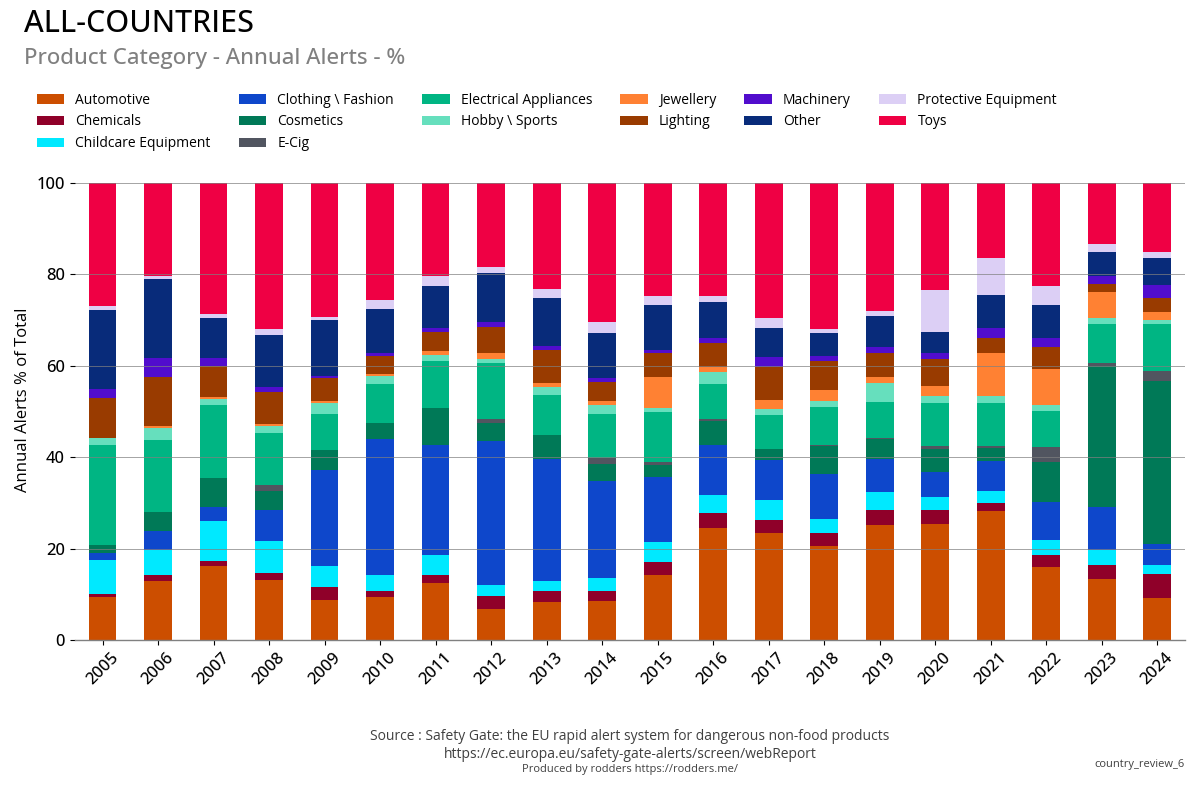
Product Categories
Previous Year Vs Current Year
Total & Annual Alerts
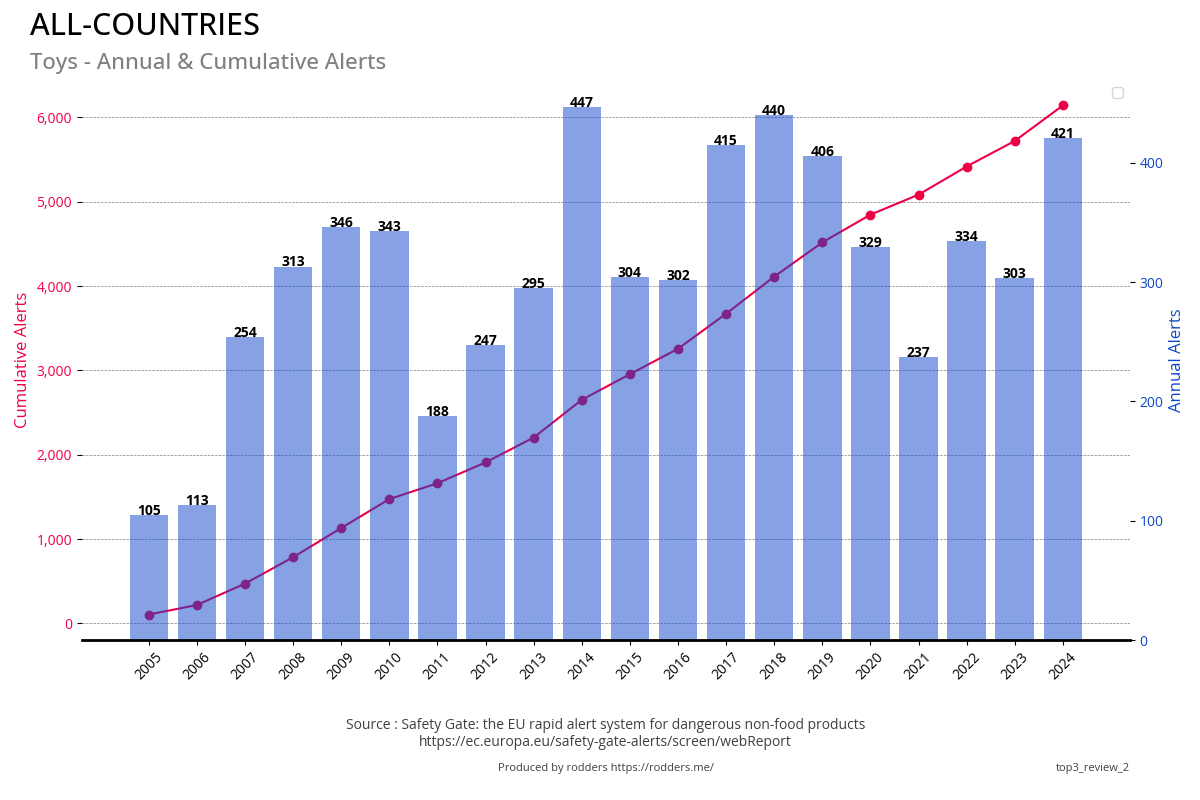
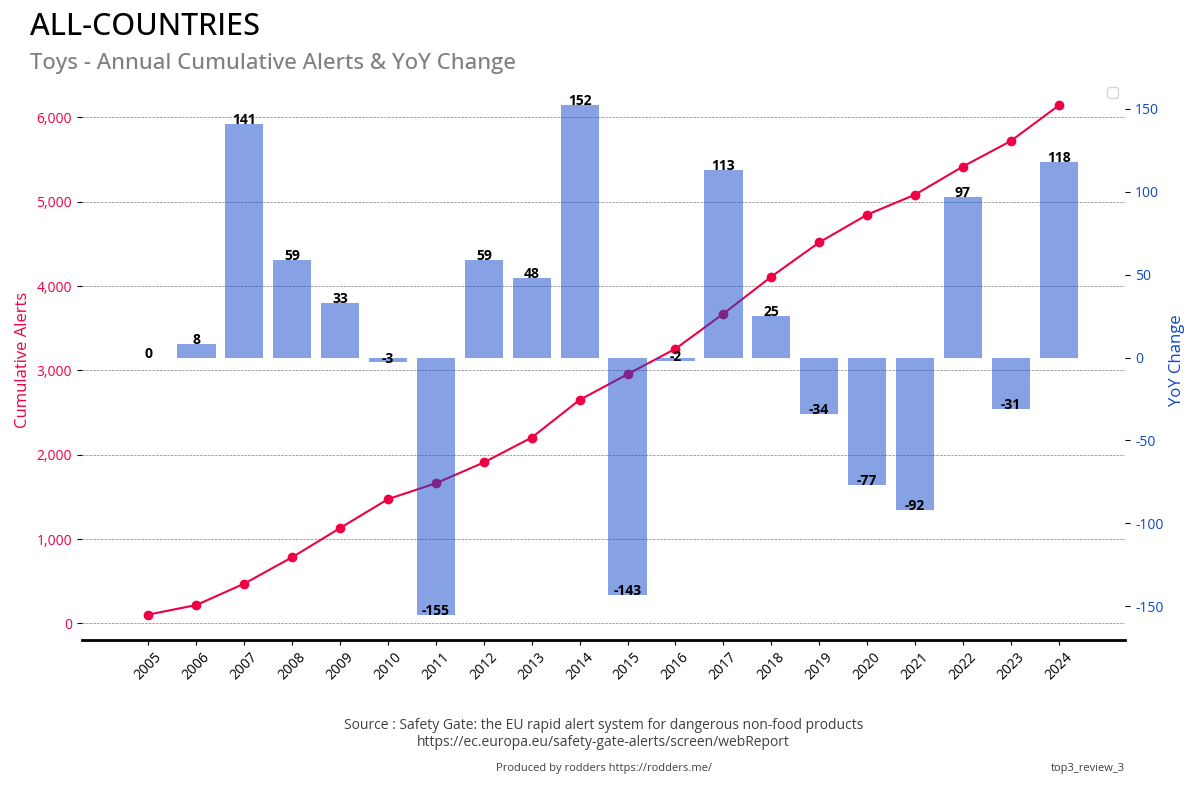
Over the last few years the Toys and Automotive categories are generally those with the most safety alerts.
The exception being 2023 where cosmetics took the top spot with 32% of all alerts issued being for cosmetic products.
| Annual Count | Annual Percent of Total |
|---|---|
|
|
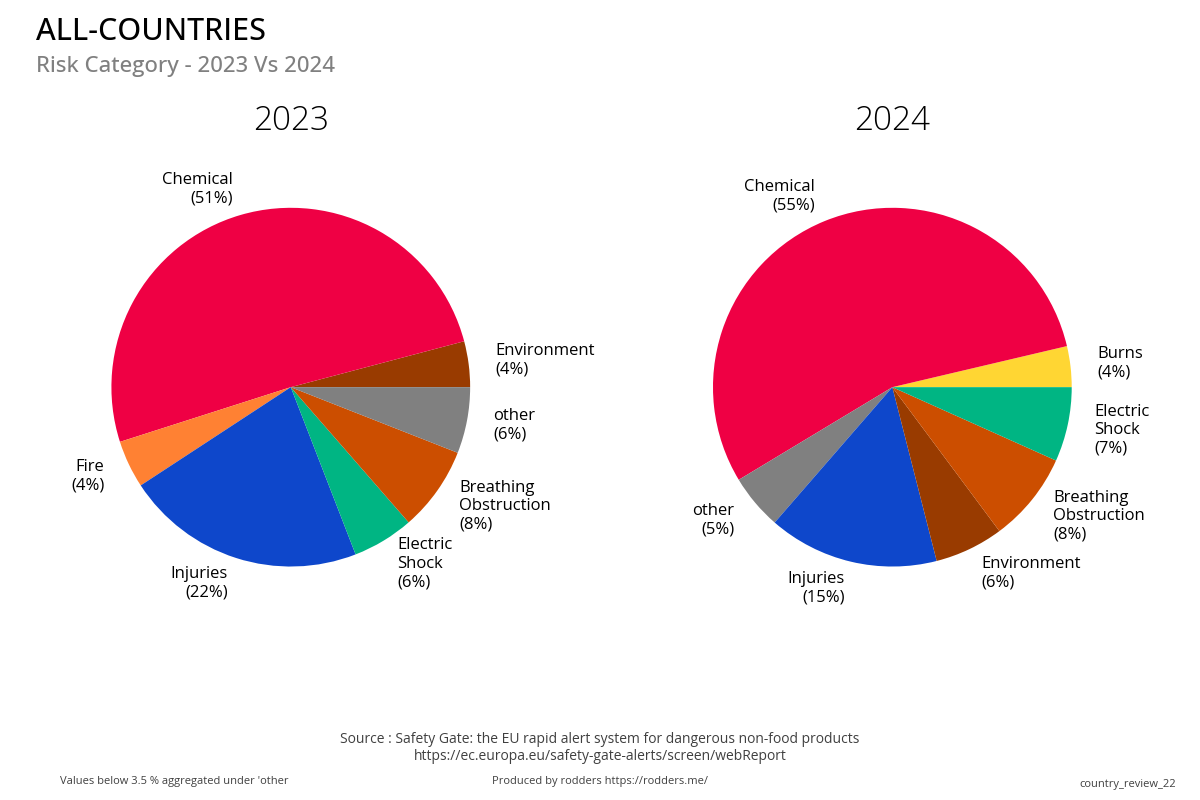
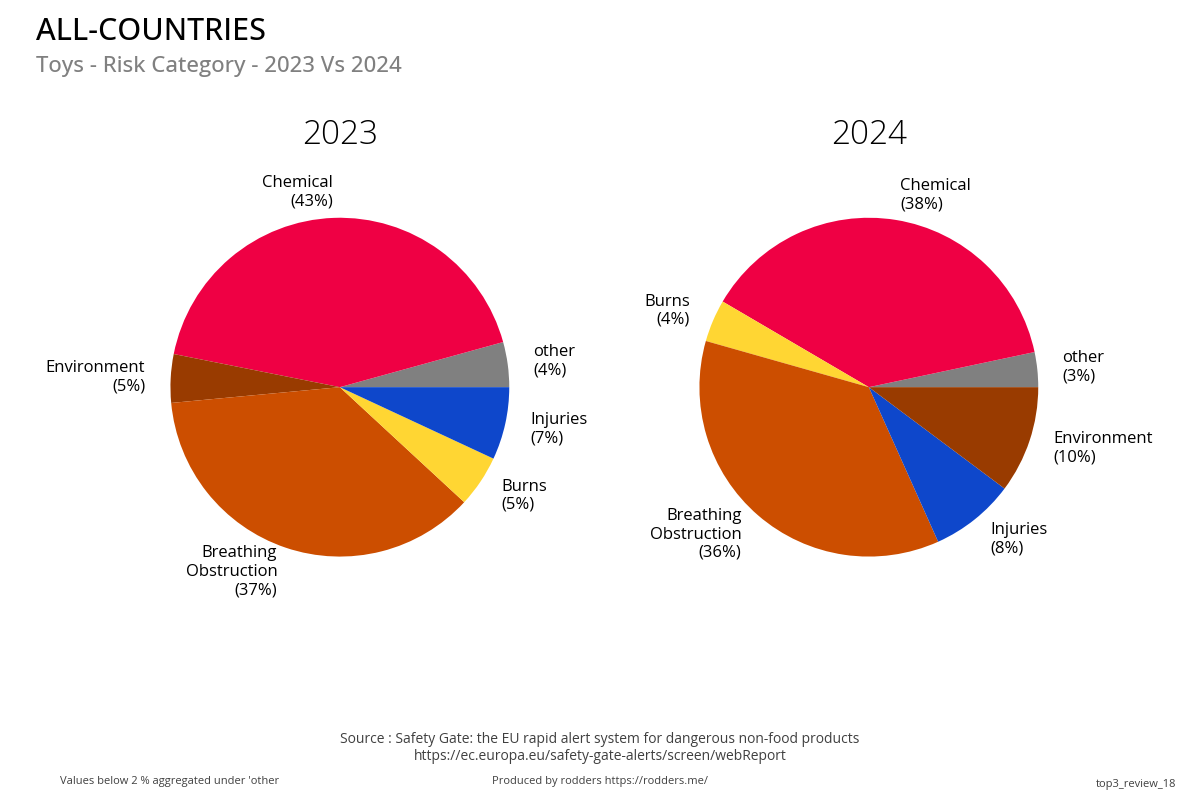
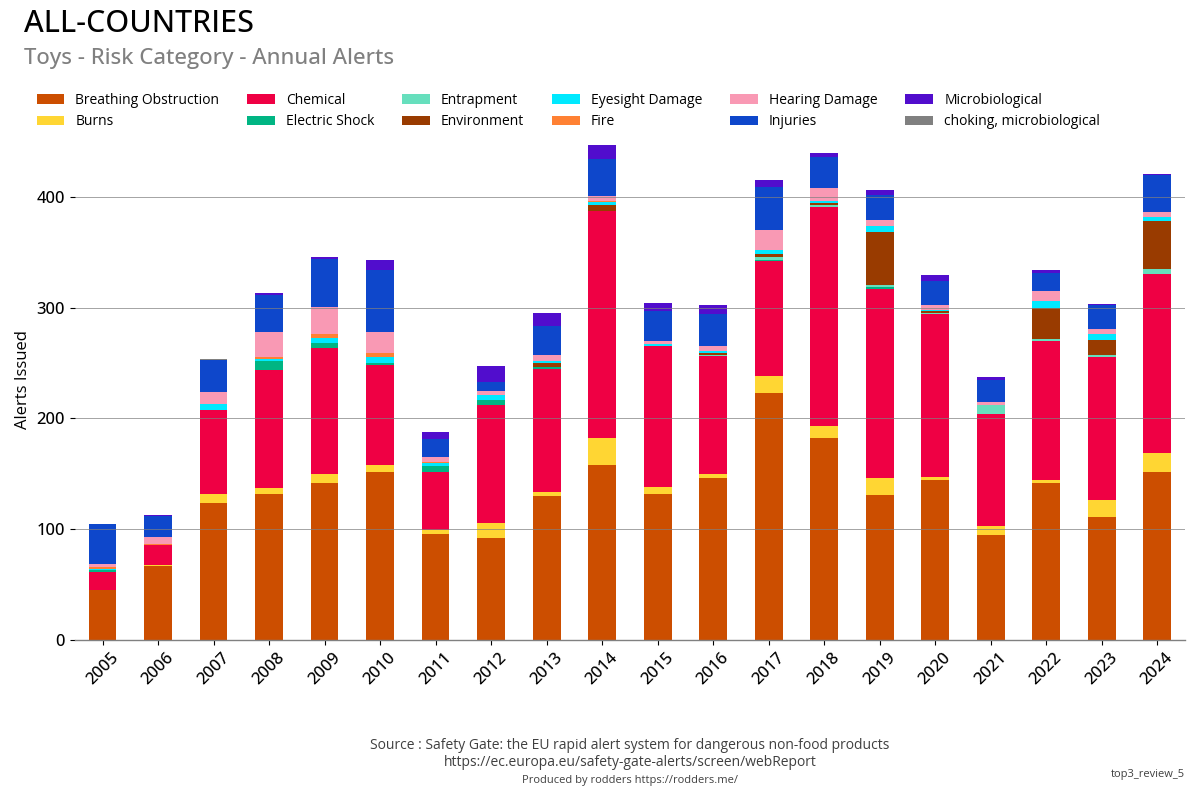
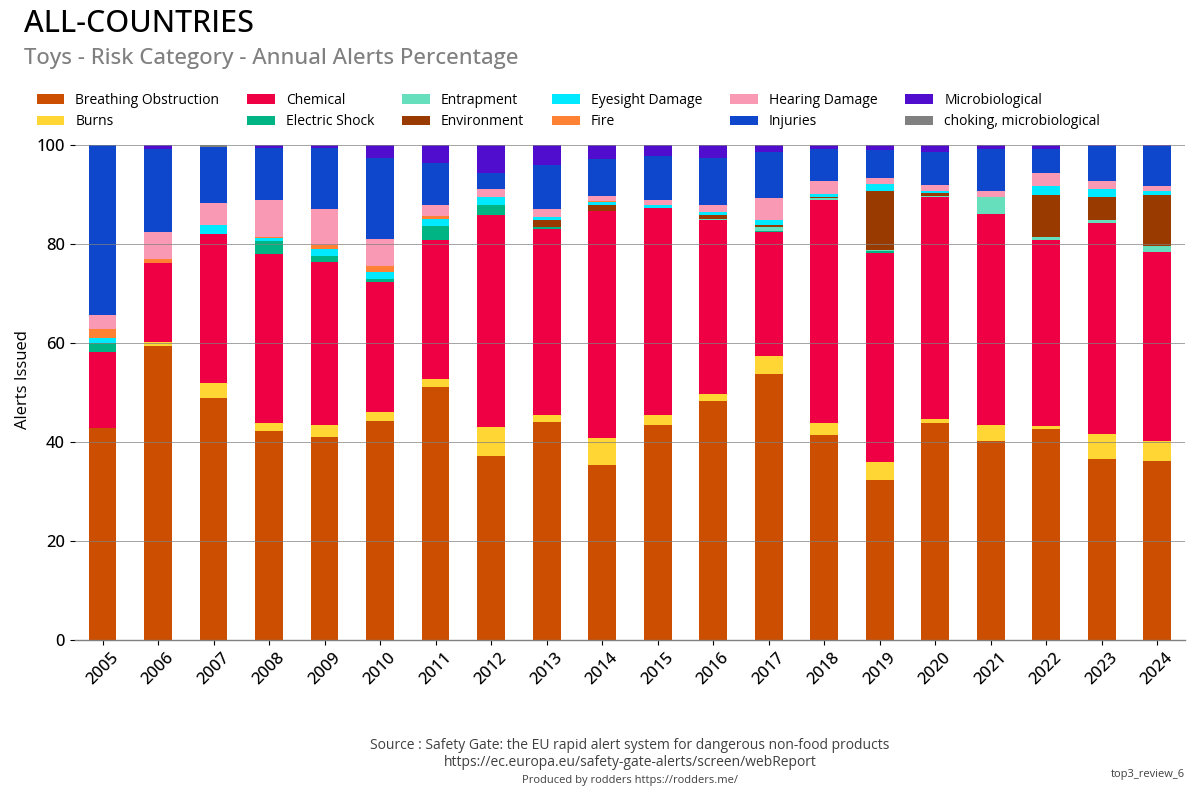
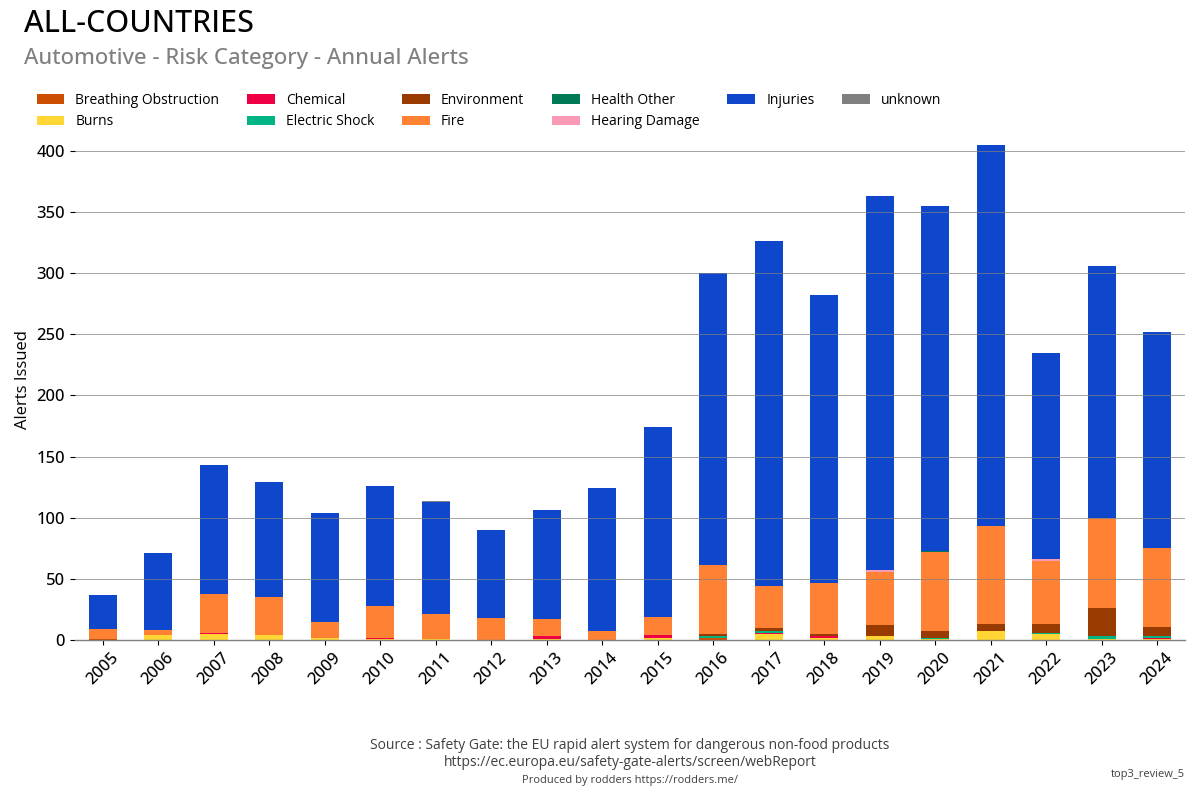
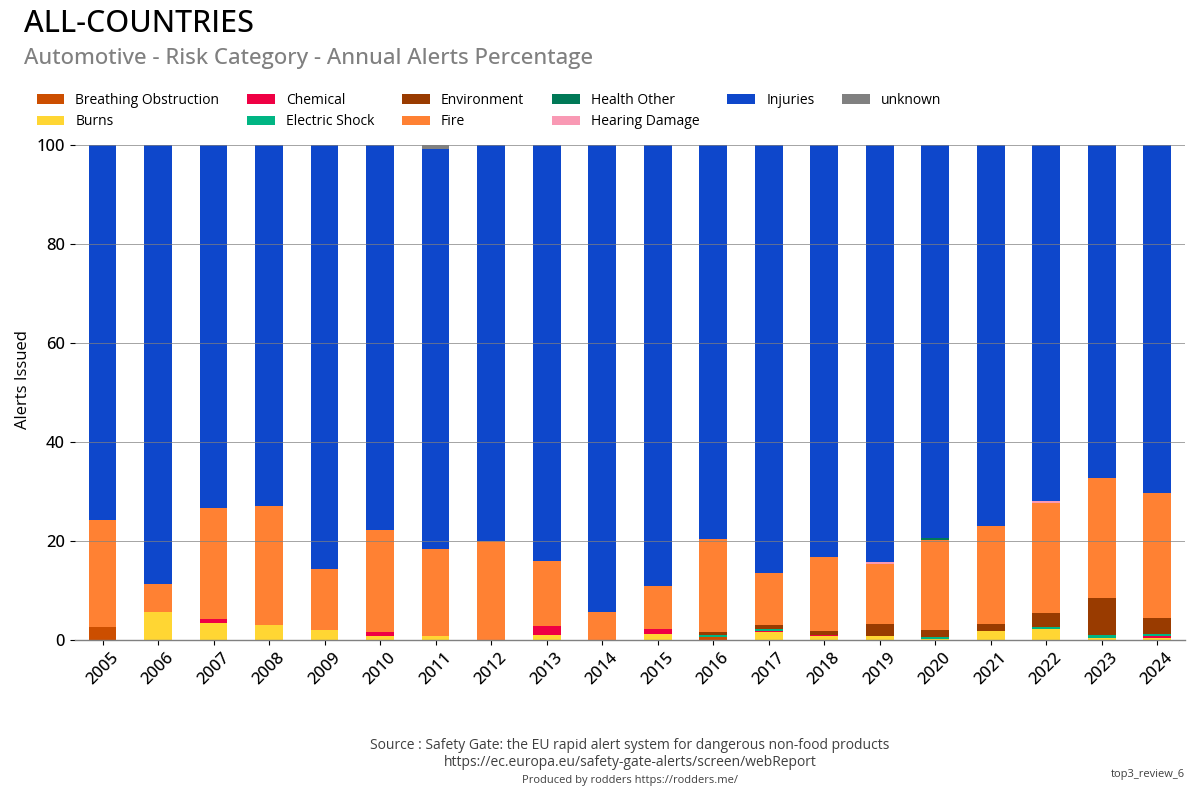
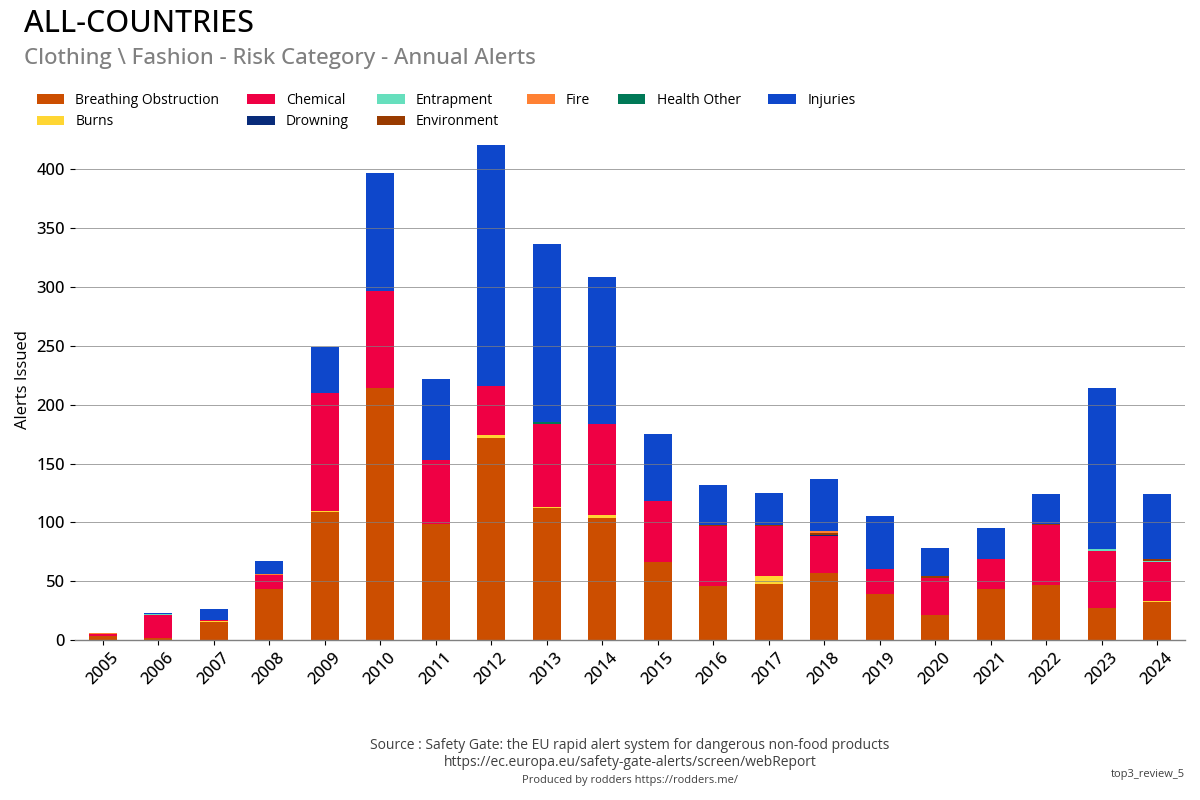
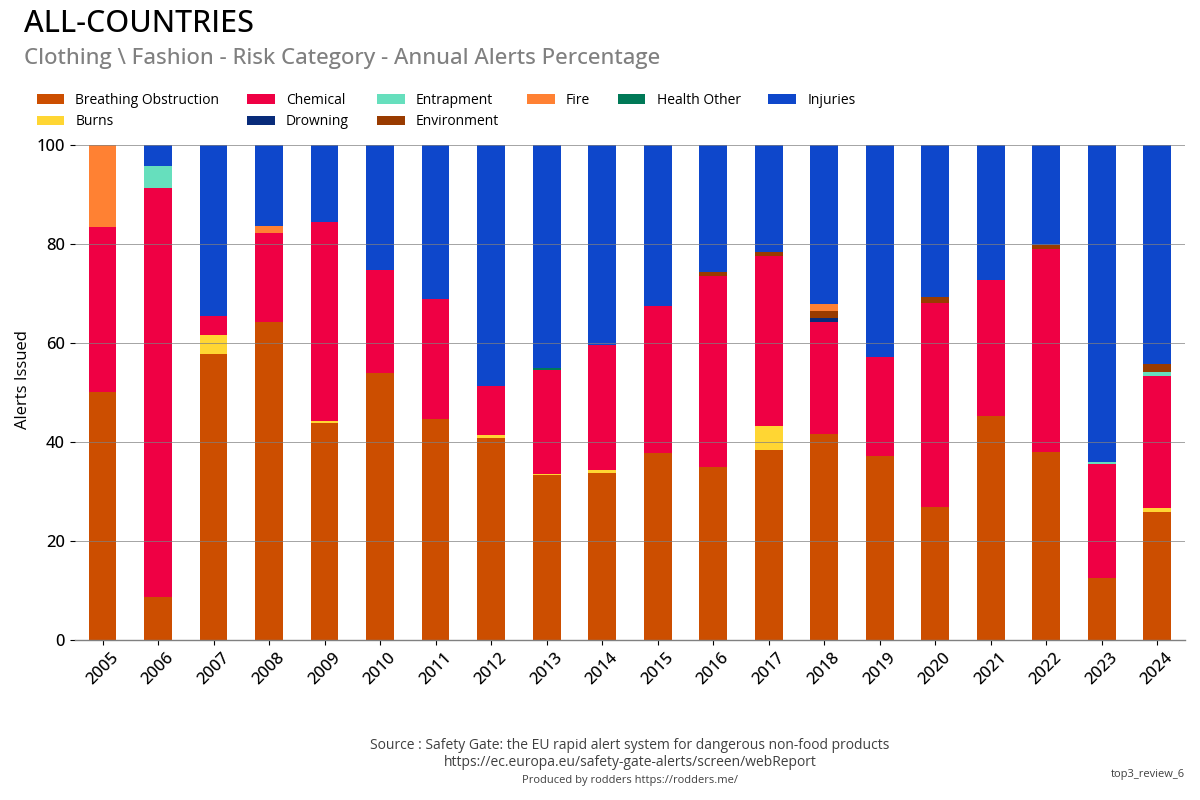
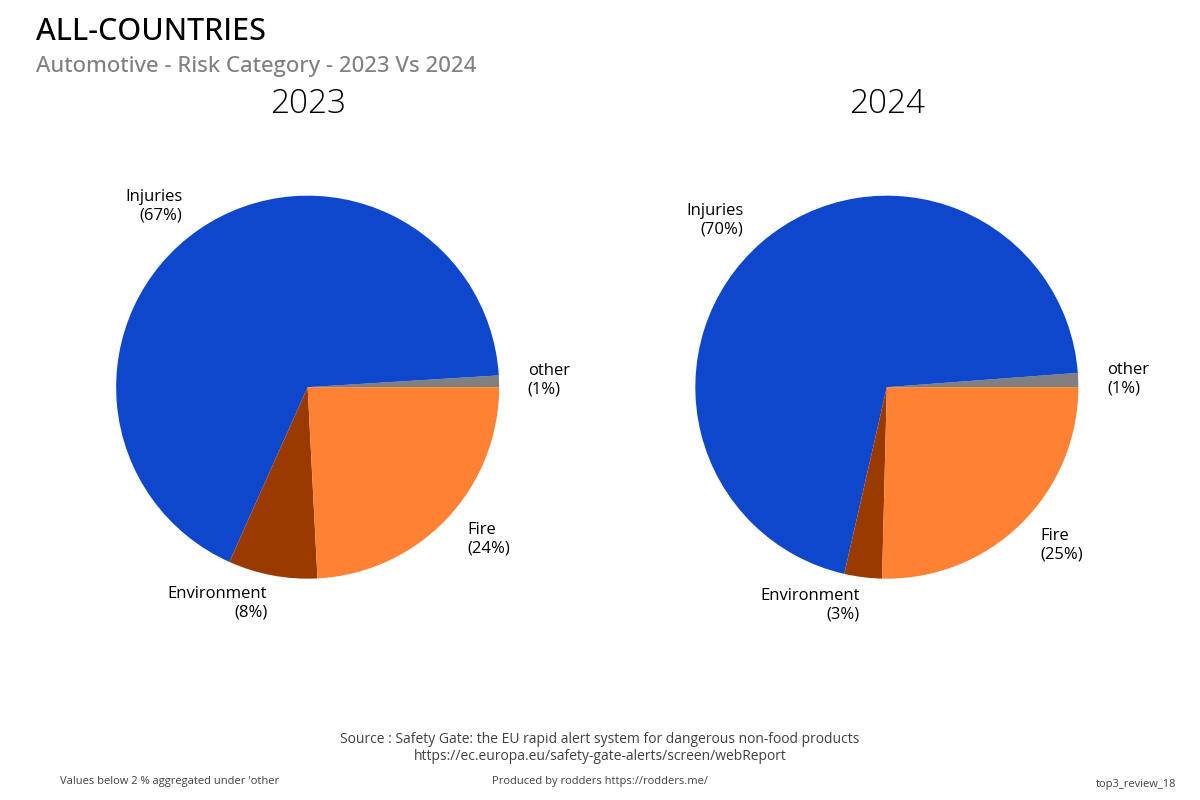
Risk Category
- The majority of Injury risks come from the automotive product category (9.7% of 2022/2023 total)
- The majority of risks from Toys are breathing obstruction (7% of total) and chemical (7% of total)
- As previously noted the cosmetics risk is from the recent ban of BMHCA
Previous Year Vs Current Year
Total & Annual Alerts
| Annual Count | Annual Percent of Total |
|---|---|
 |
|
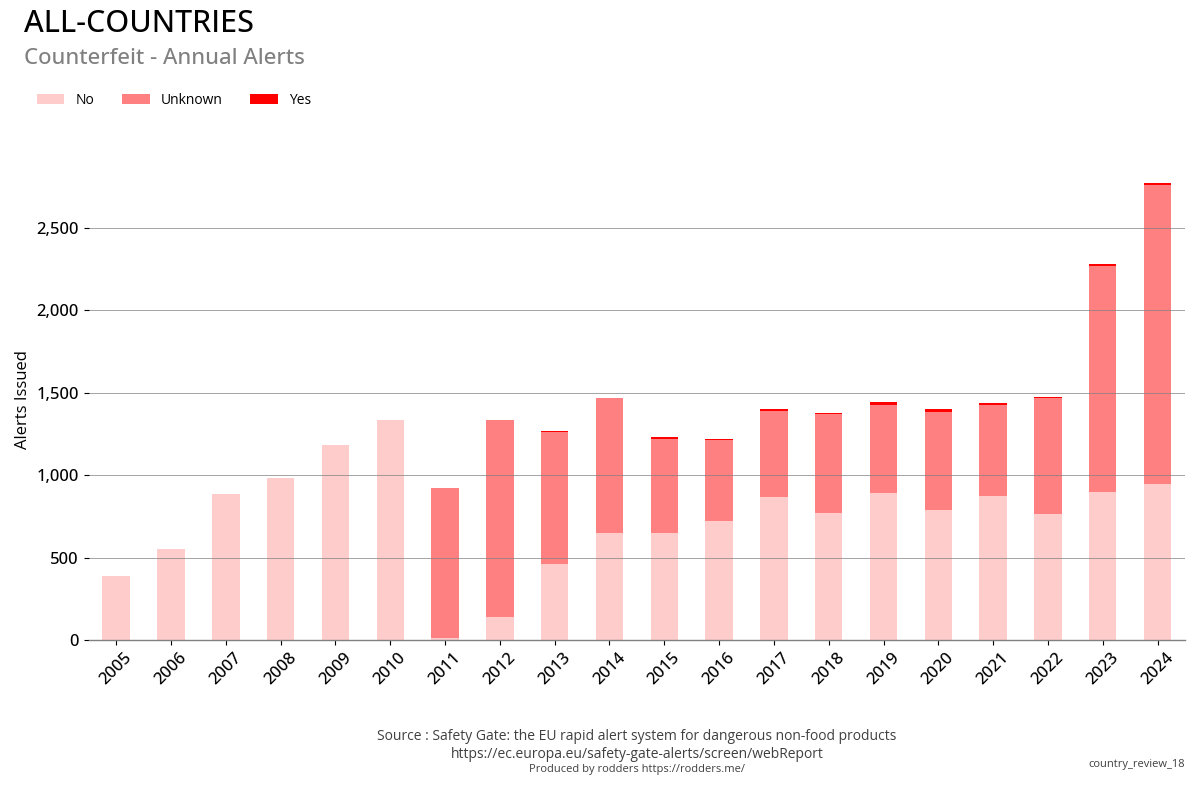
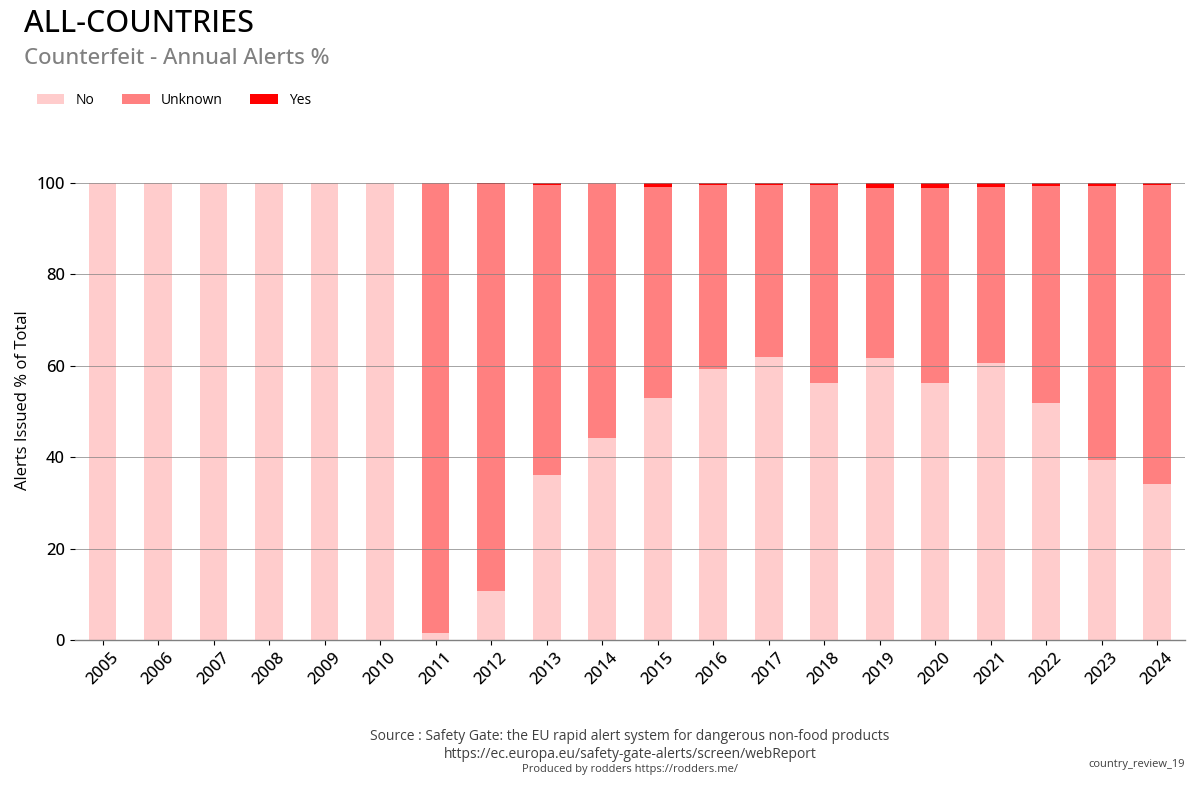
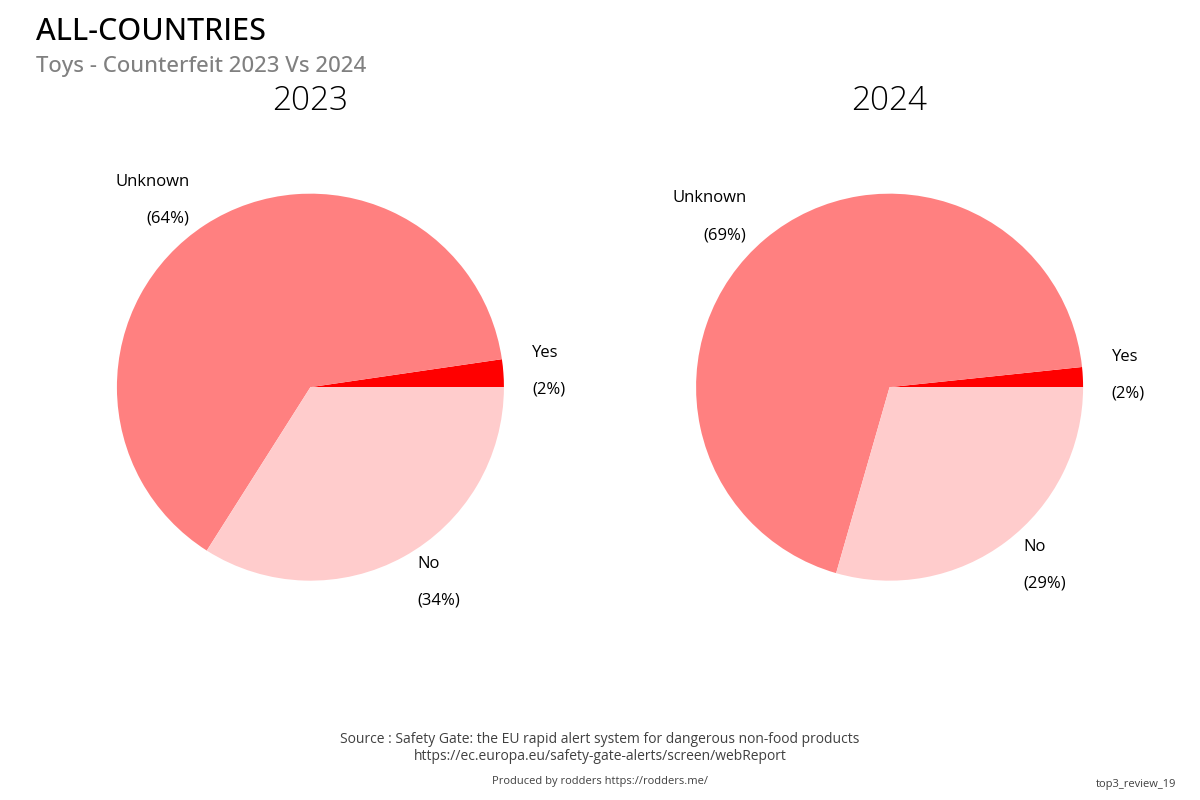
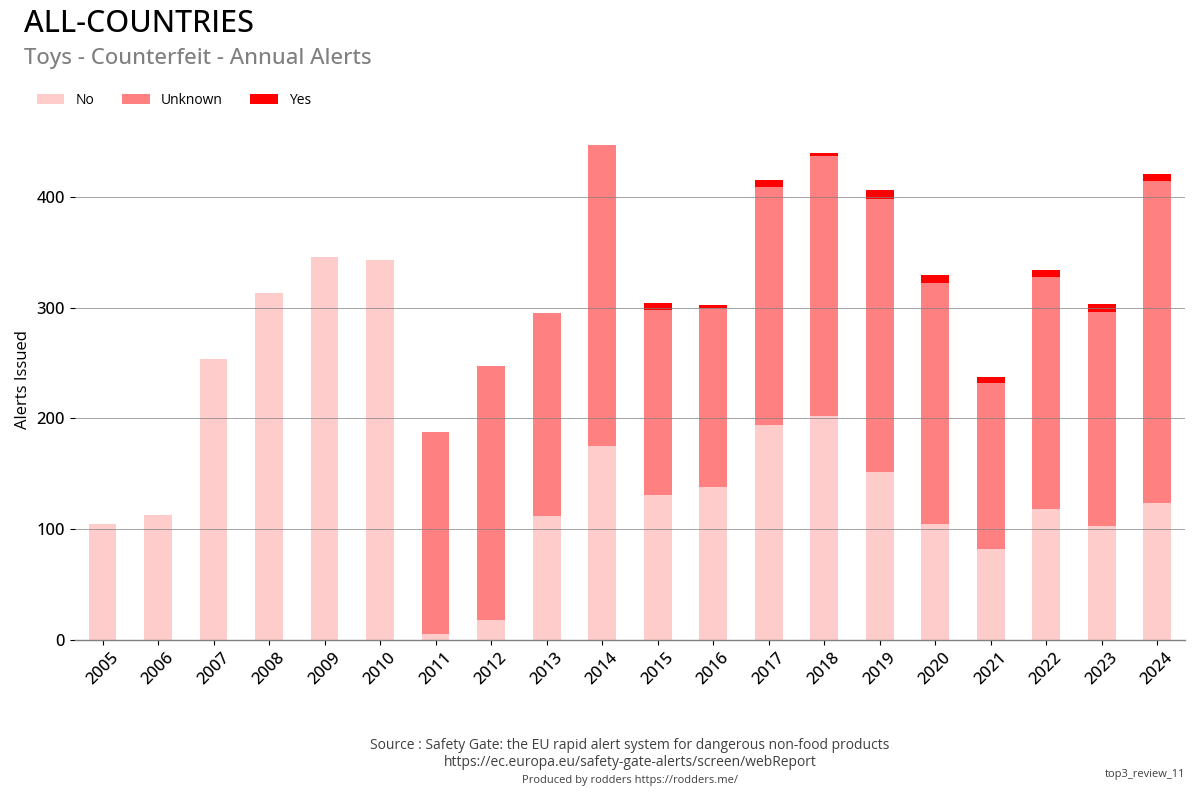
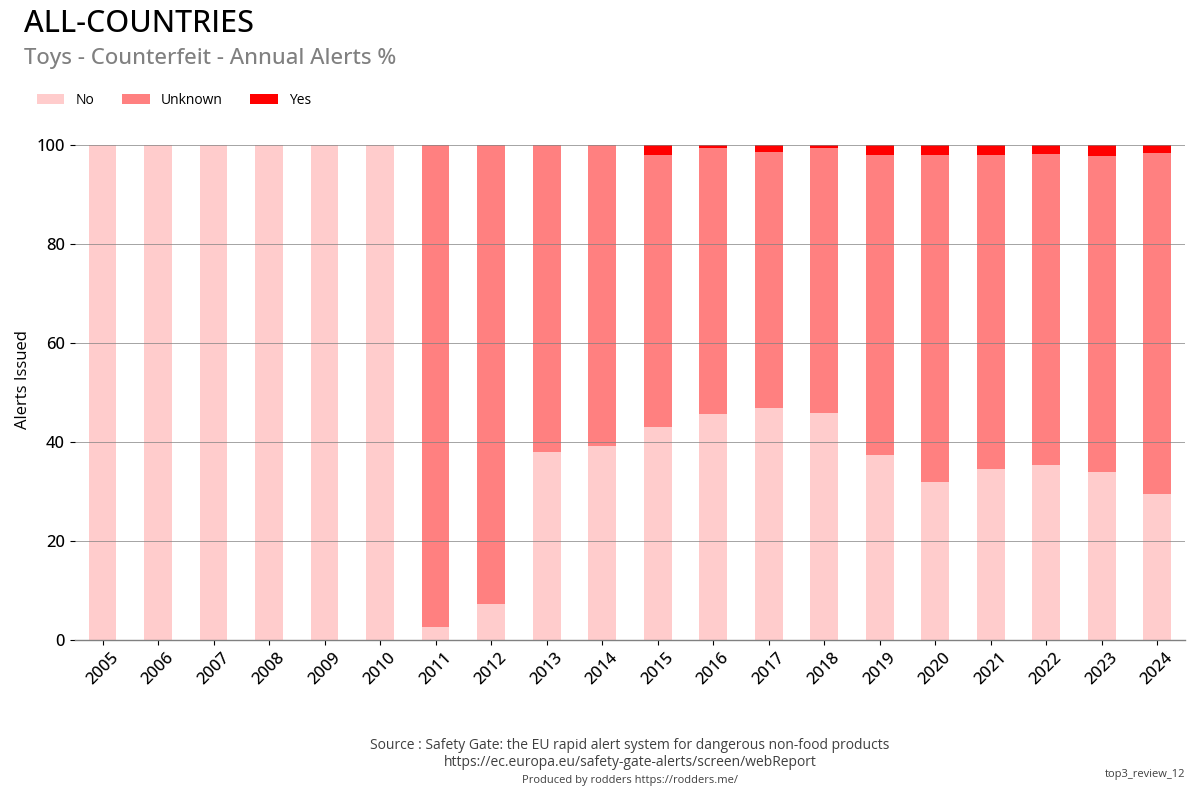
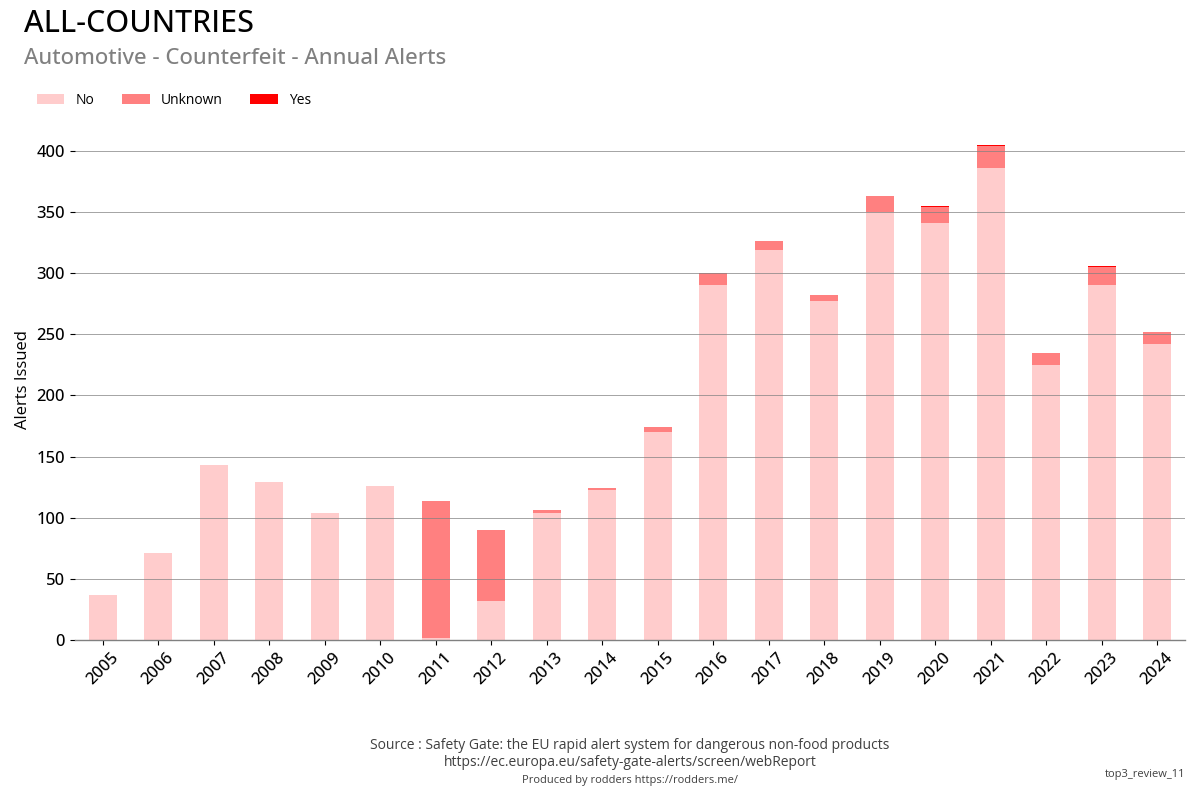
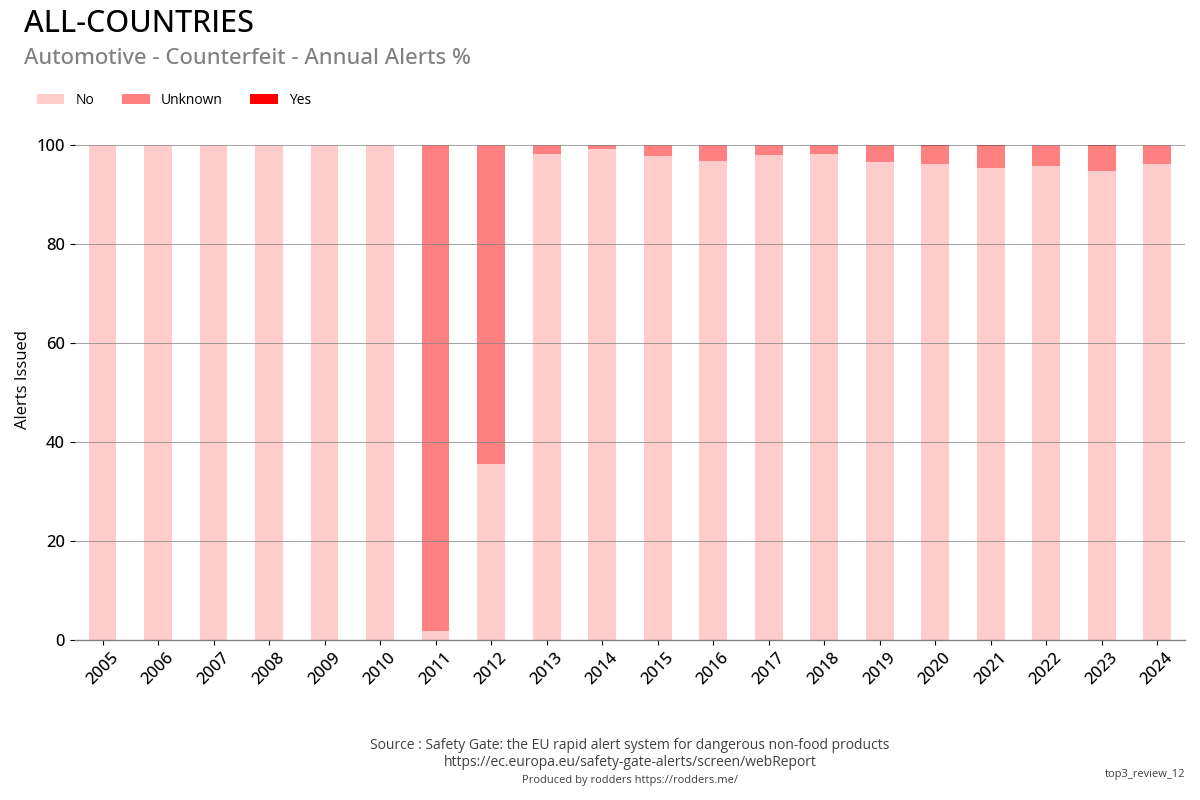
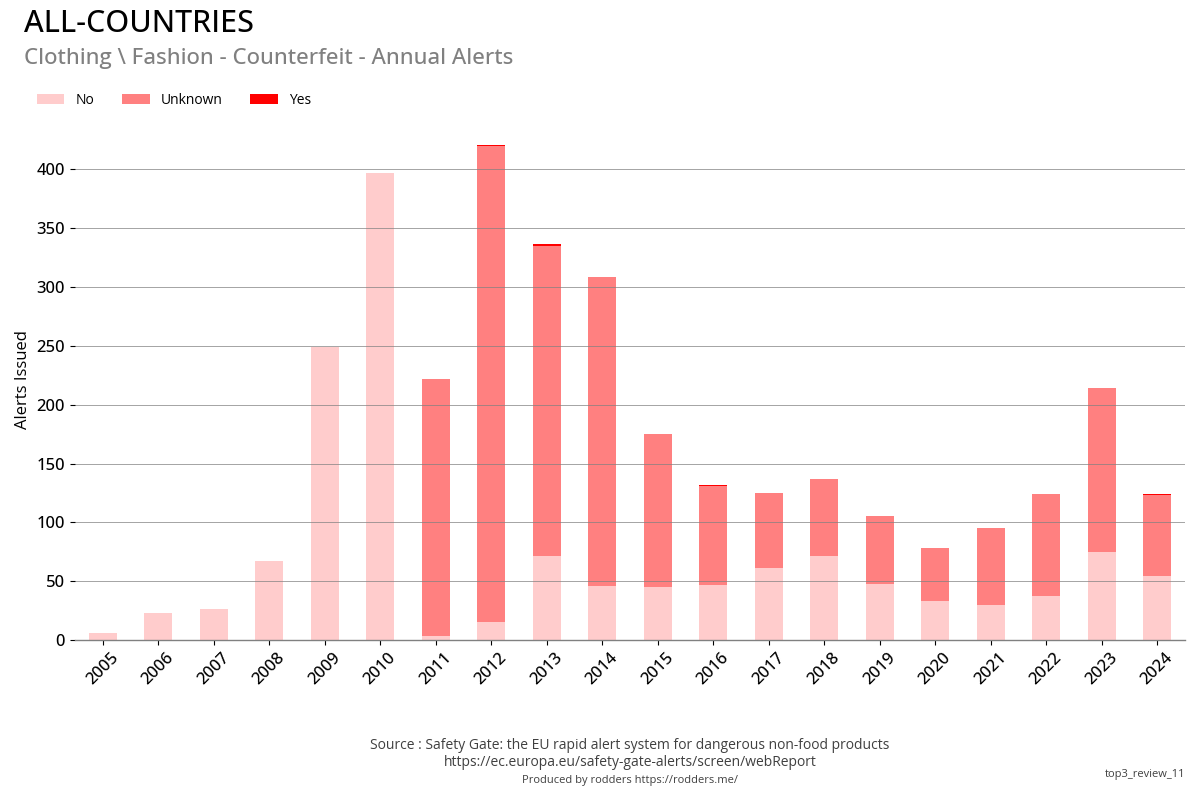
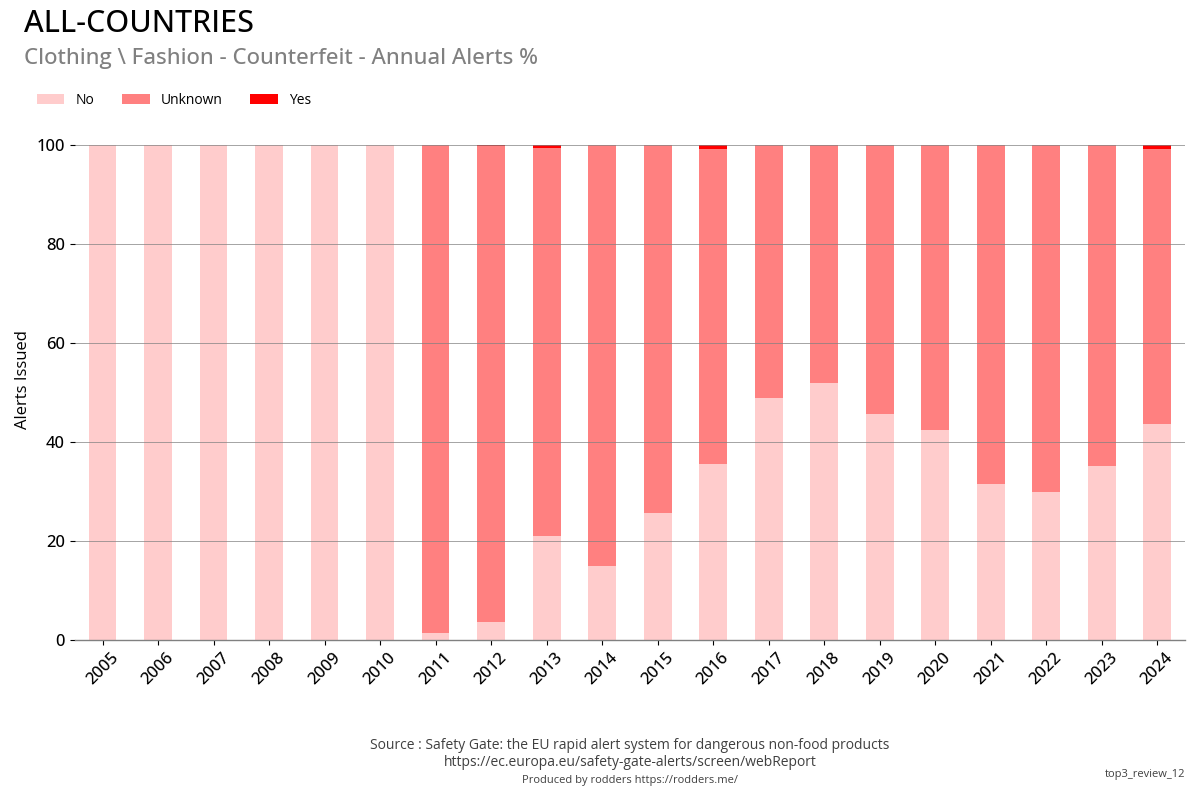
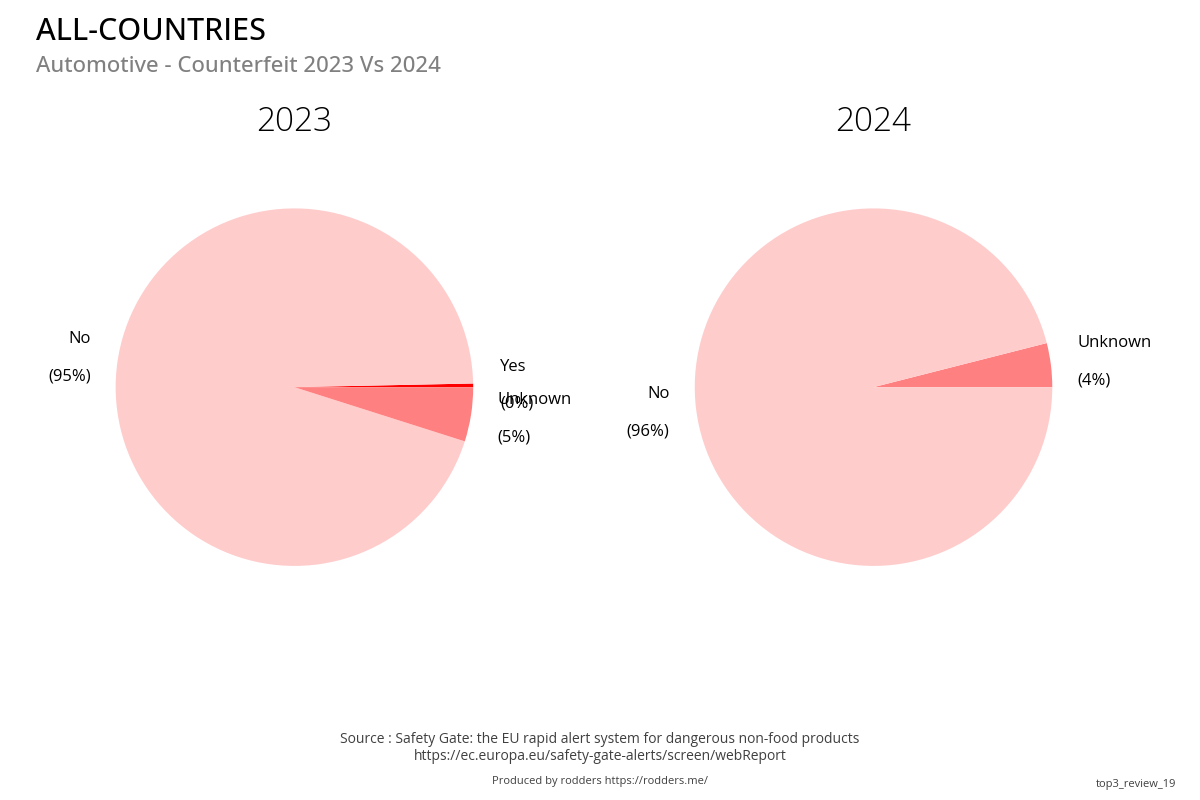
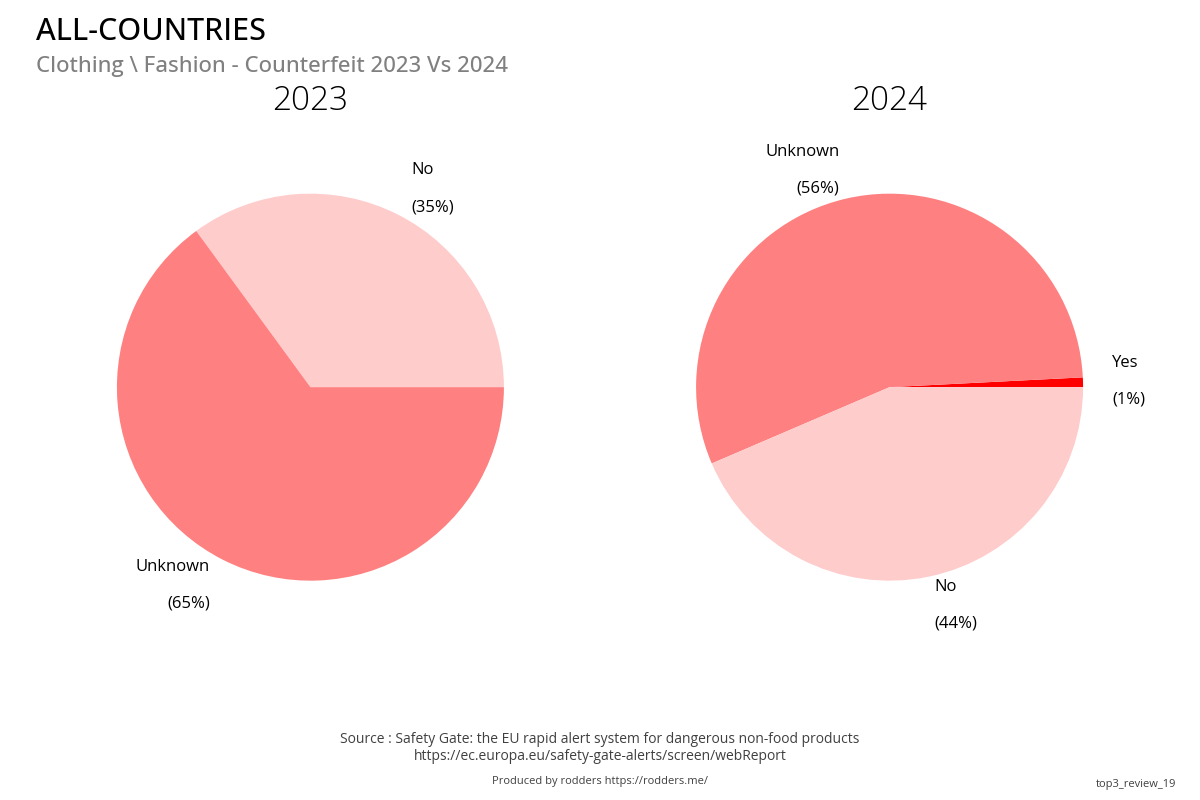
Counterfeit type
Previous Year Vs Current Year
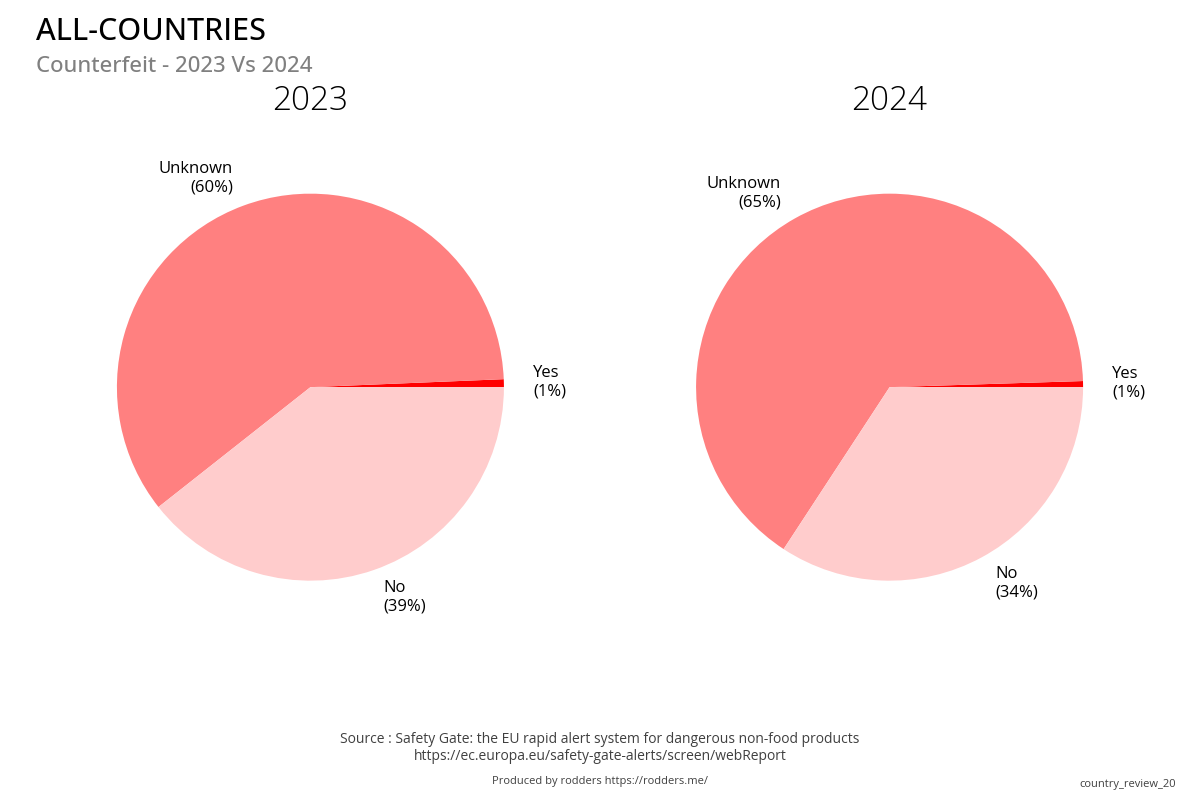
Total & Annual Alerts
| Annual Count | Annual Percent of Total |
|---|---|
|
|
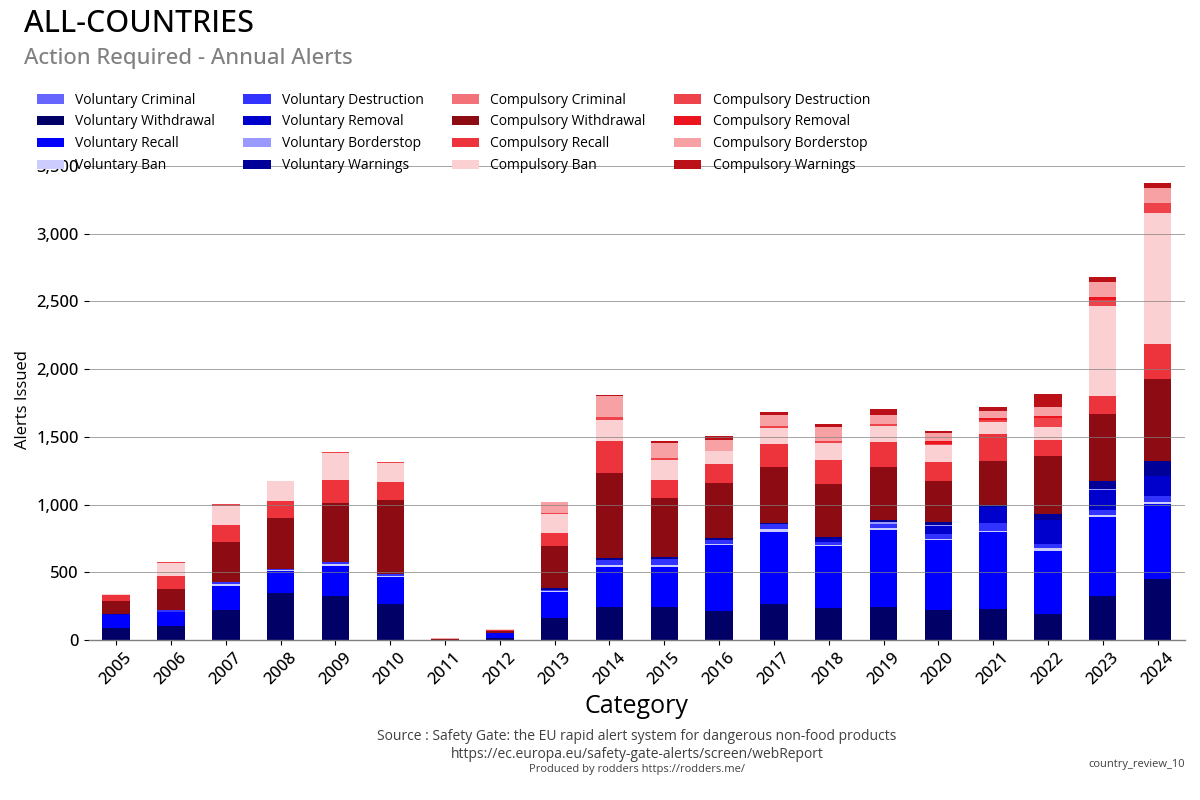
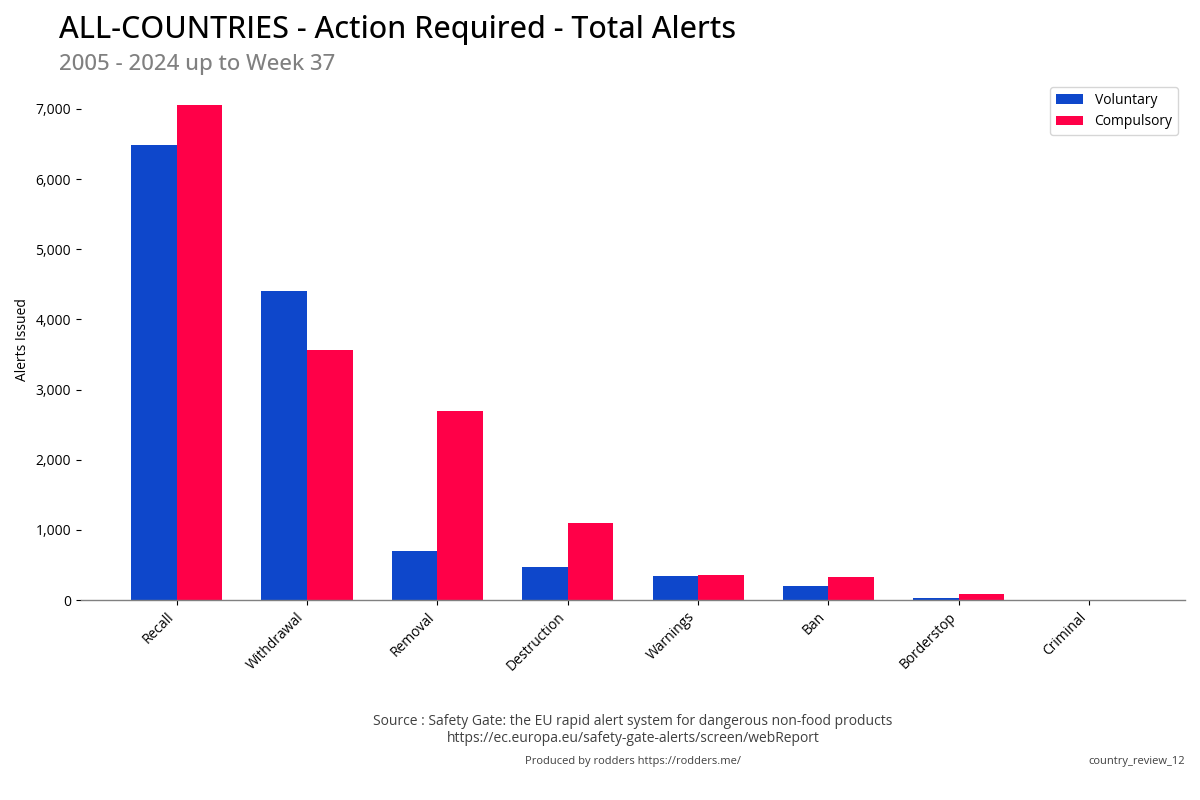
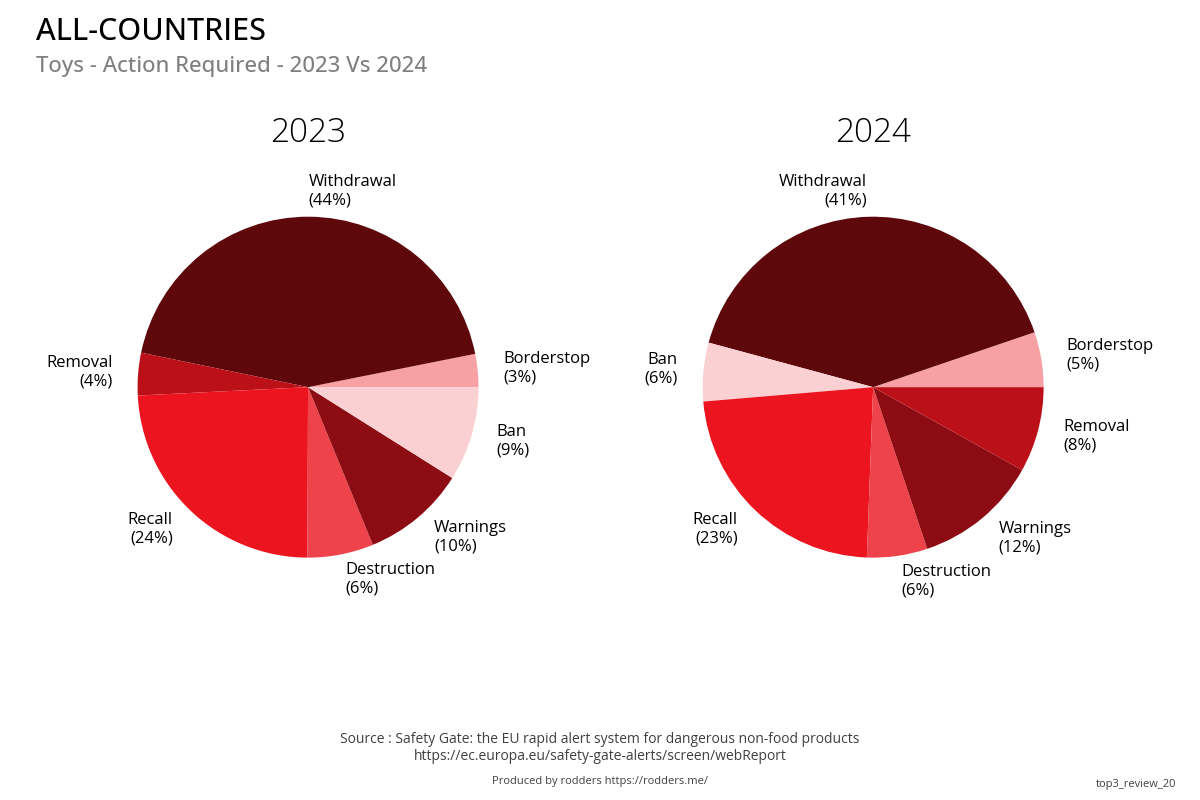
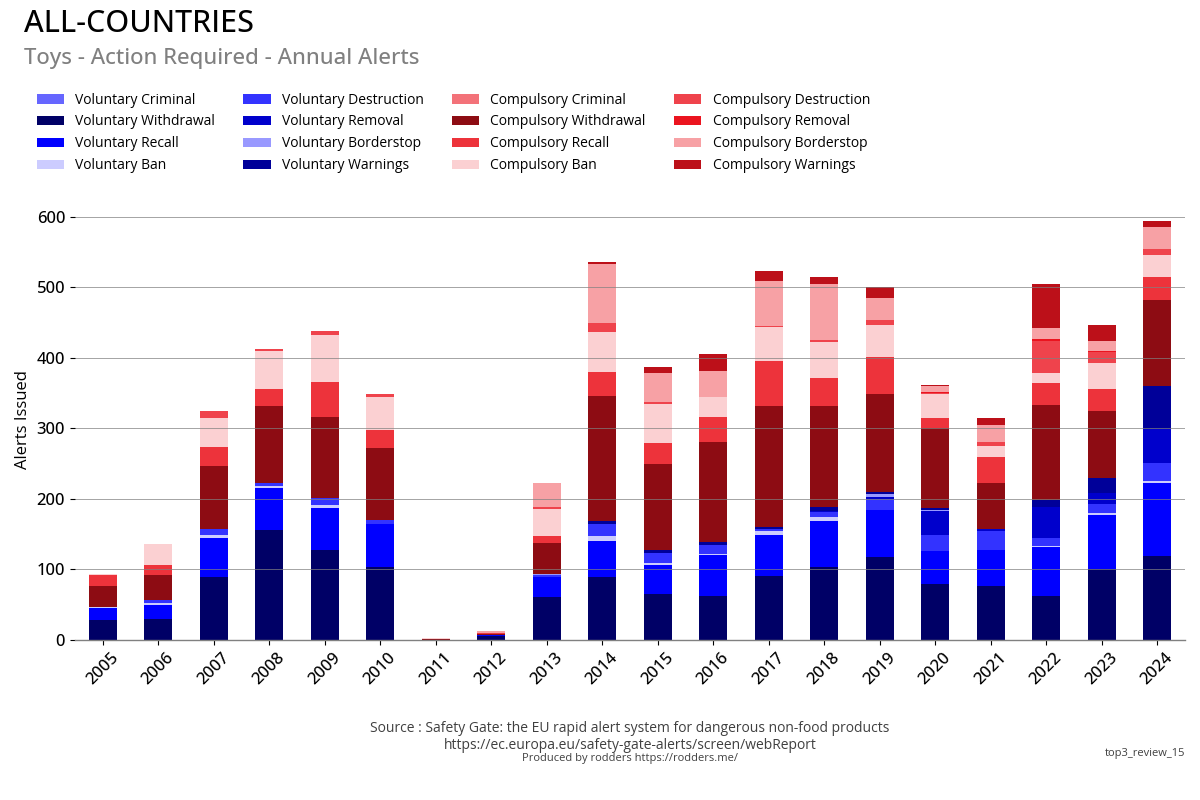
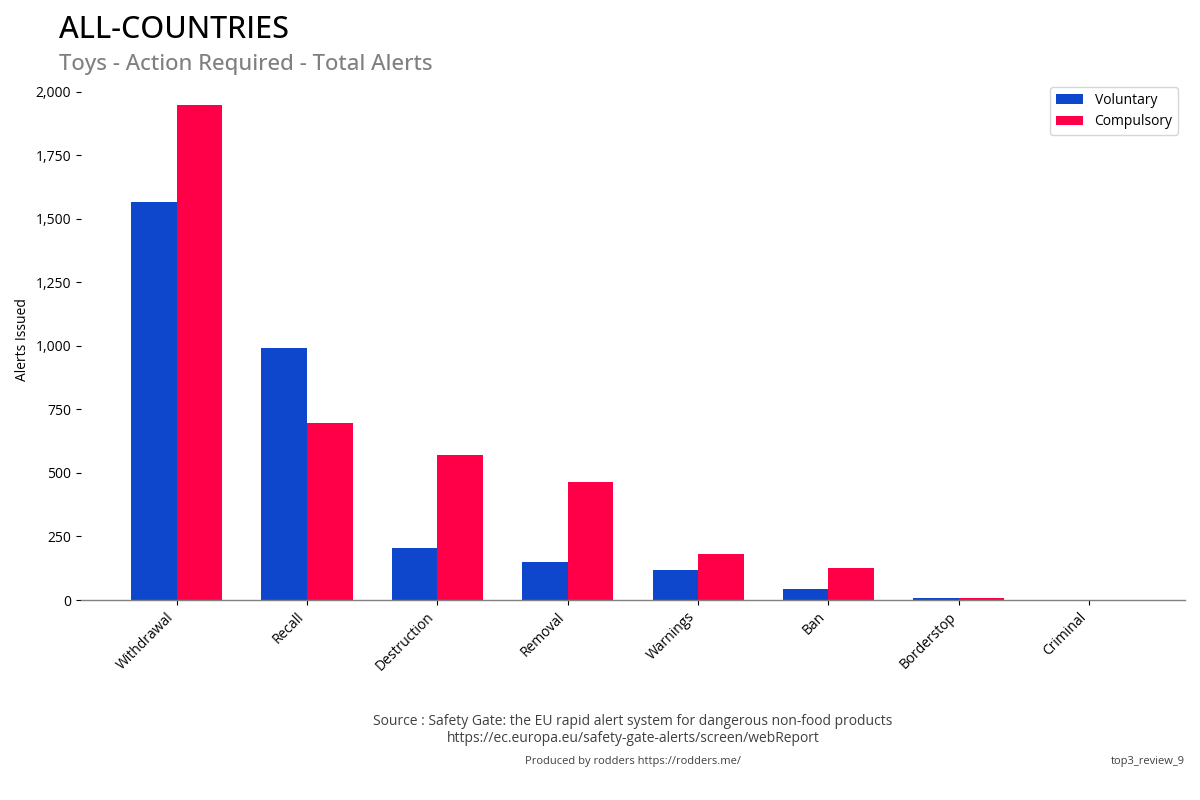
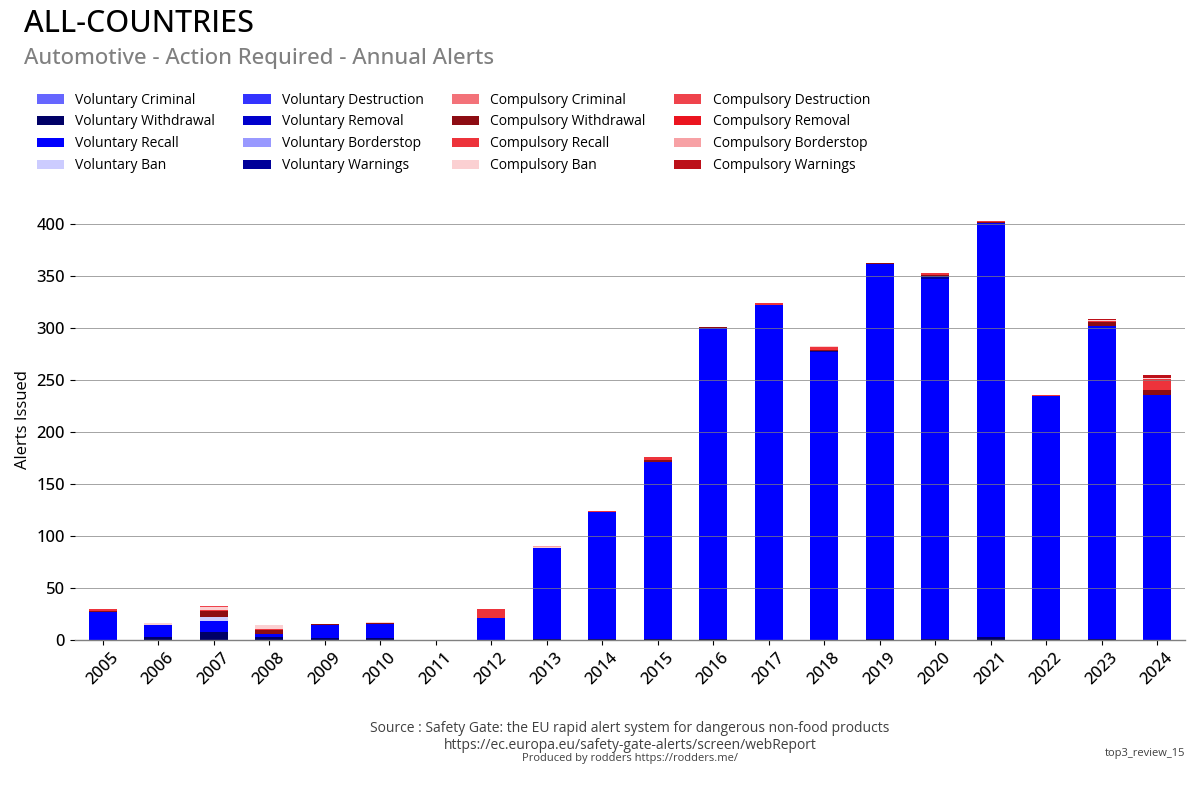
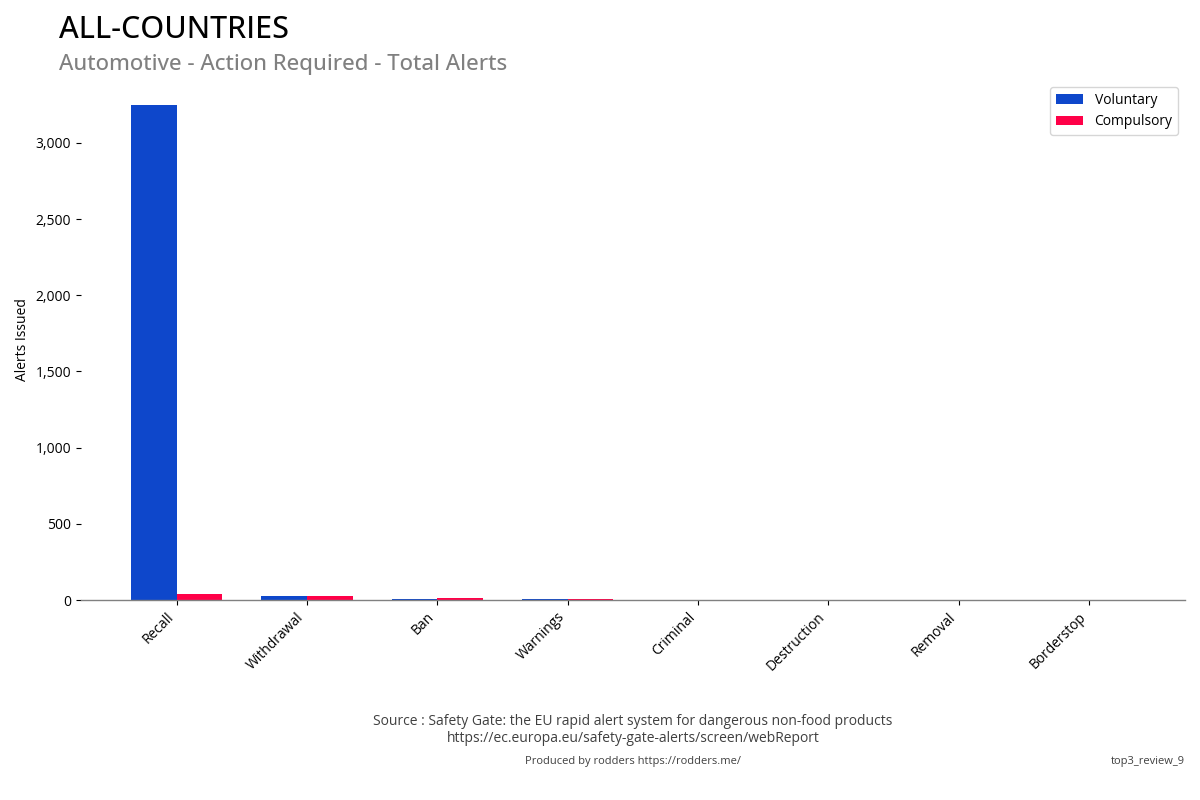
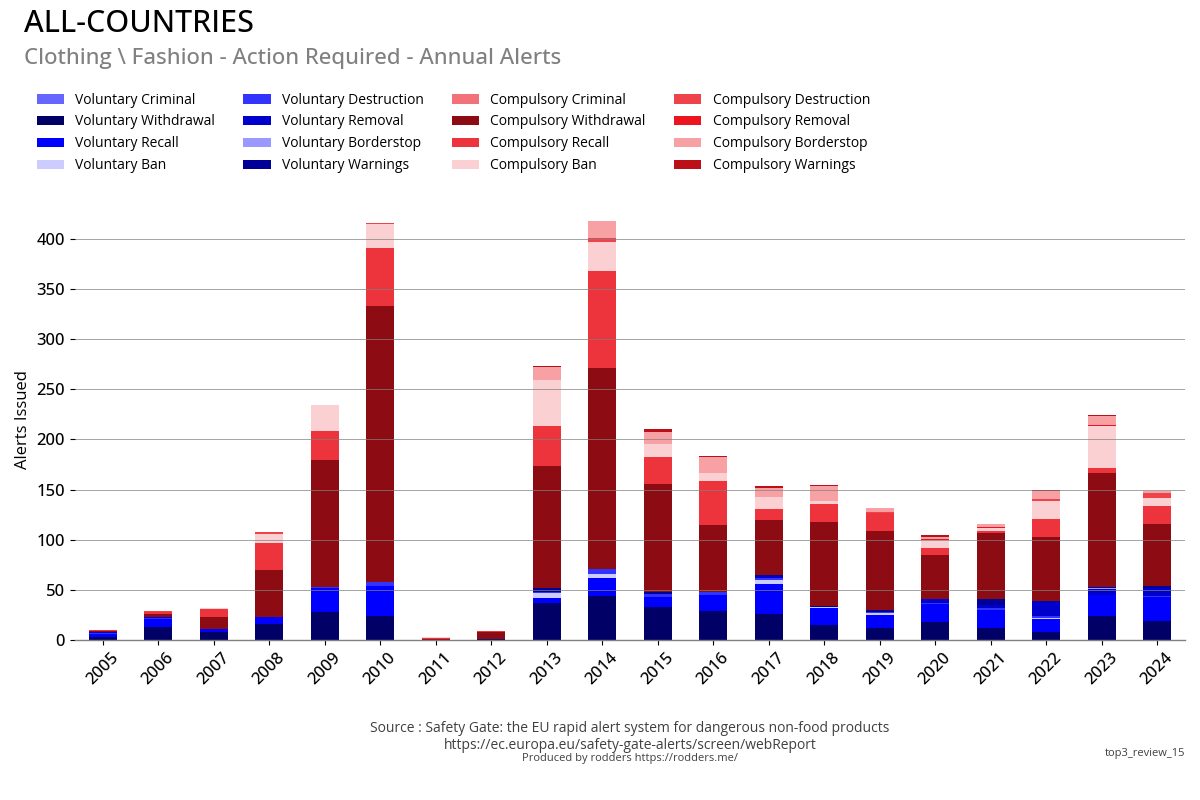
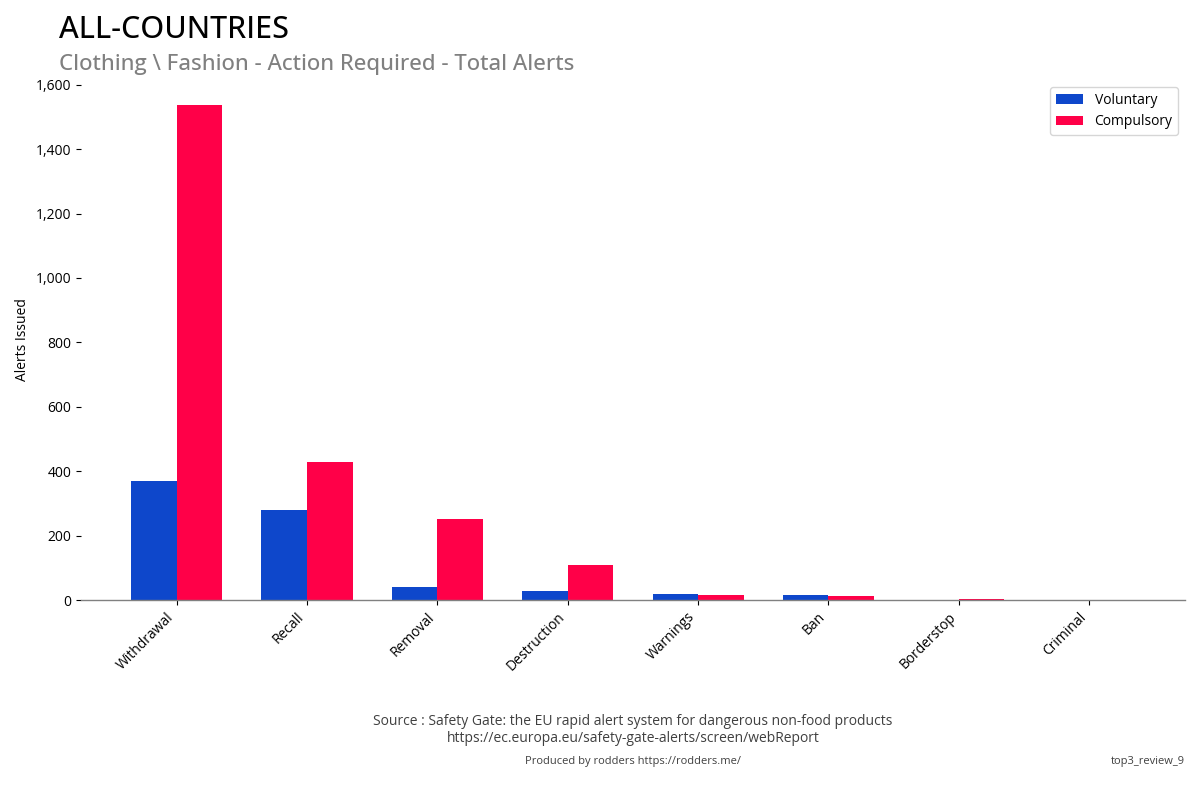
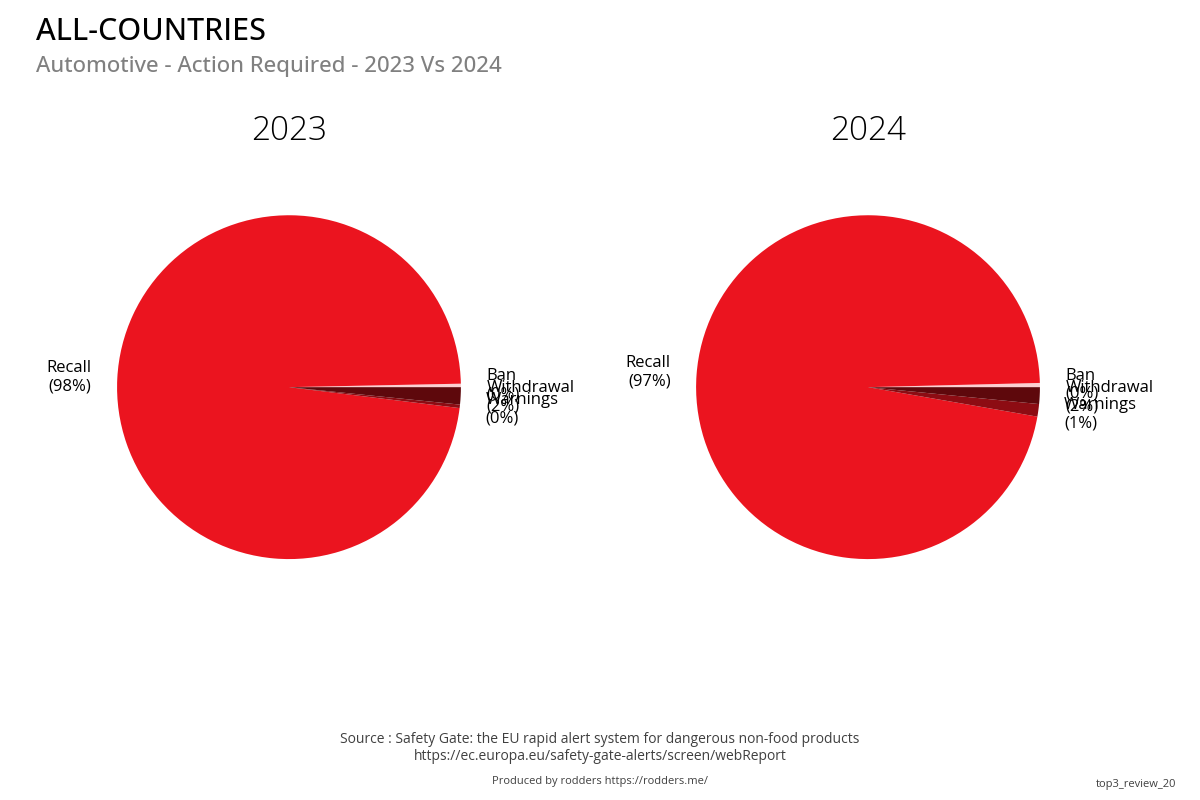
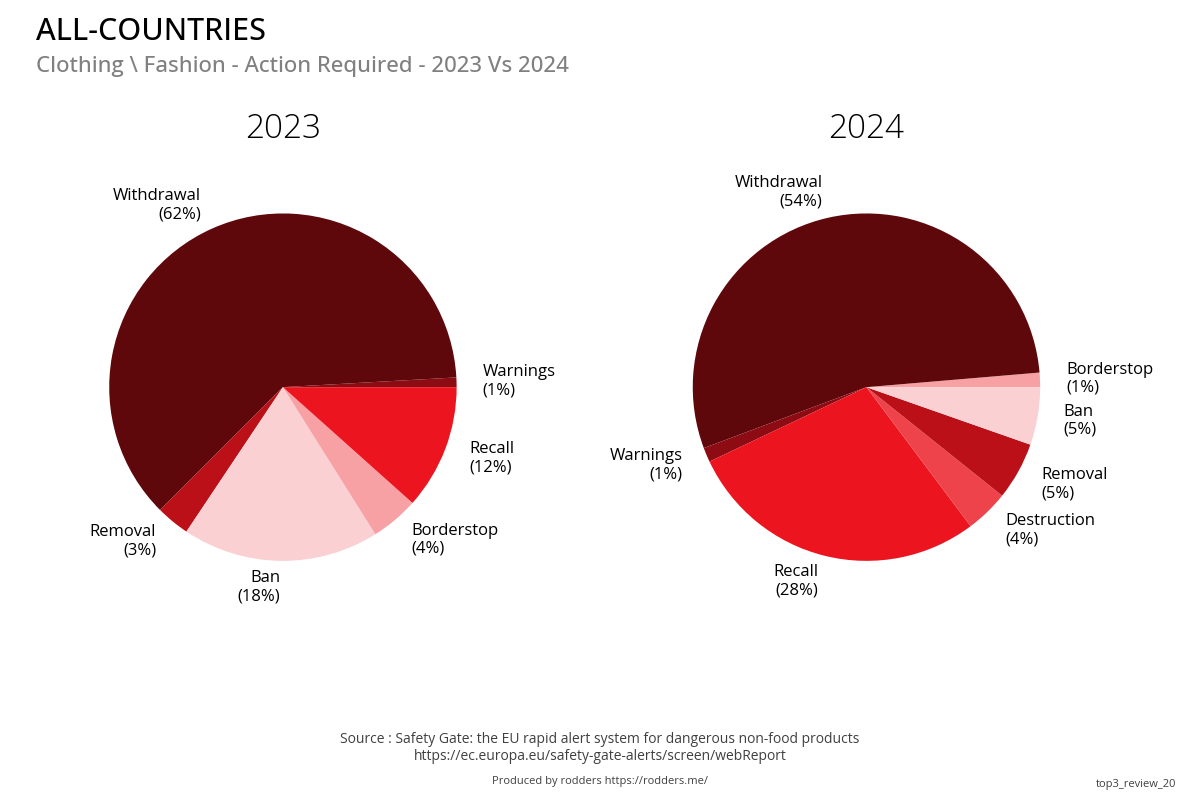
Compulsory / Voluntary Action Required
The increase in the percentage of alerts requiring a ban from sale in 2023 is due to the ban of the chemical BMHCA in cosmetics.Previous Year Vs Current Year
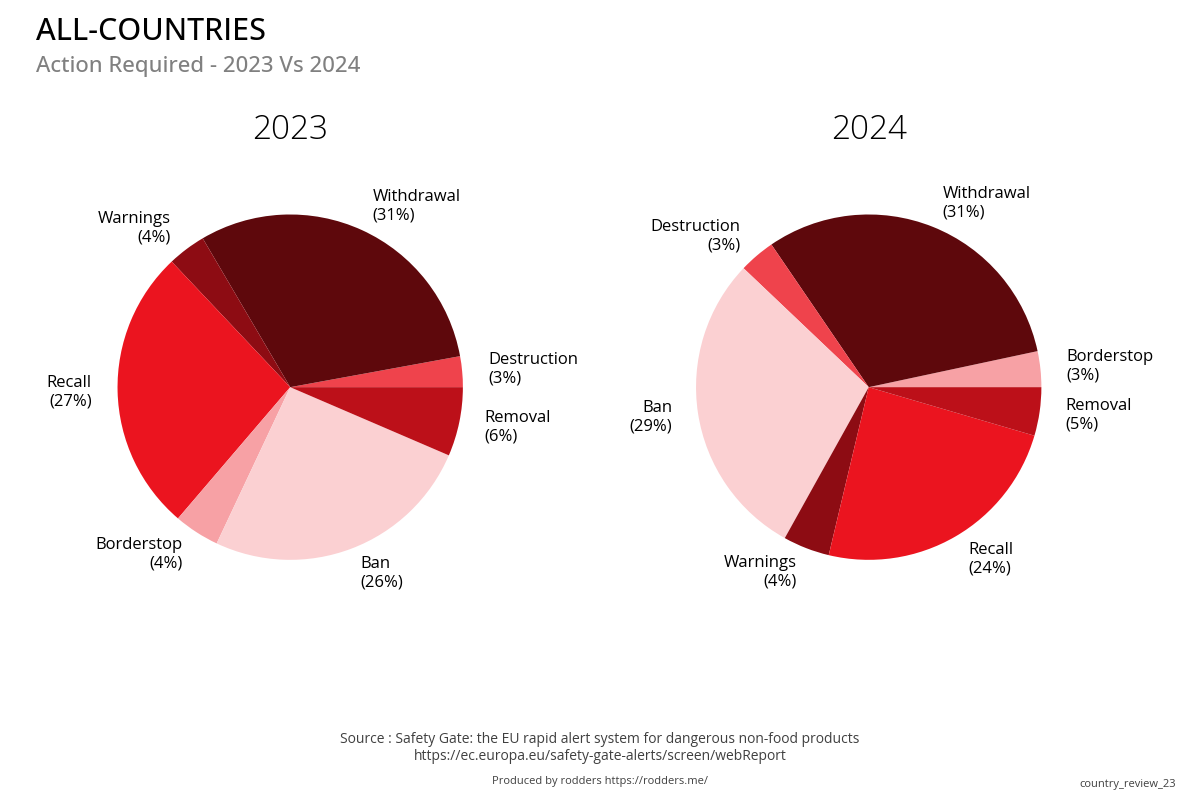
Total & Annual Alerts
| Annual Action Required | Compulsory Vs Voluntary |
|---|---|
|
|
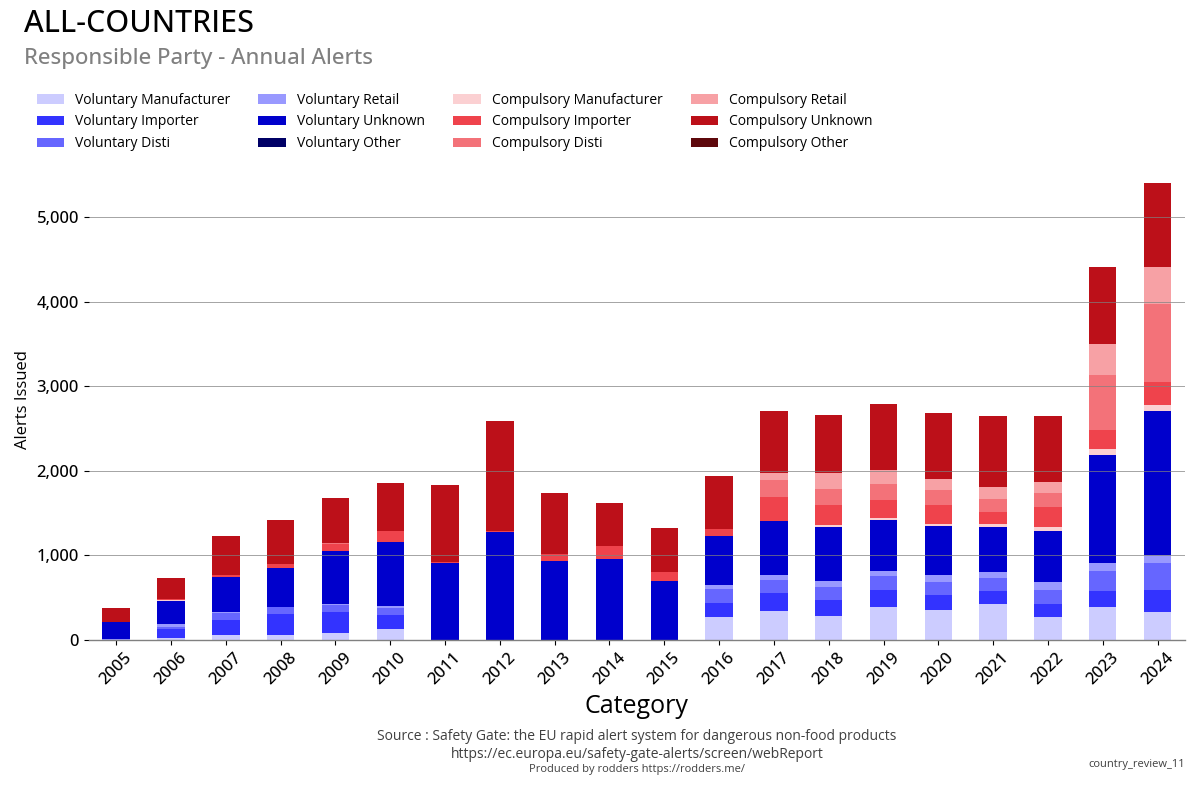
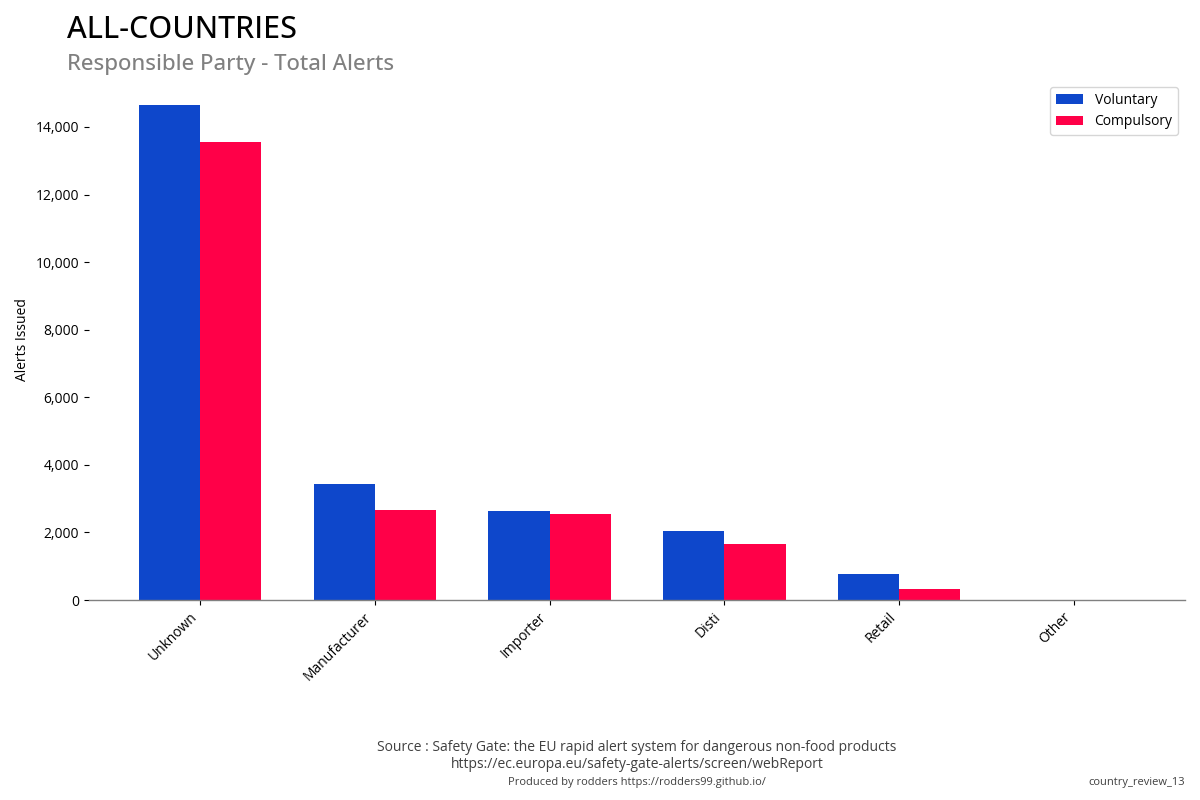
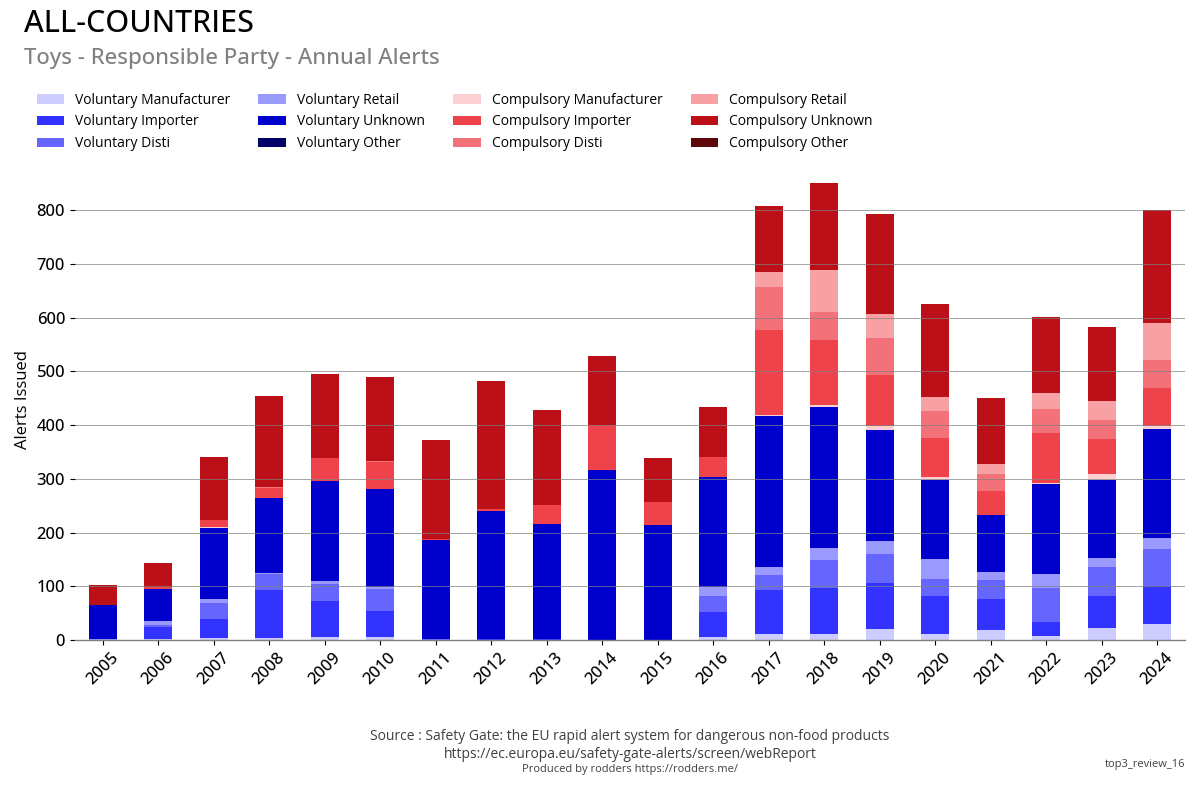
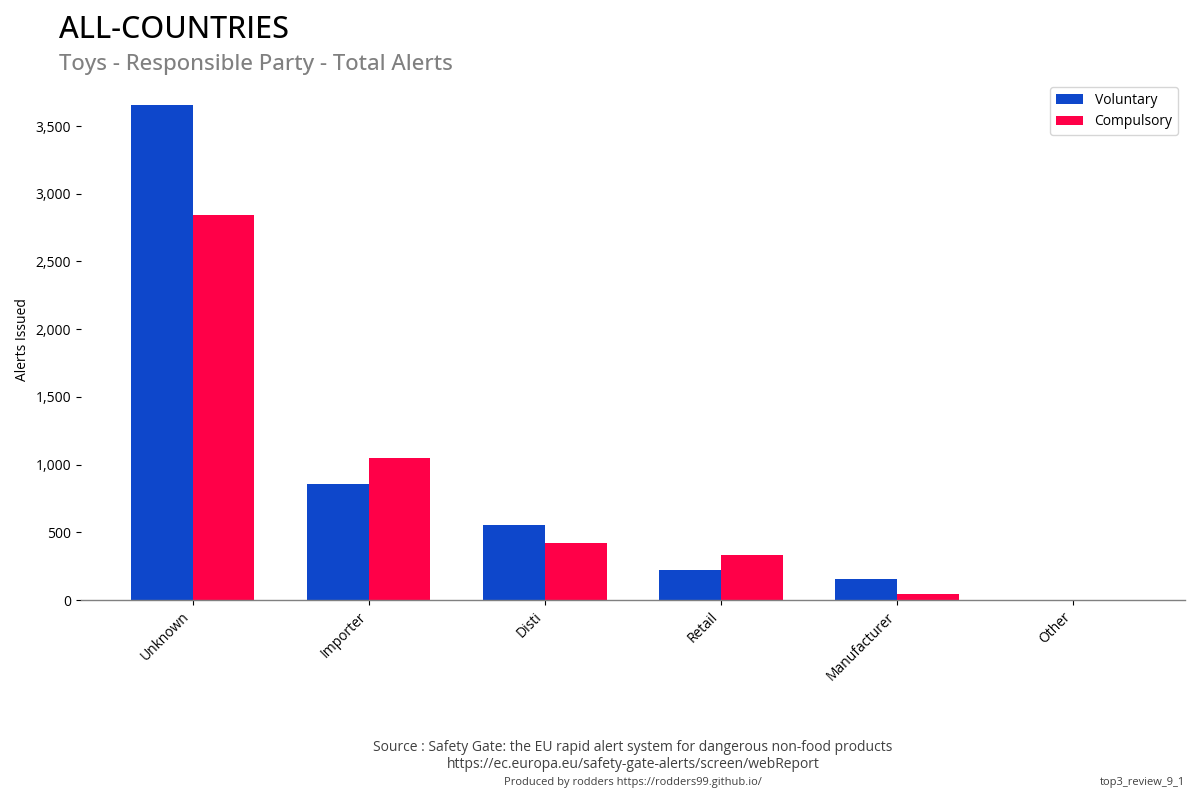
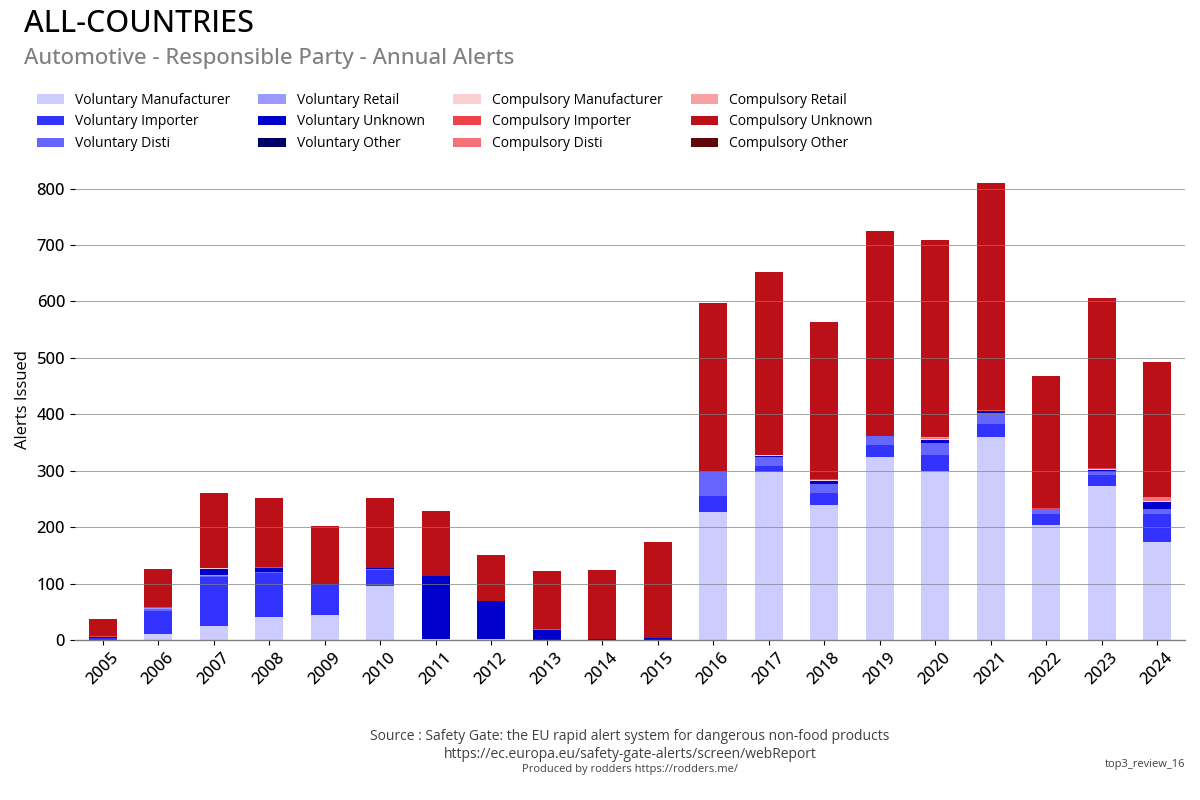
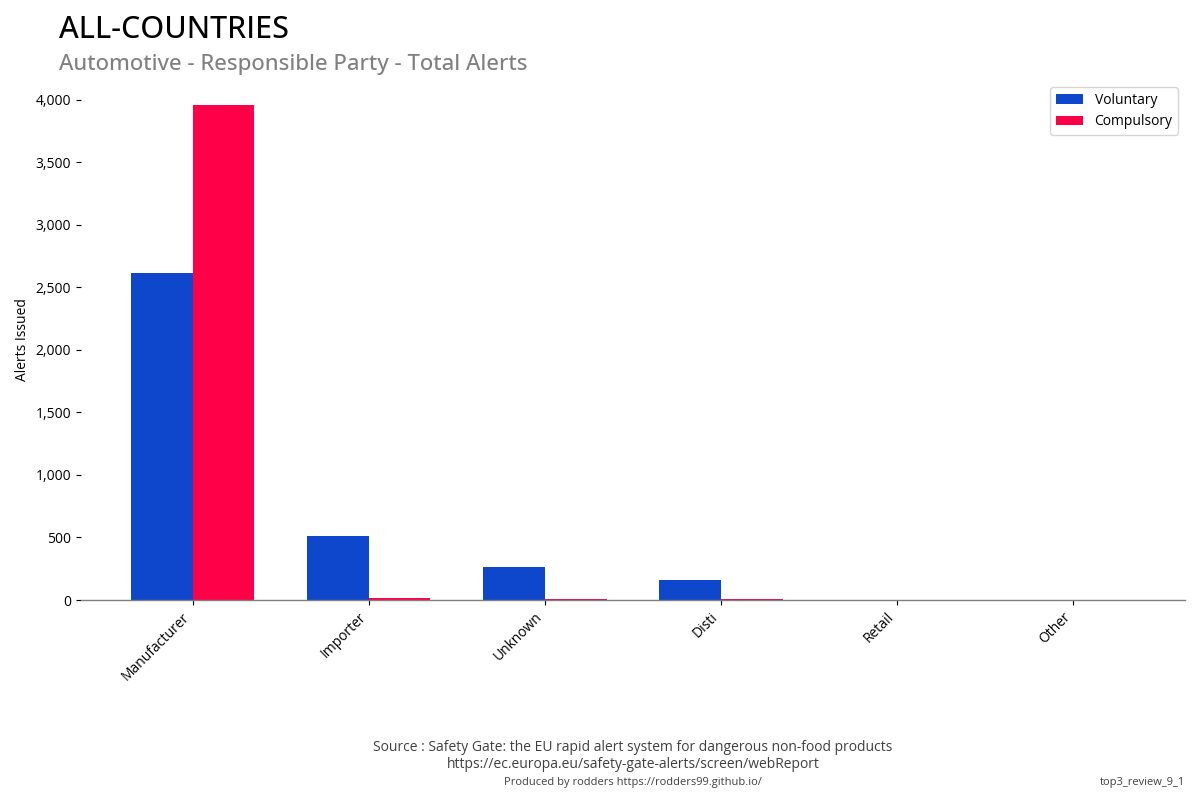
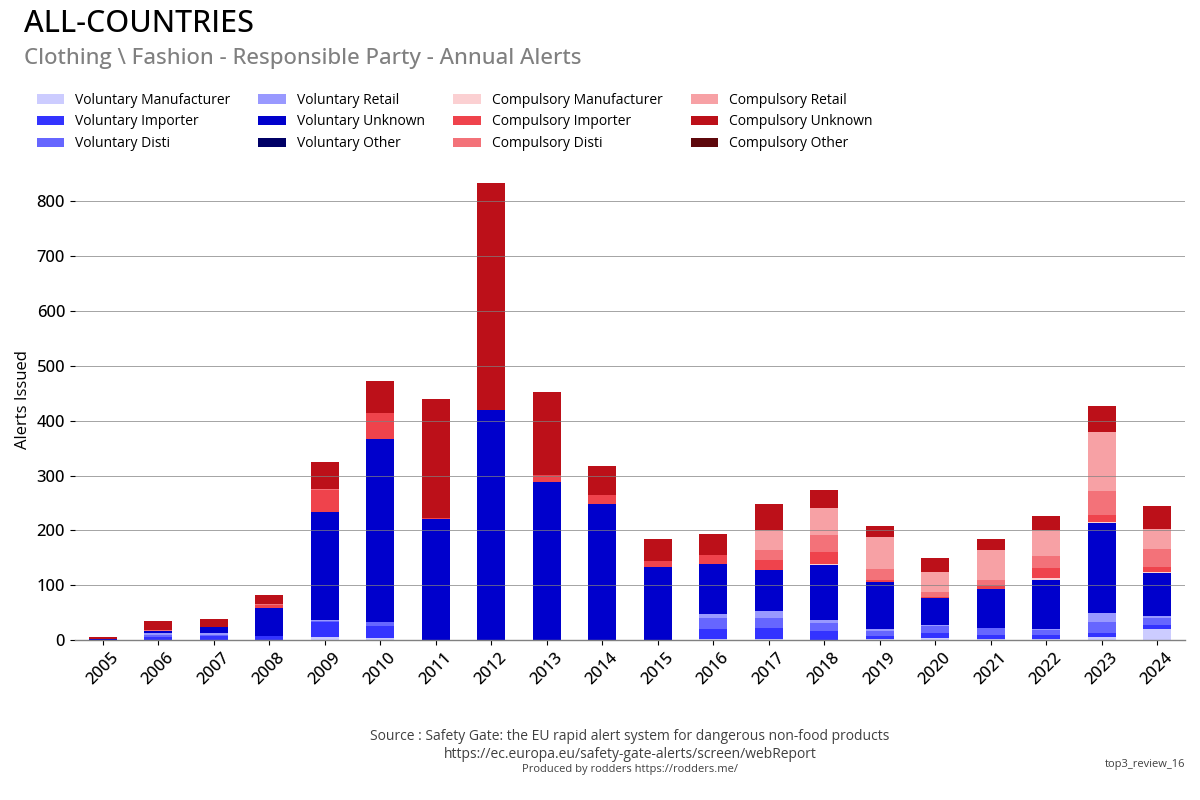
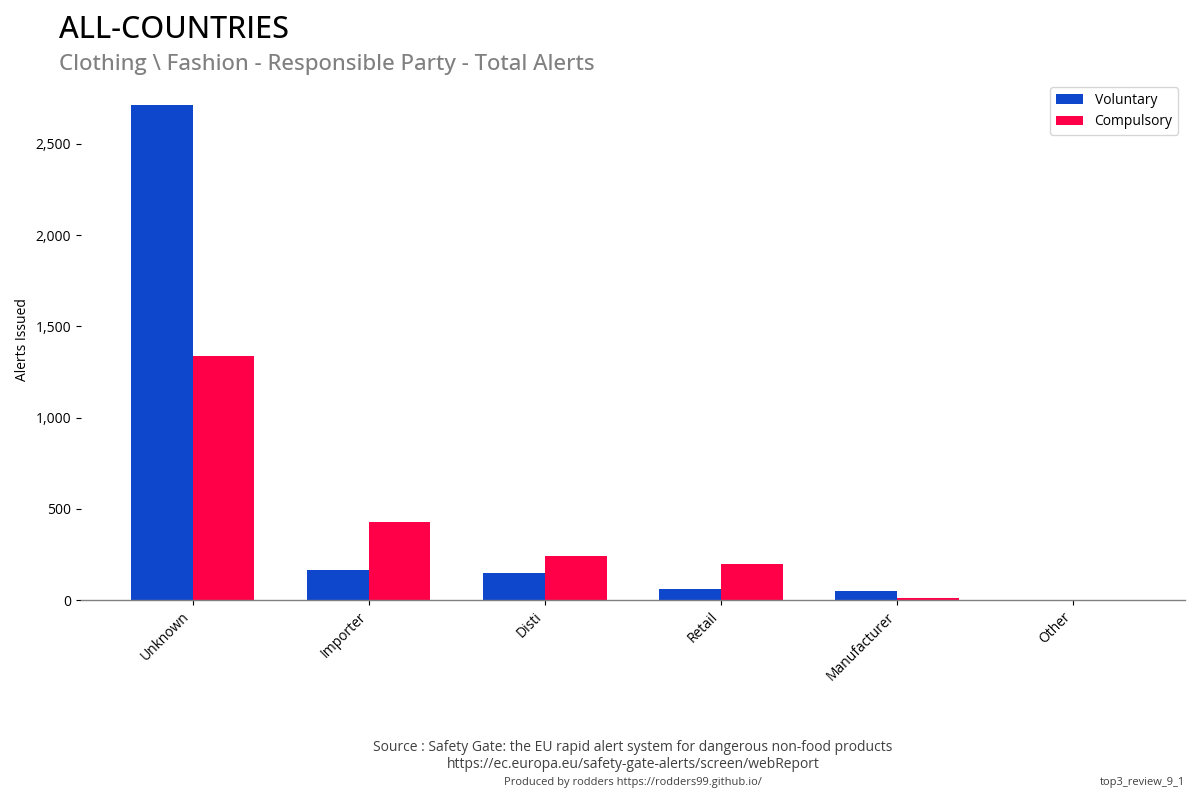
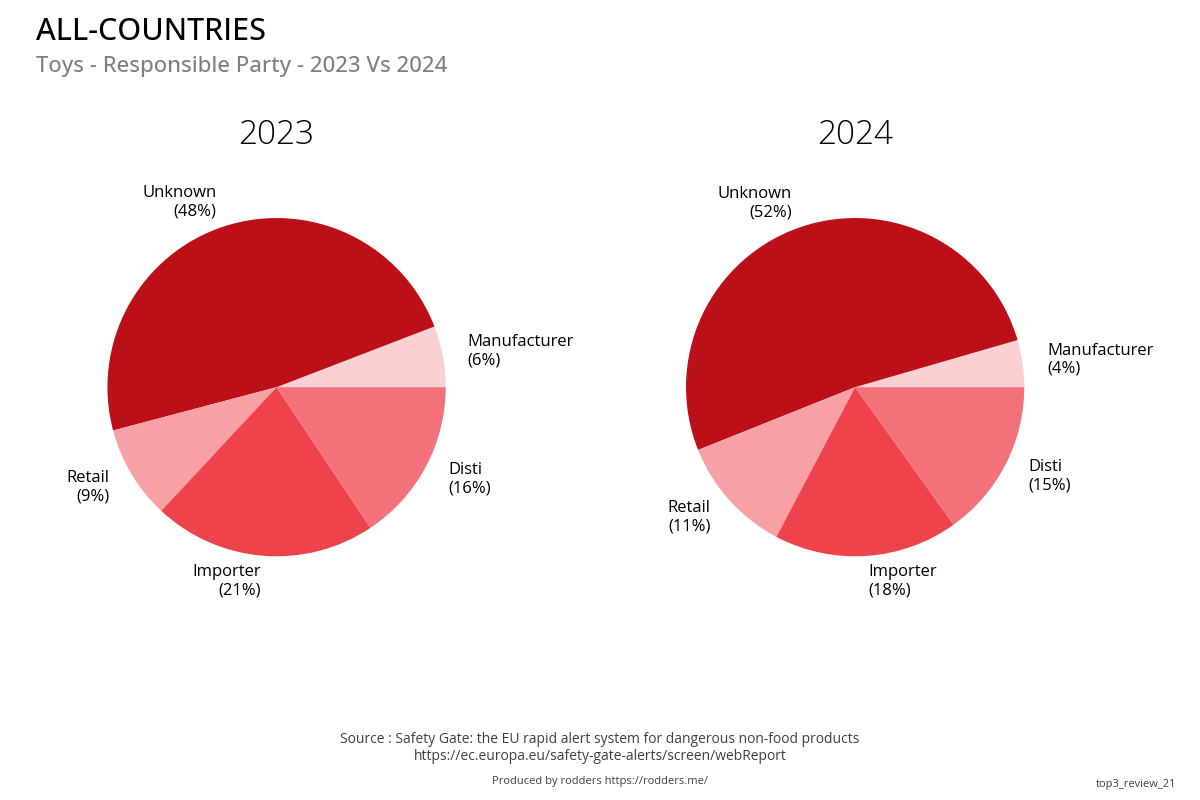
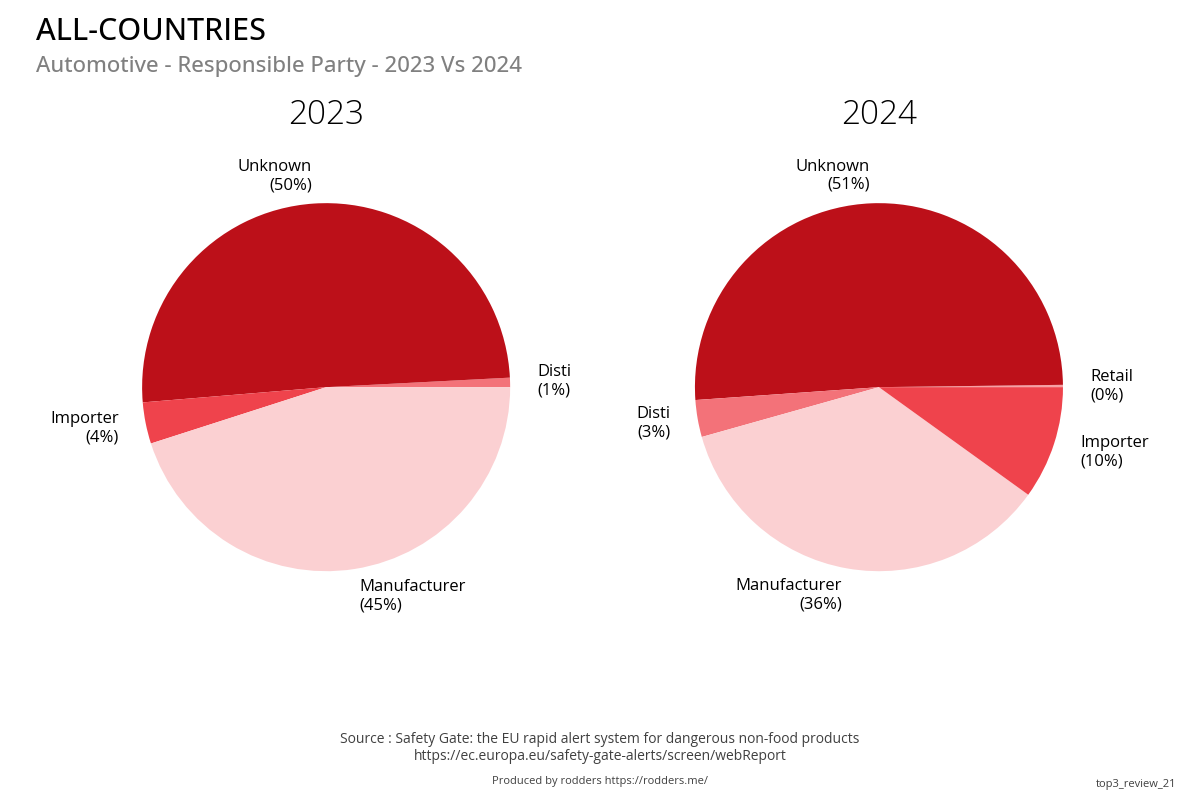
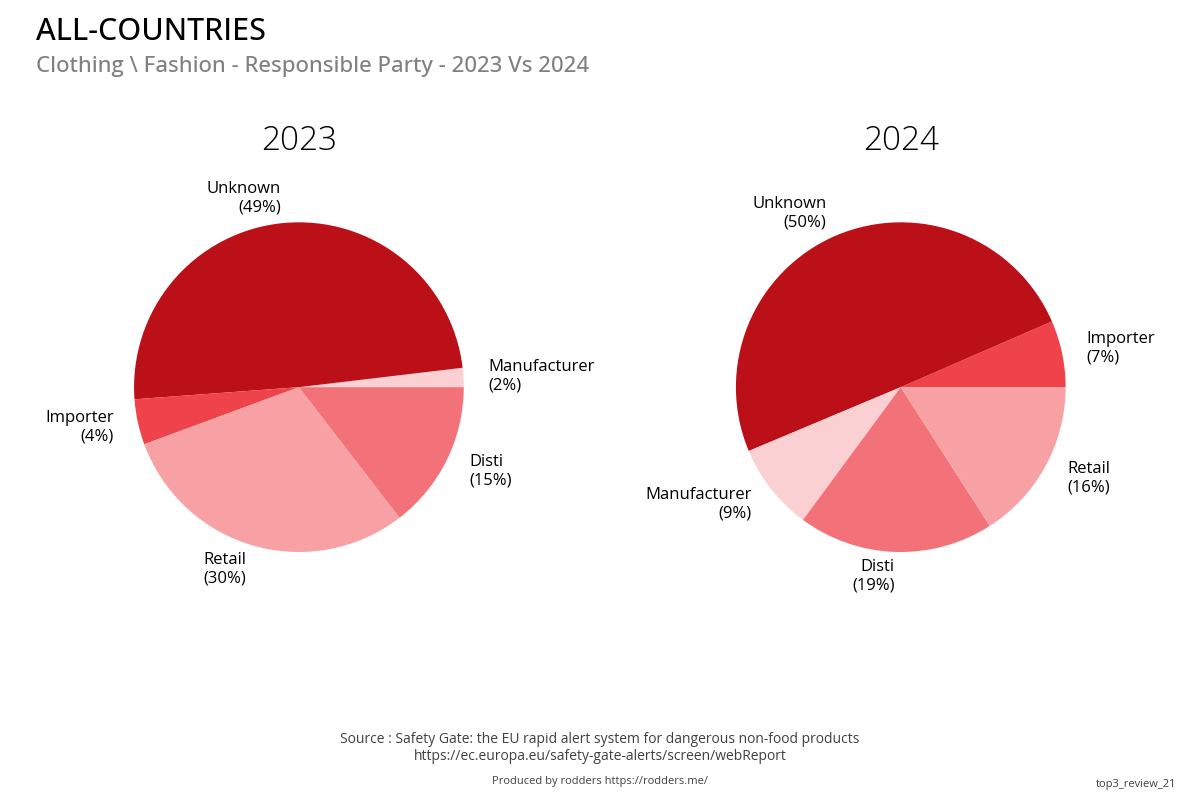
Compulsory / Voluntary Responsible Party
Previous Year Vs Current Year
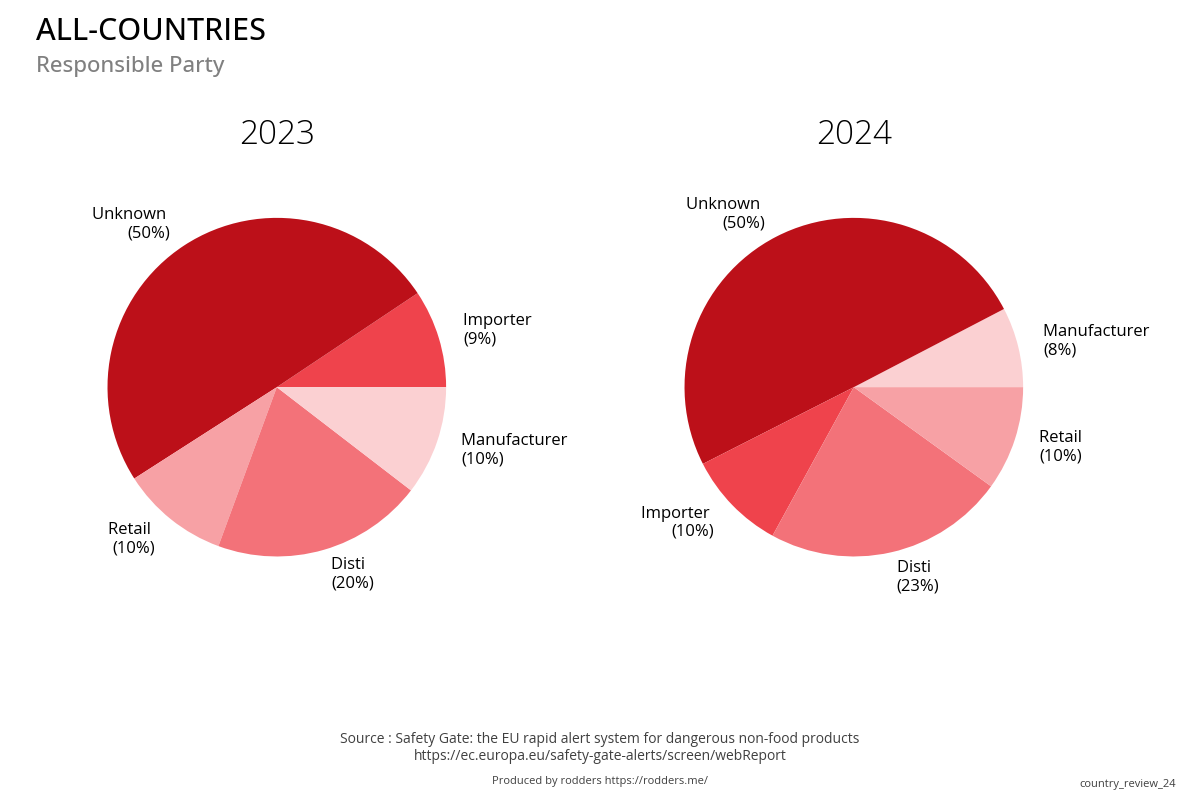
Annual Alerts
| Annual Responsible Party | Compulsory Vs Voluntary |
|---|---|
|
|
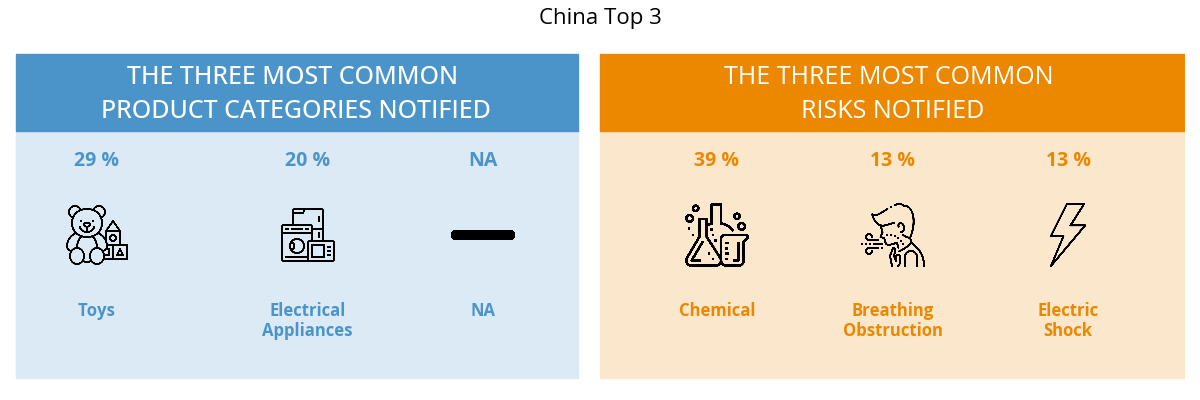
Top 15 Countries - Key Fact sheets
Programmatically created reproductions of the Top 3 Risk and Product categories by country visualisation in the official Fact sheet. Safety_Gate_2023_Factsheet_EN.pdf
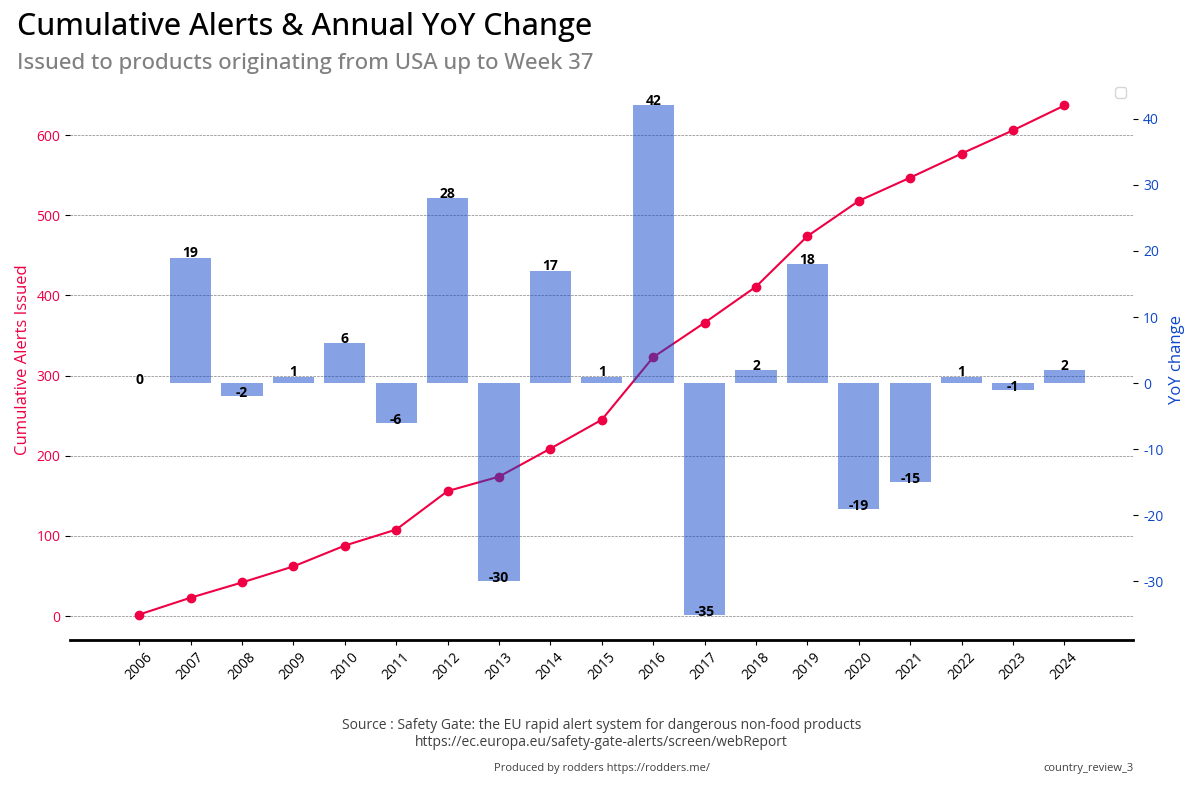
Cumulative, Annual and YoY change / Top3 Categories (Risk/Product)
| Country | Annual Total | Cumulative Total and YoY Change |
|---|---|---|
| China | 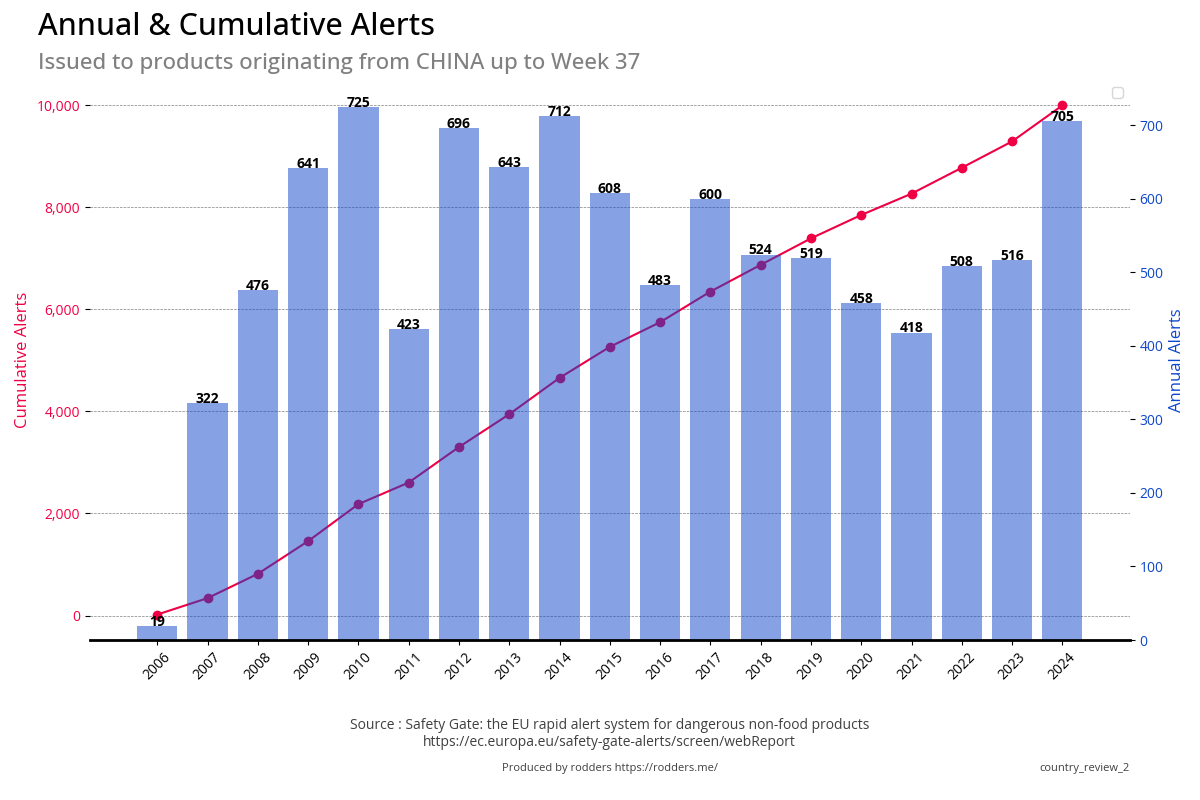 |
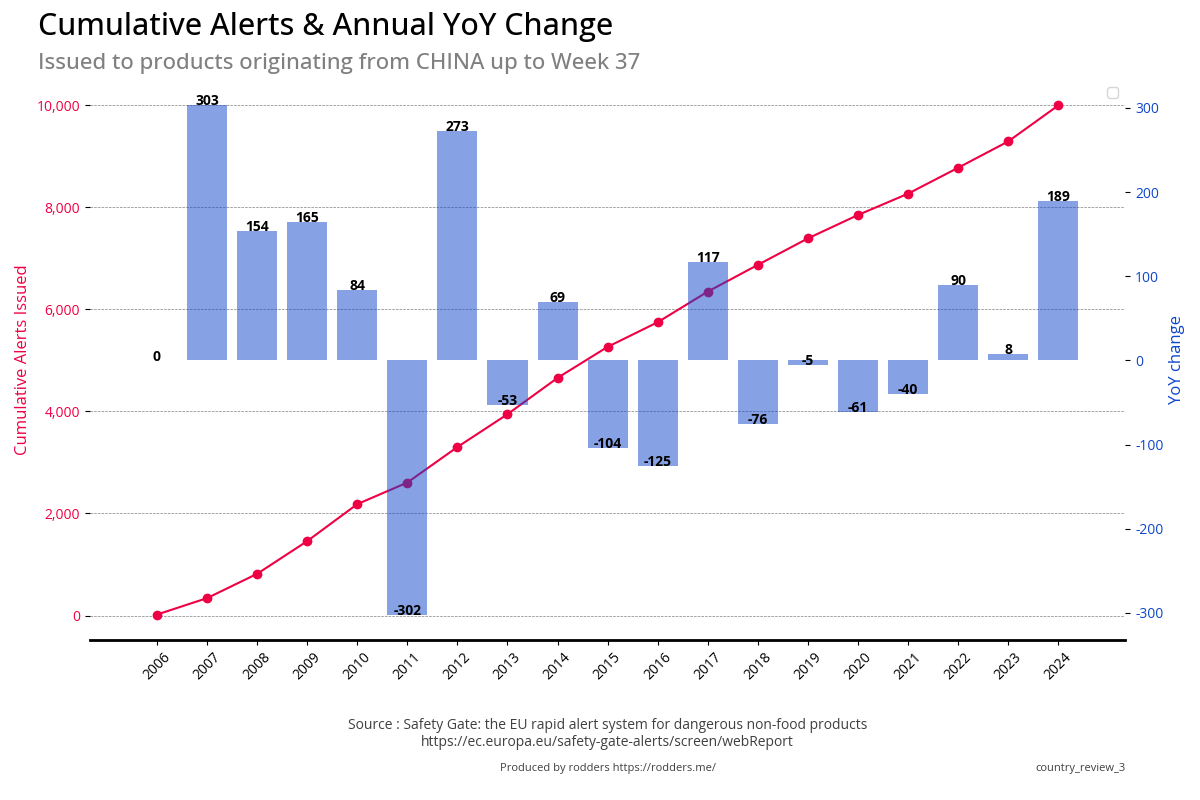
|
| China |
 |
|
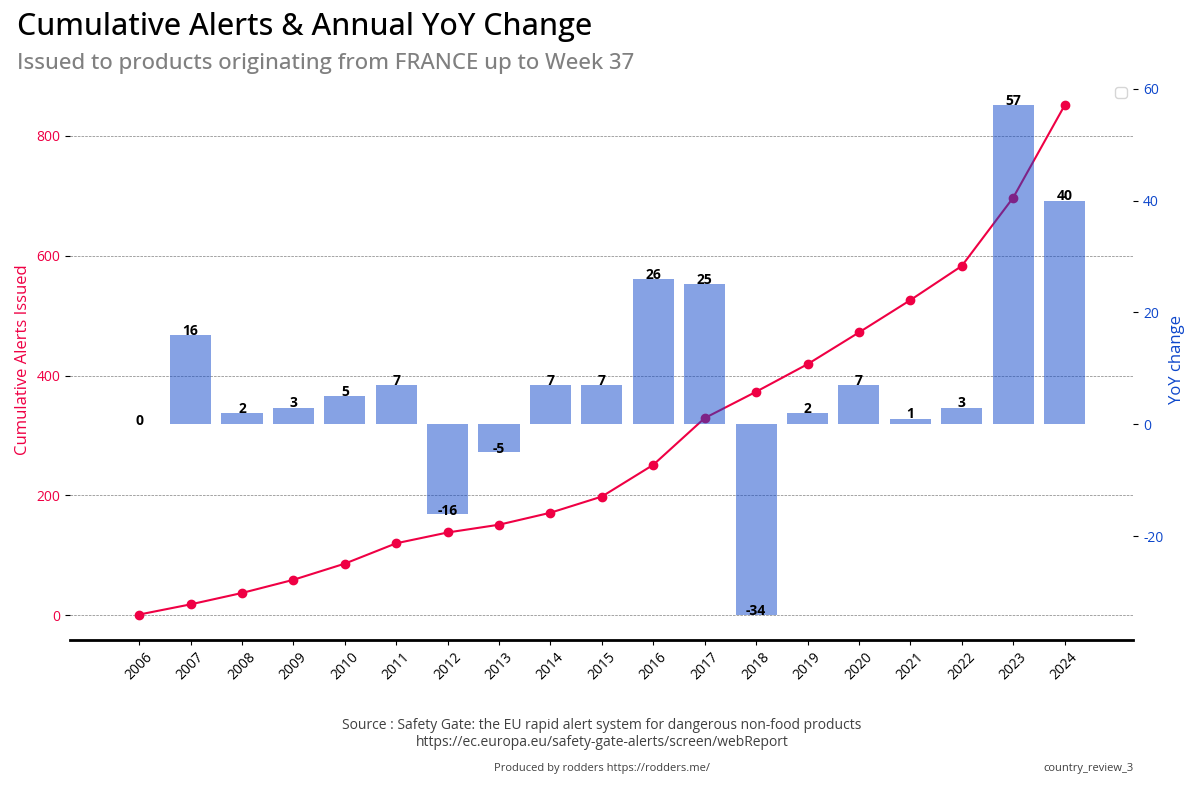
| France | 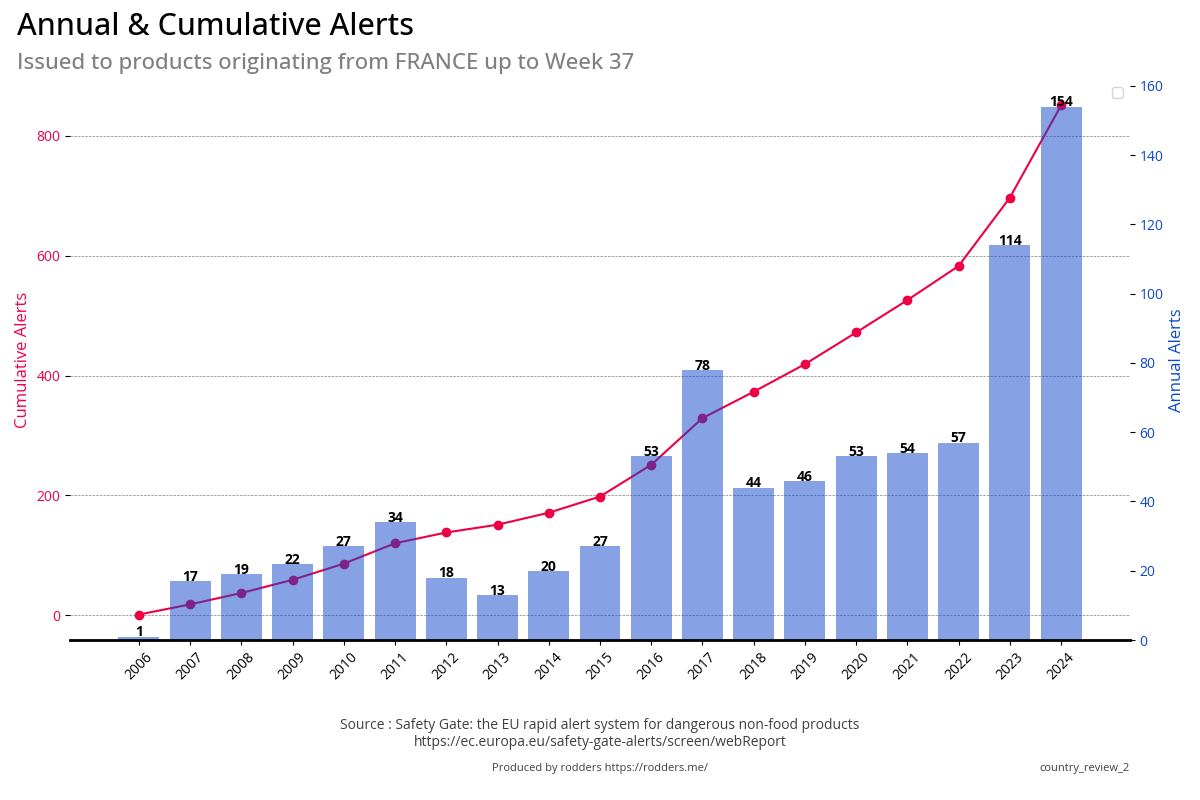 |
|
| France | 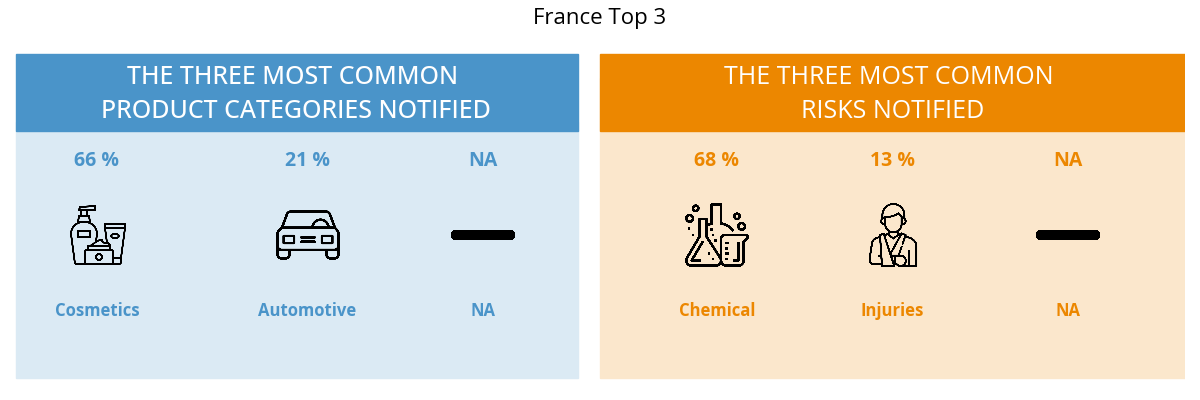 |
|
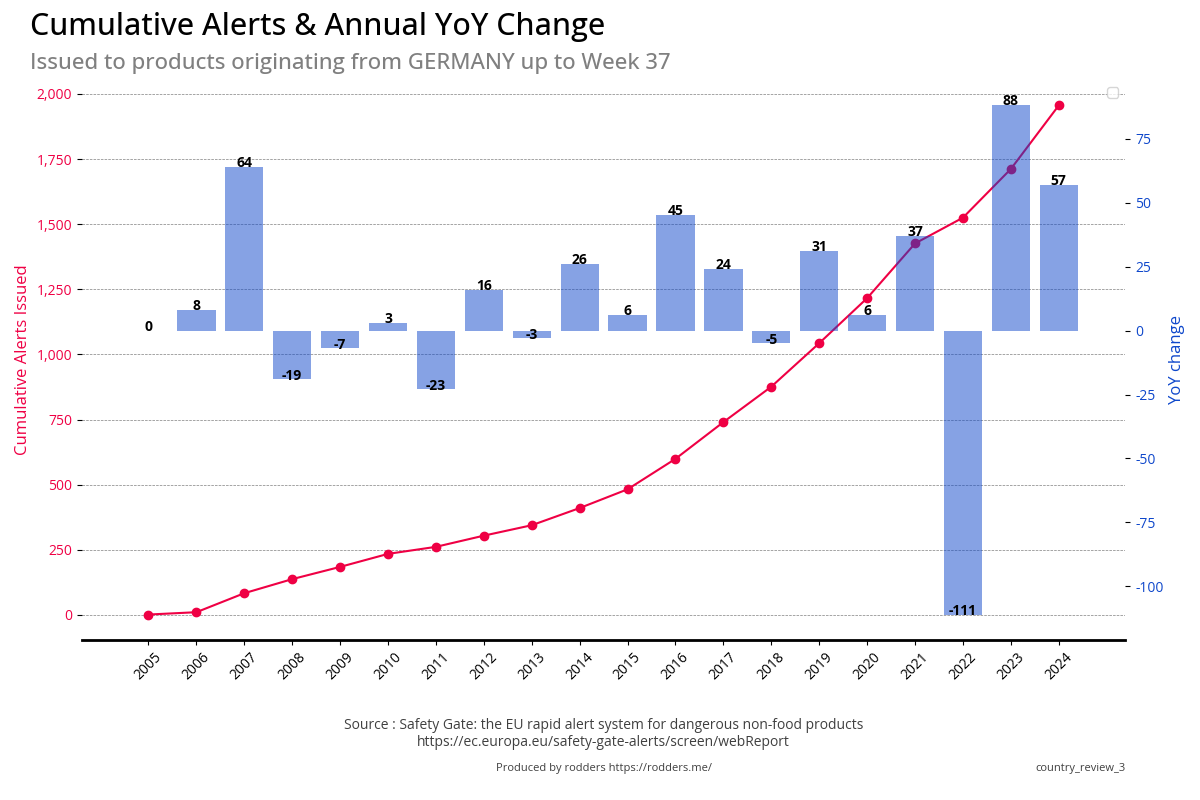
| Germany | 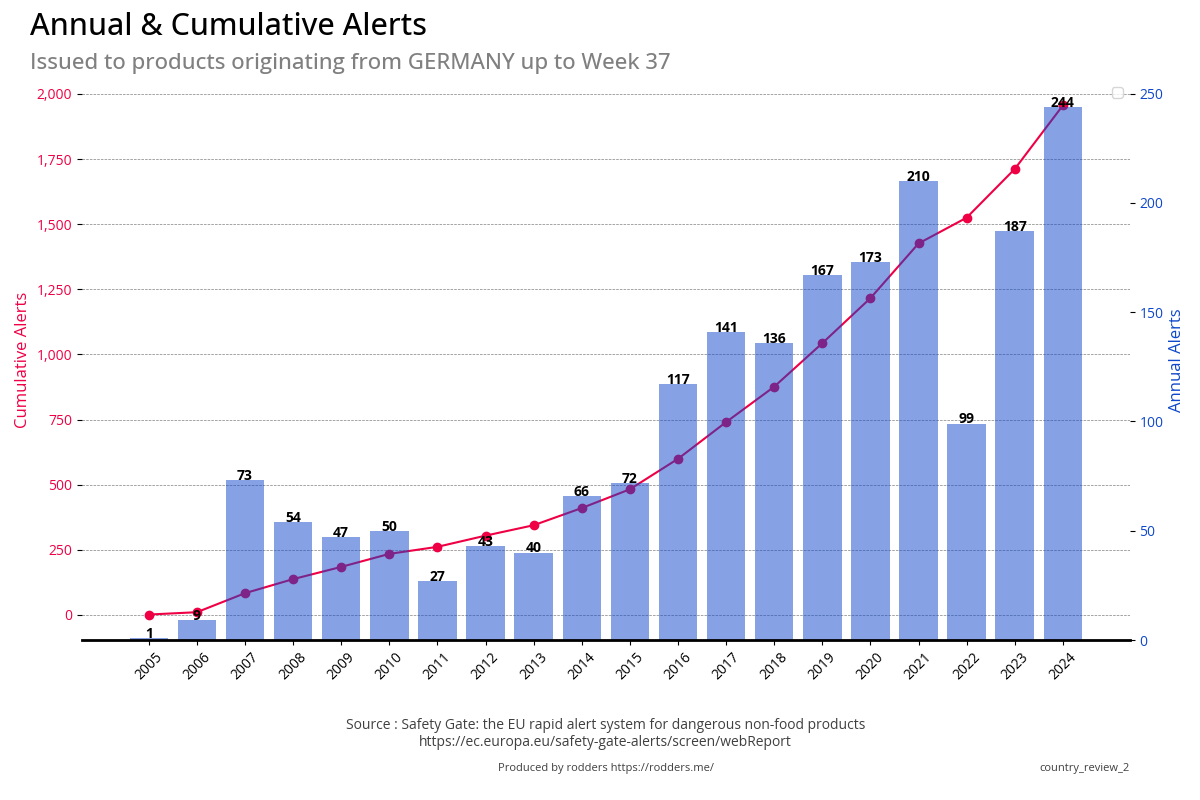 |
|
| Germany | 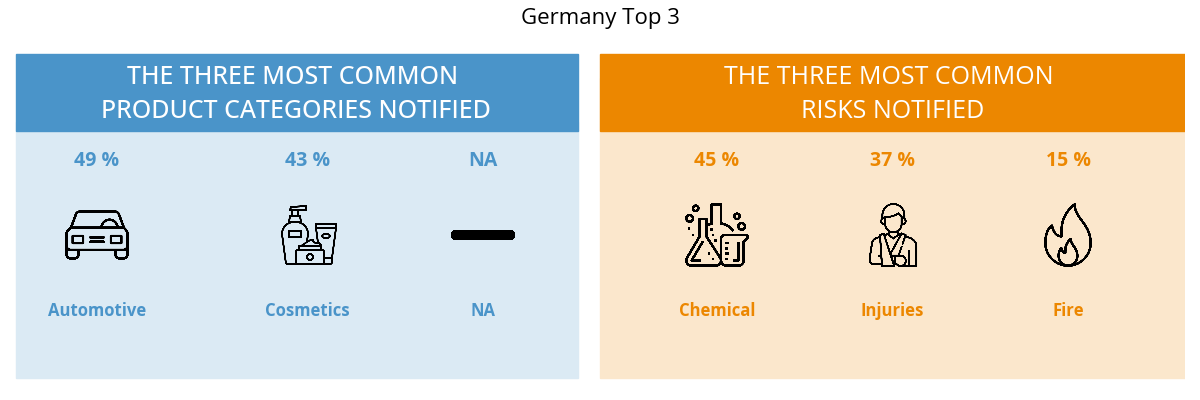 |
|
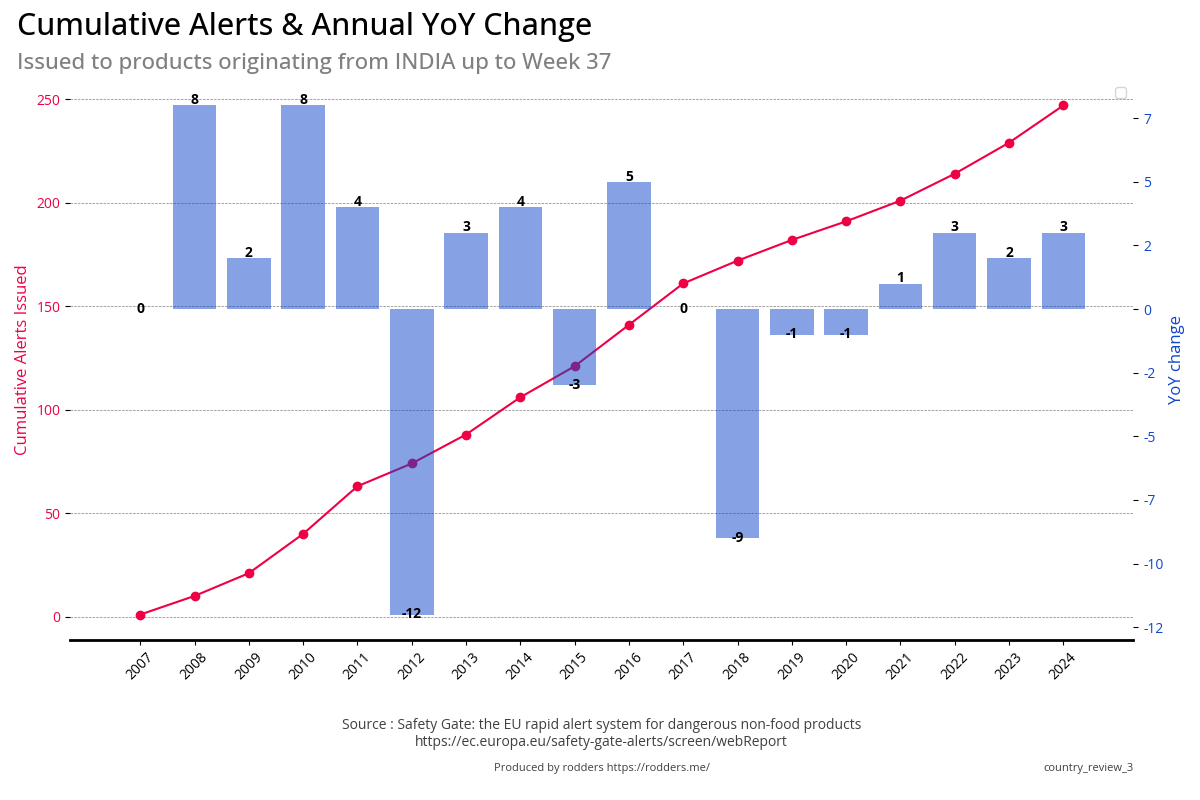
| India | 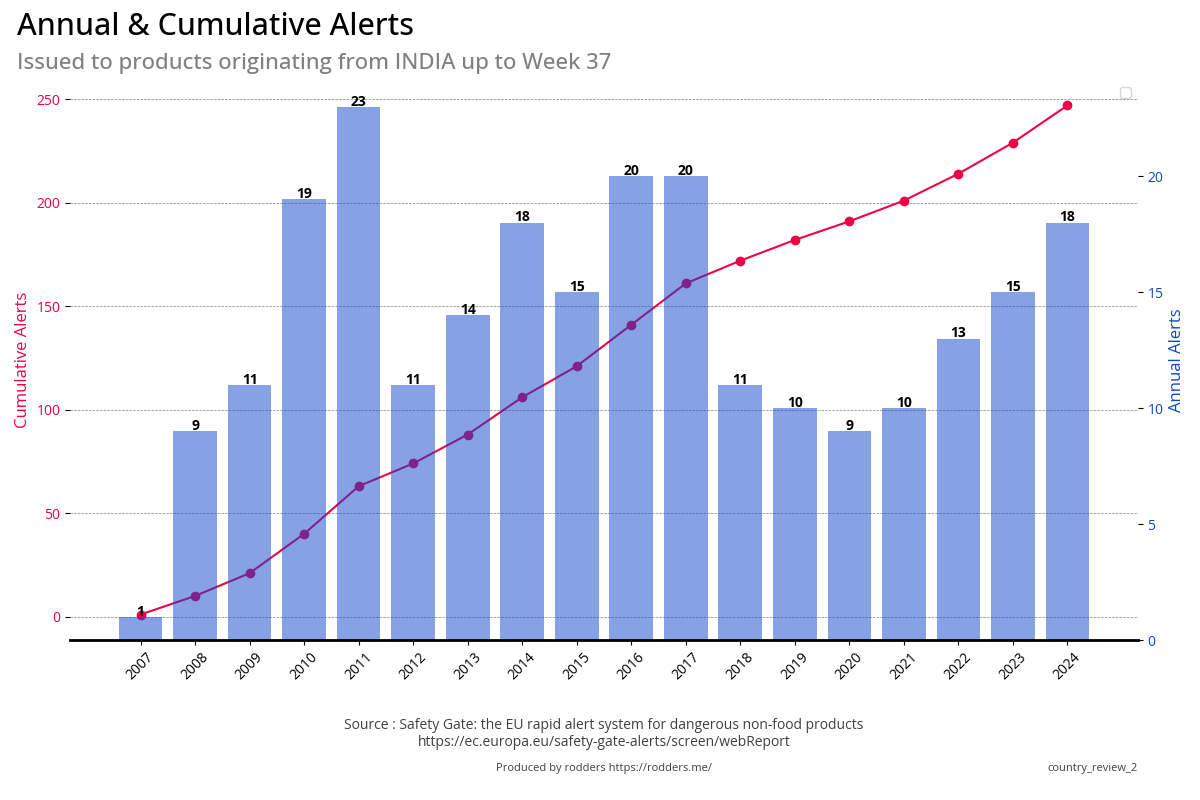 |
|
| India | 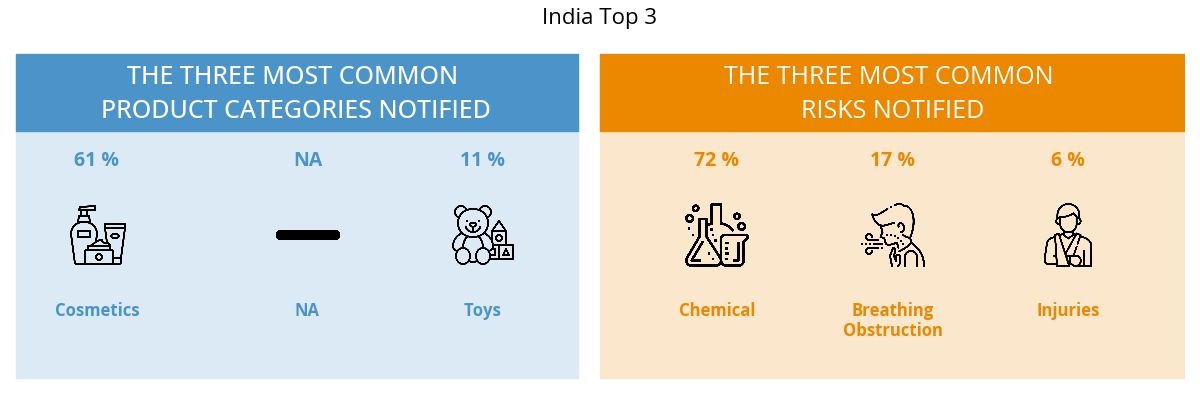 |
|
| Italy | 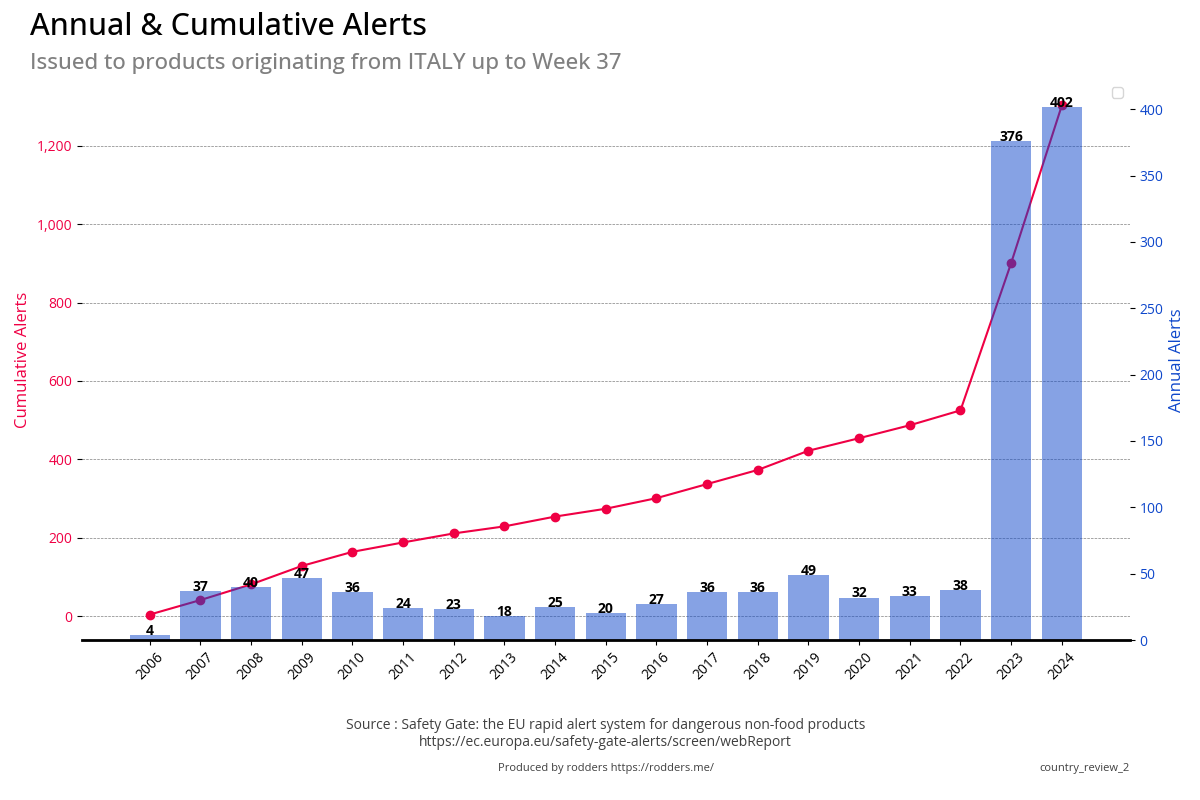 |
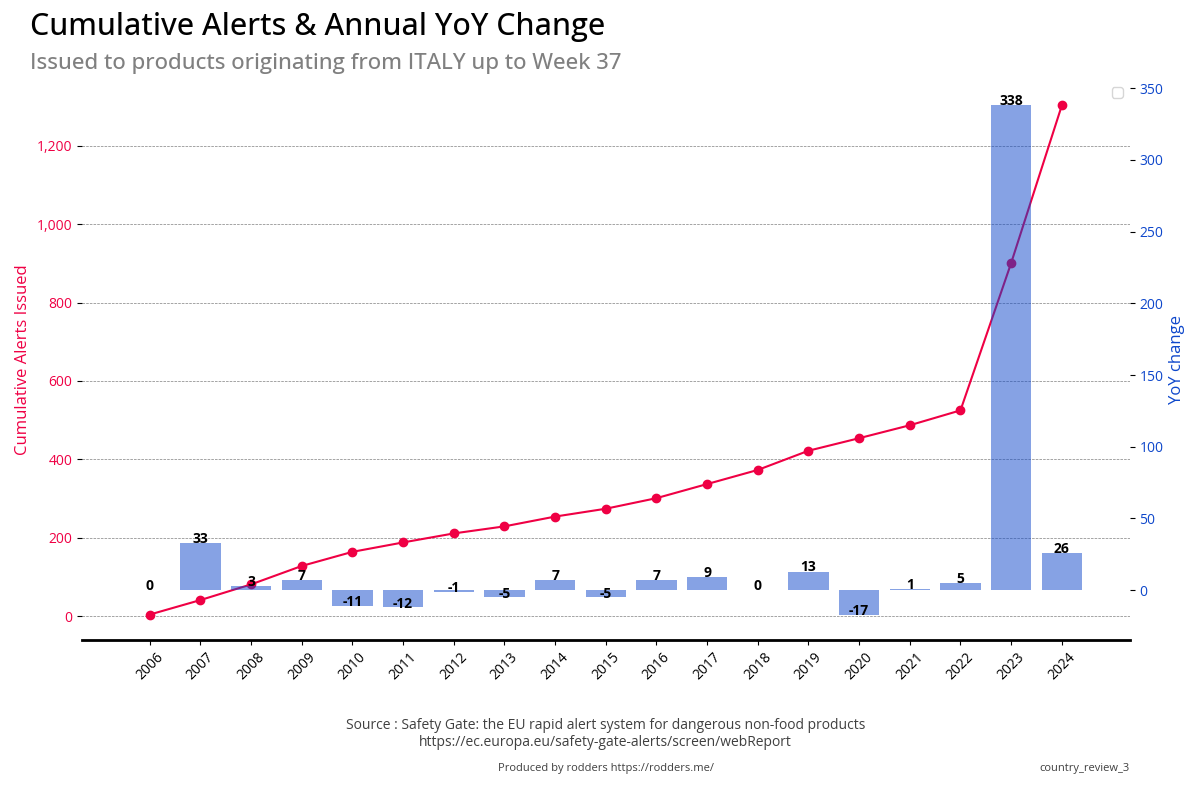
|
| Italy | 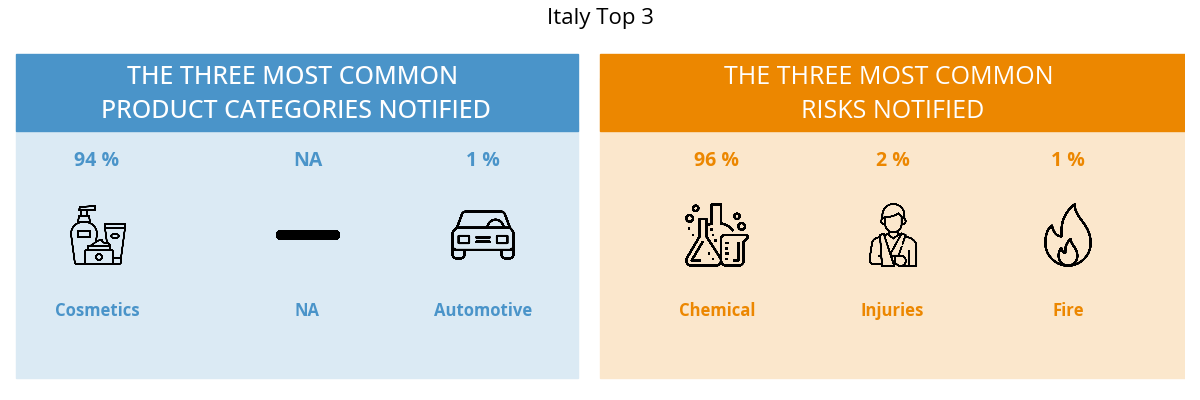 |
|
| Japan | 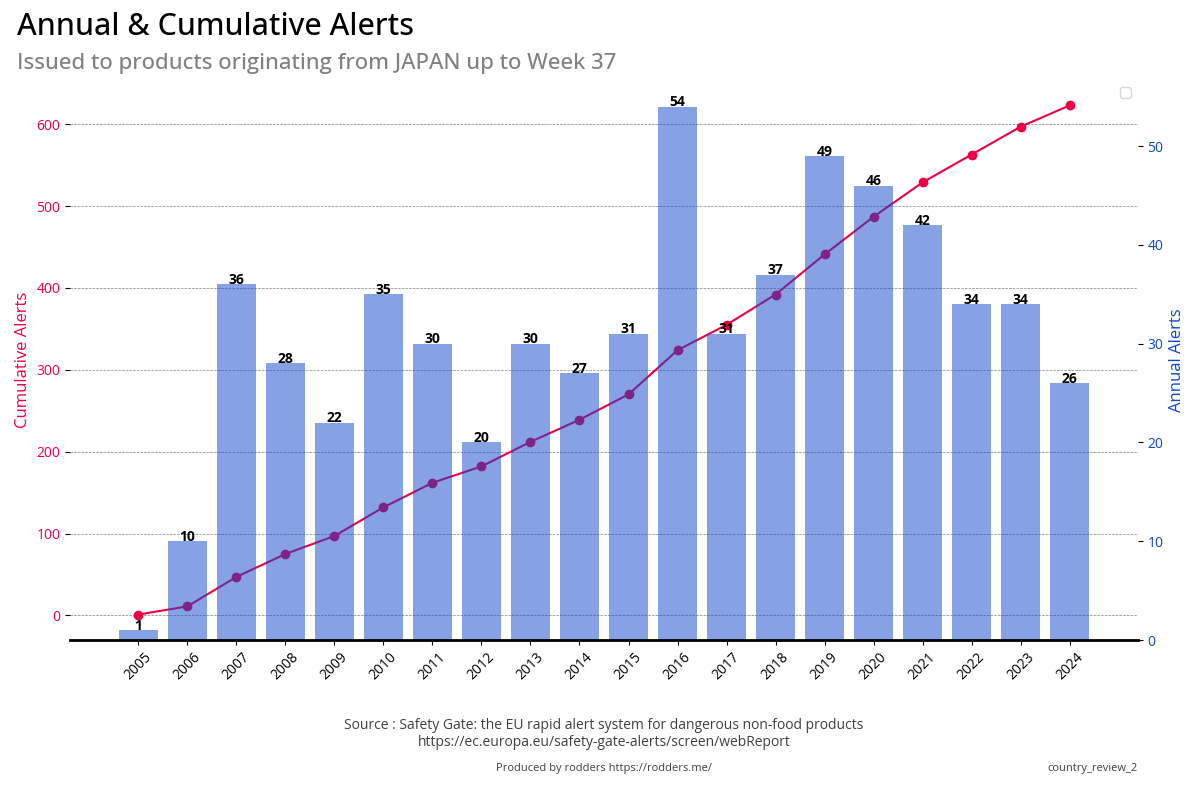 |
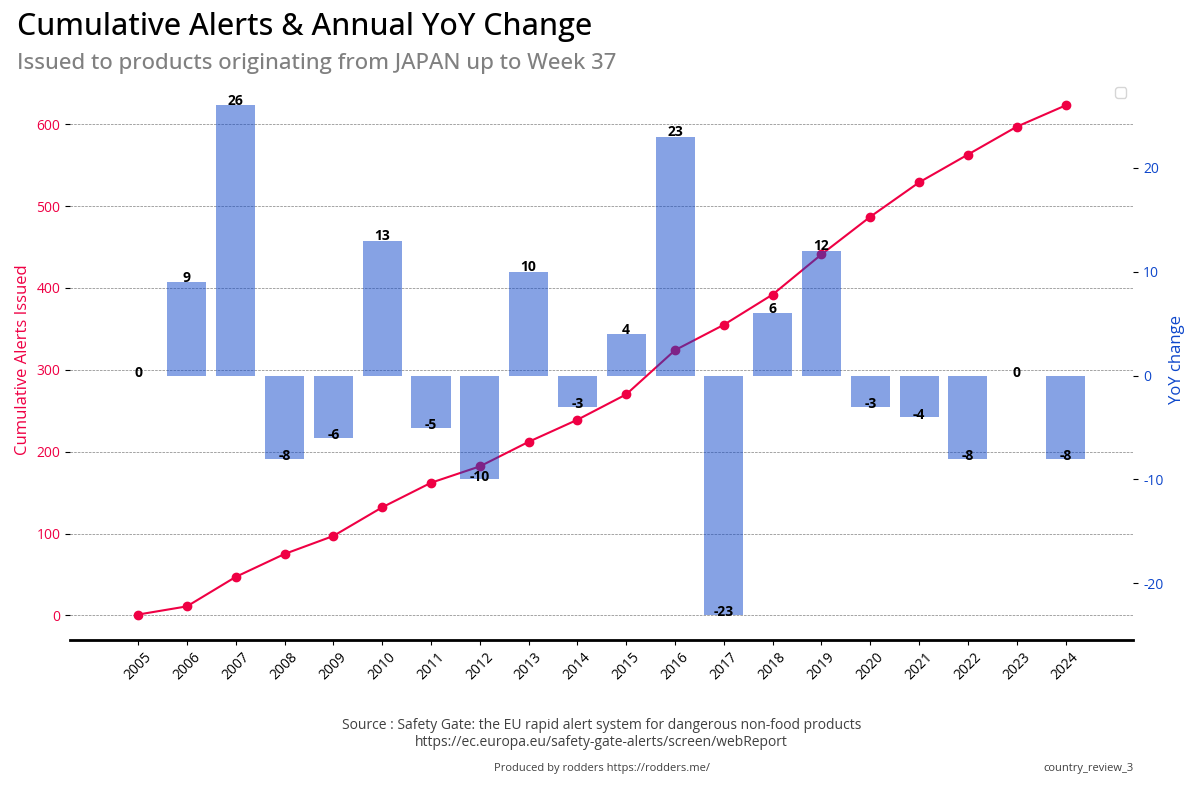
|
| Japan | 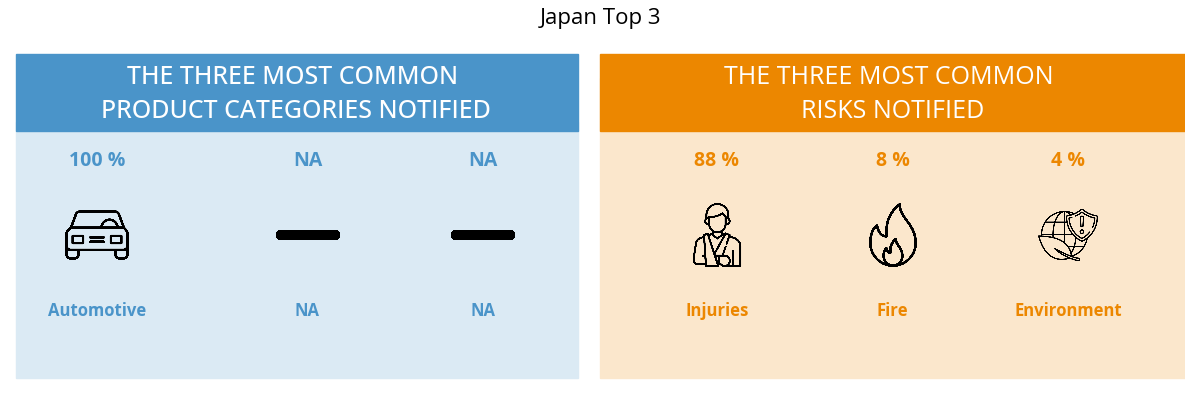 |
|
| Poland | 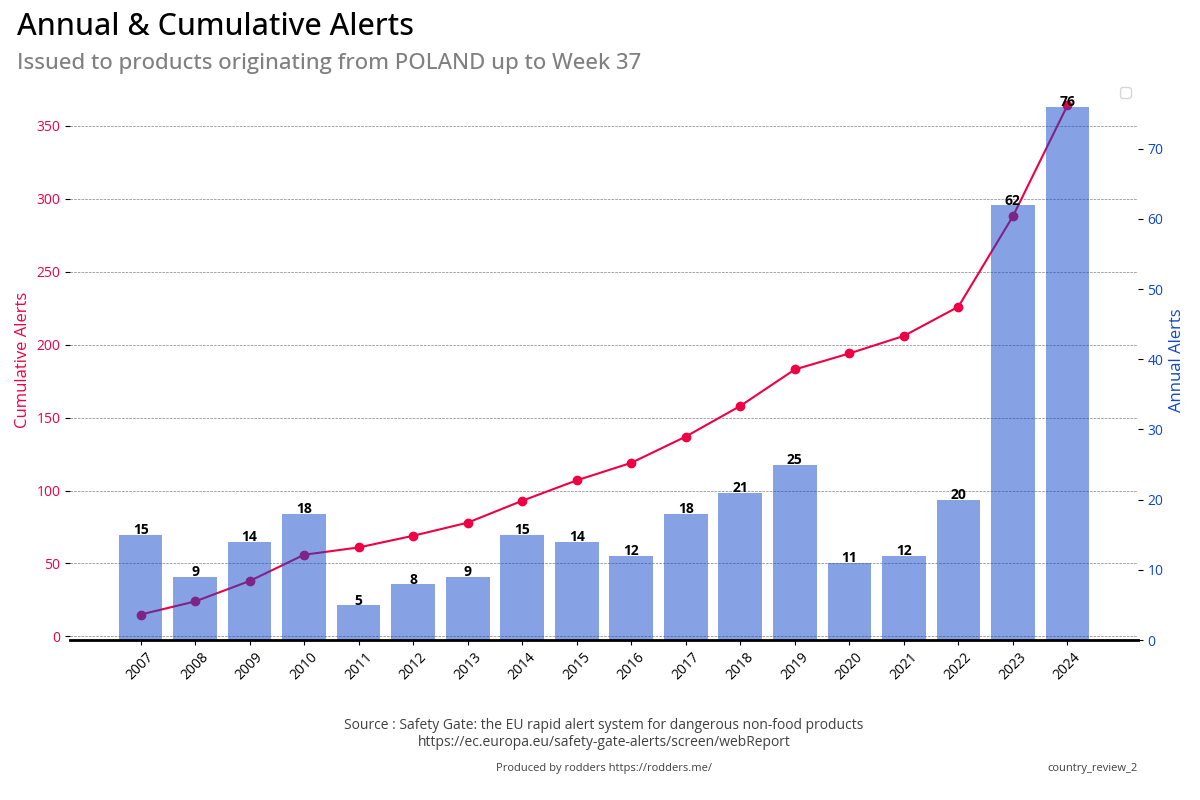 |
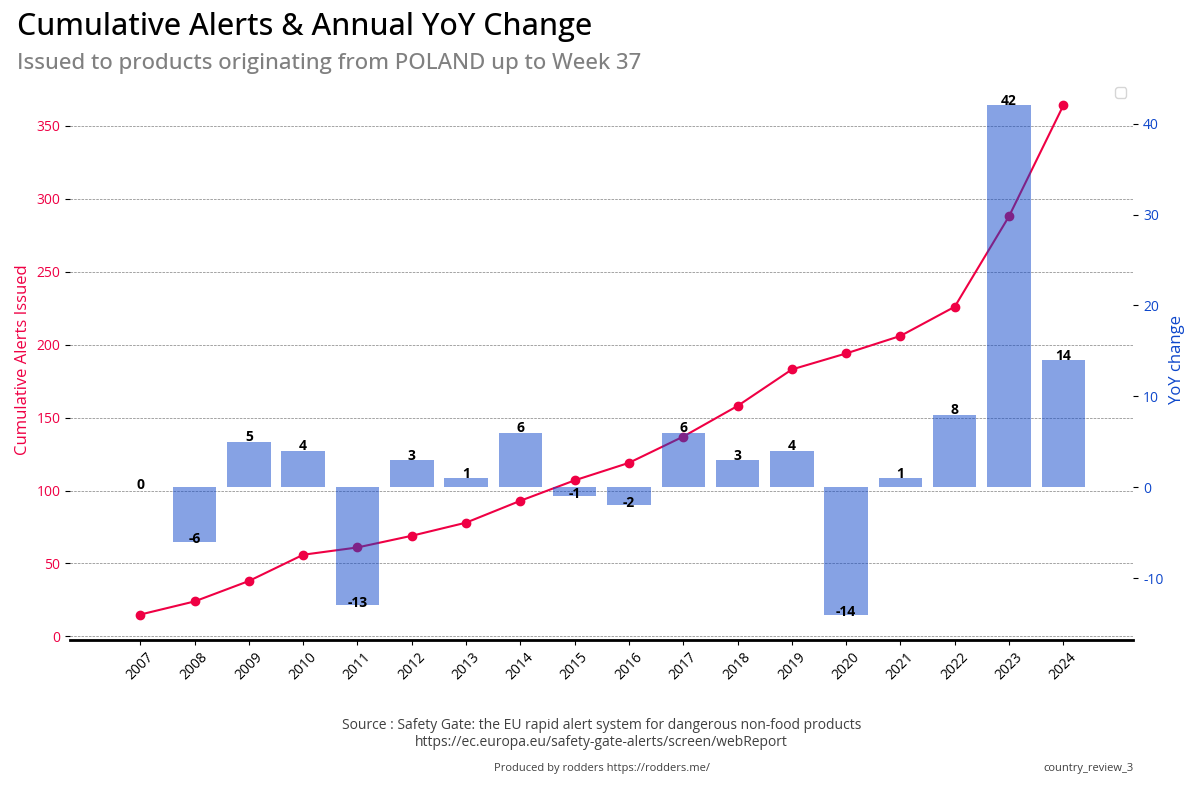
|
| Poland | 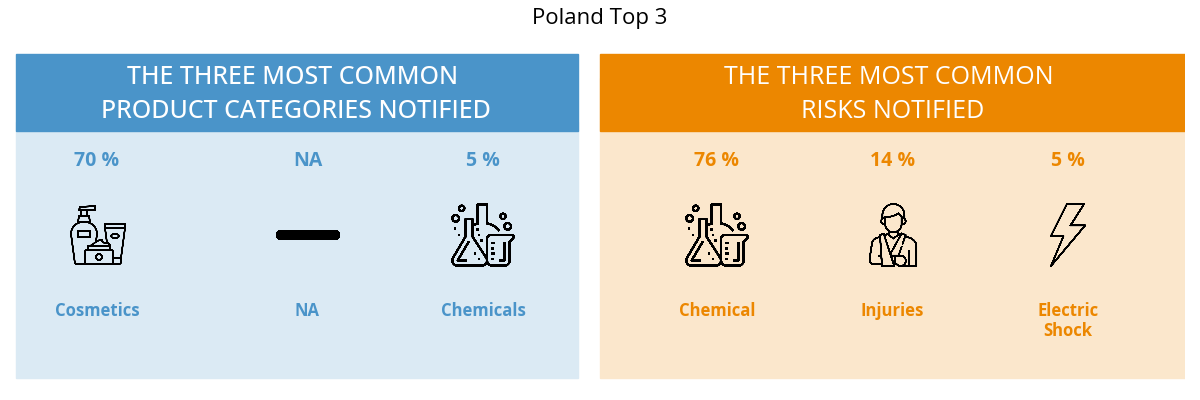 |
|
| Spain | 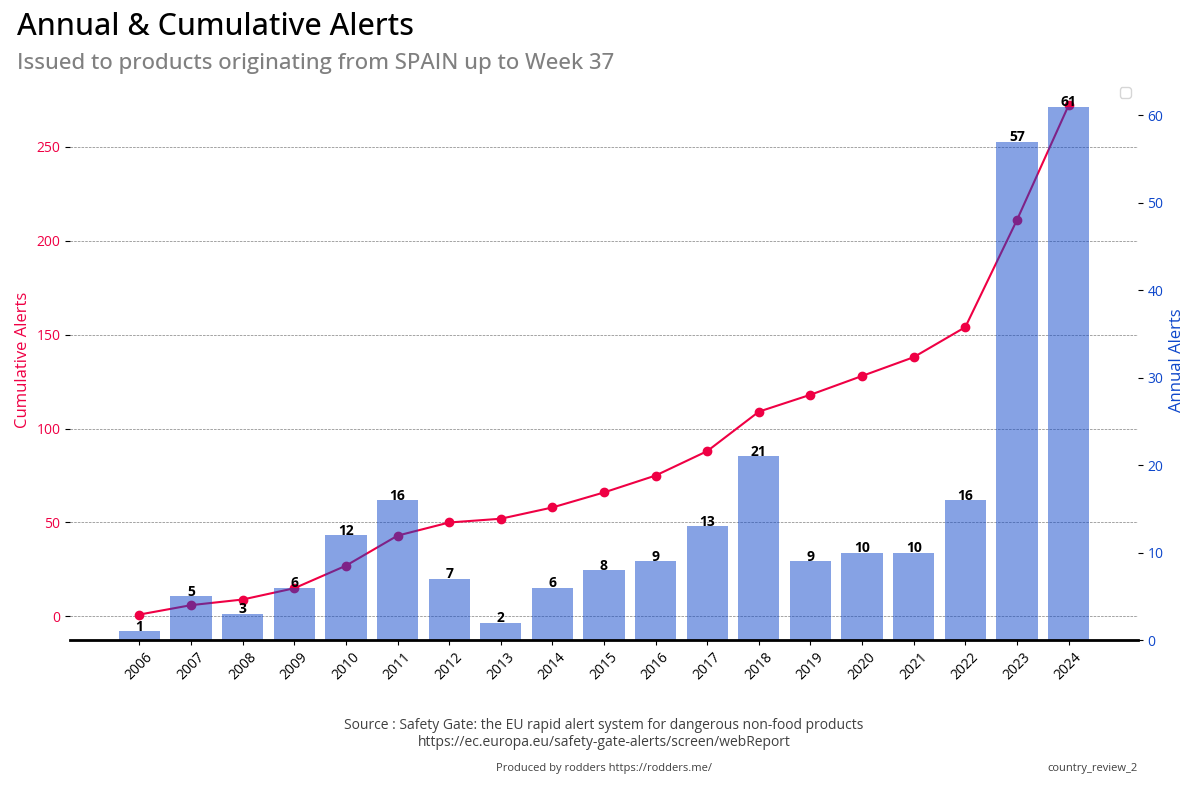 |
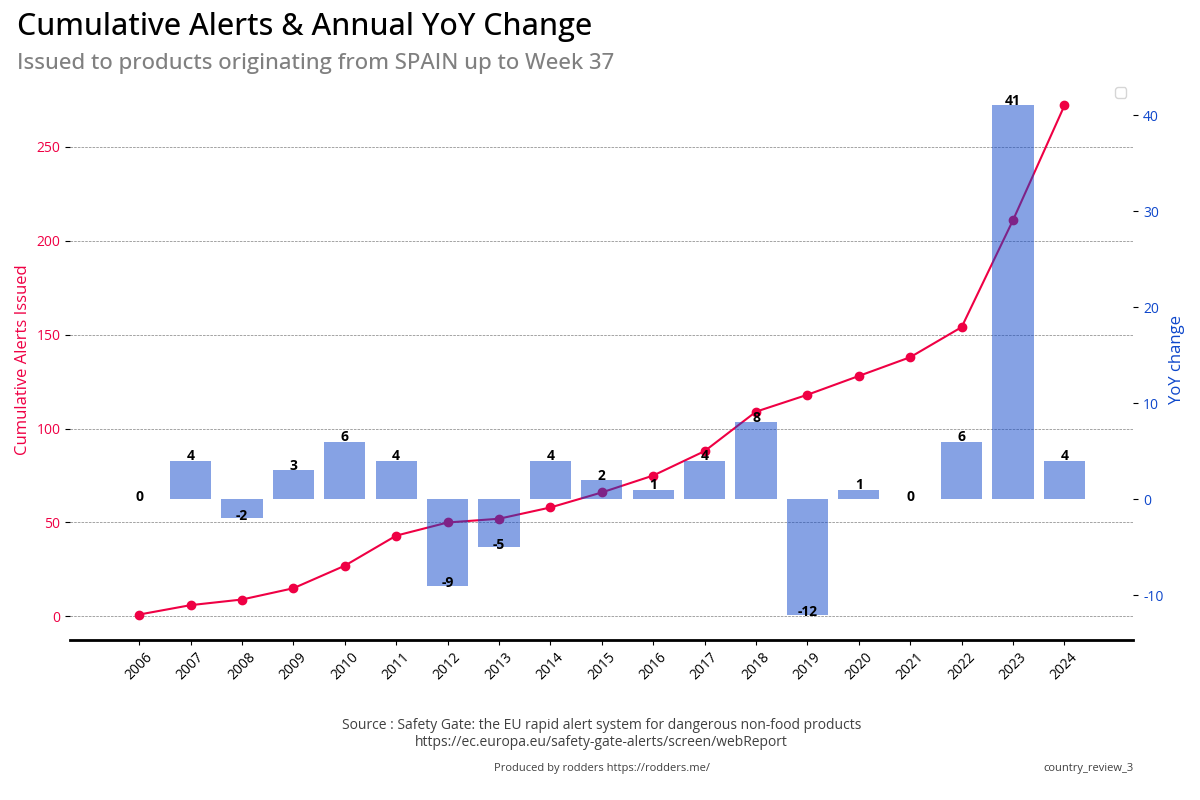
|
| Spain | 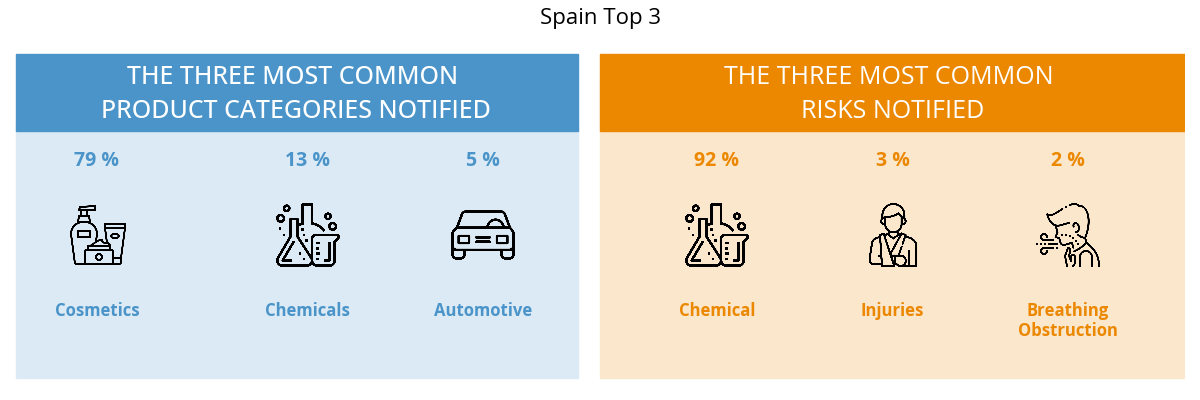 |
|
| Sweden | 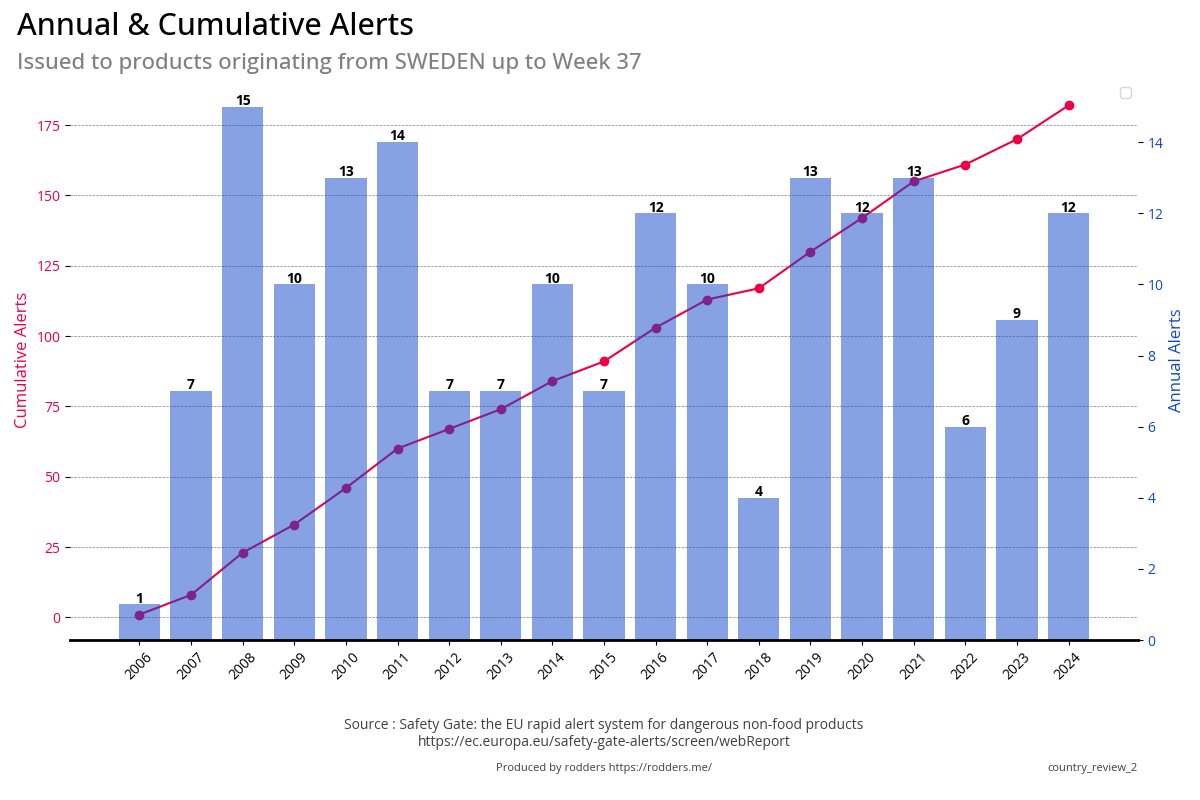 |
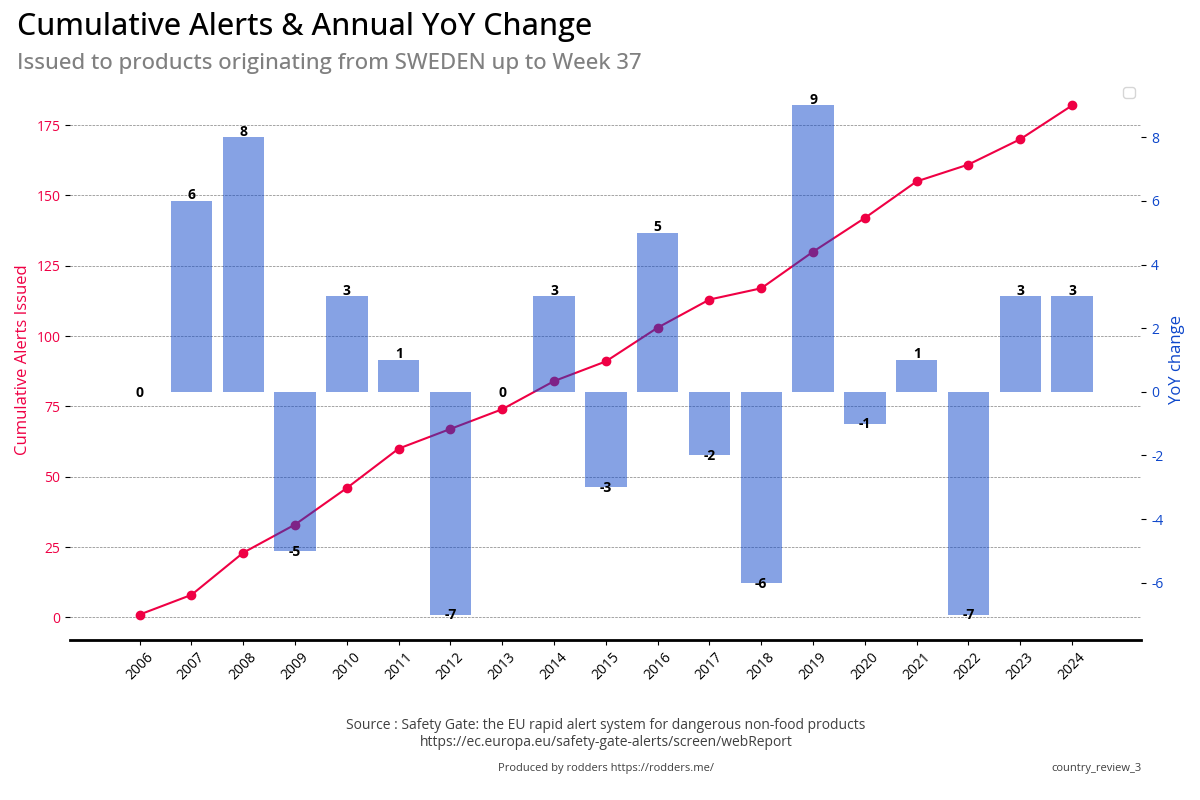
|
| Sweden | 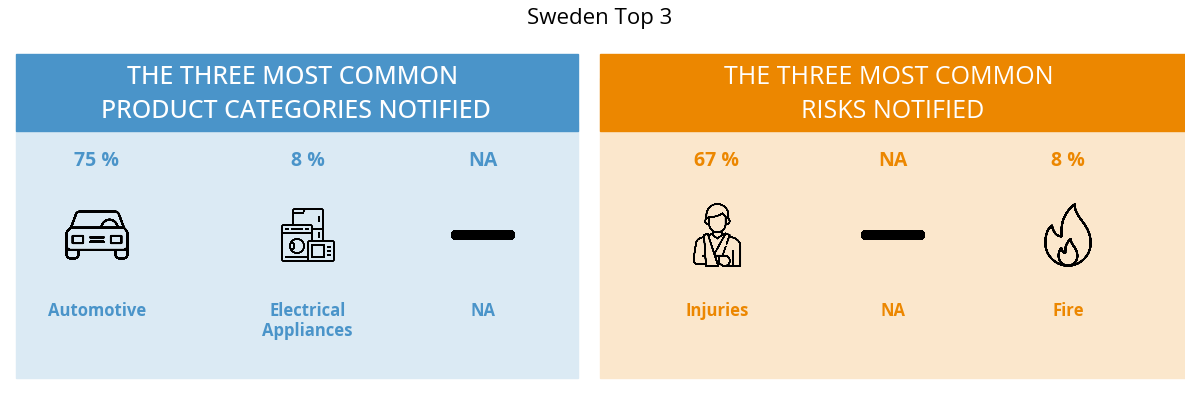 |
|
| Taiwan | 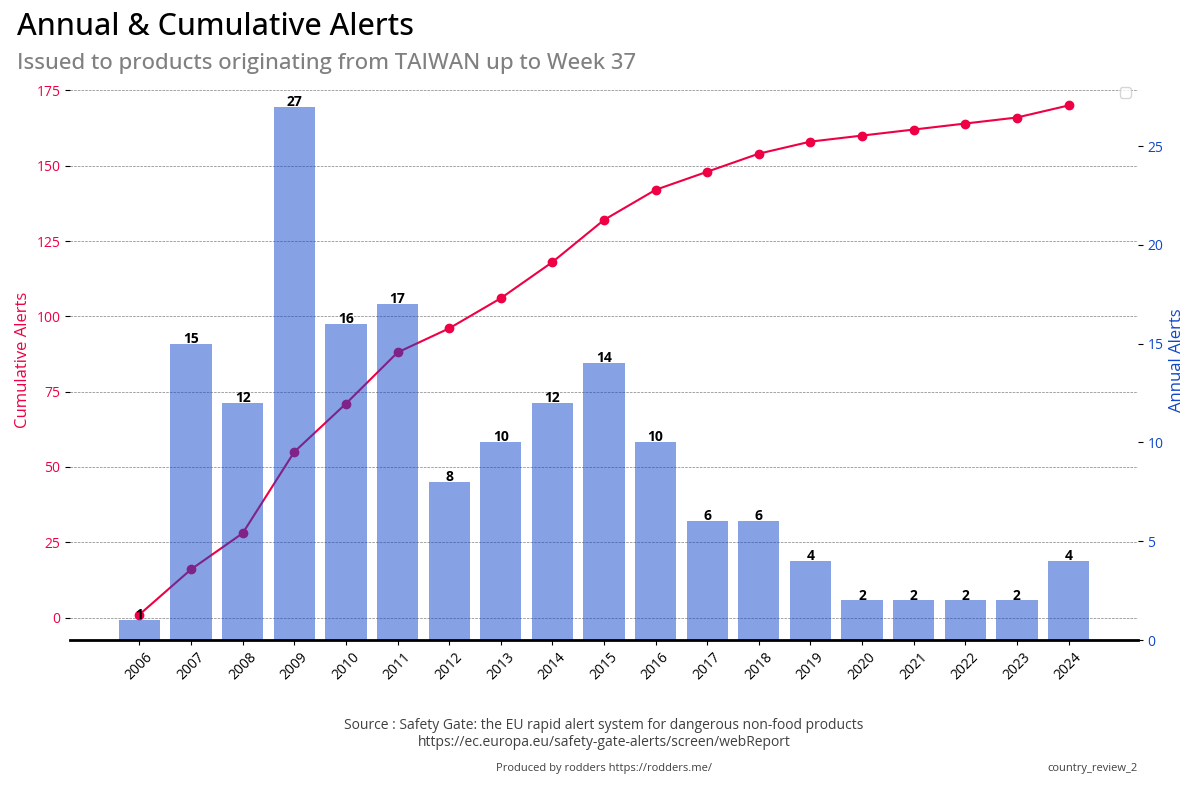 |
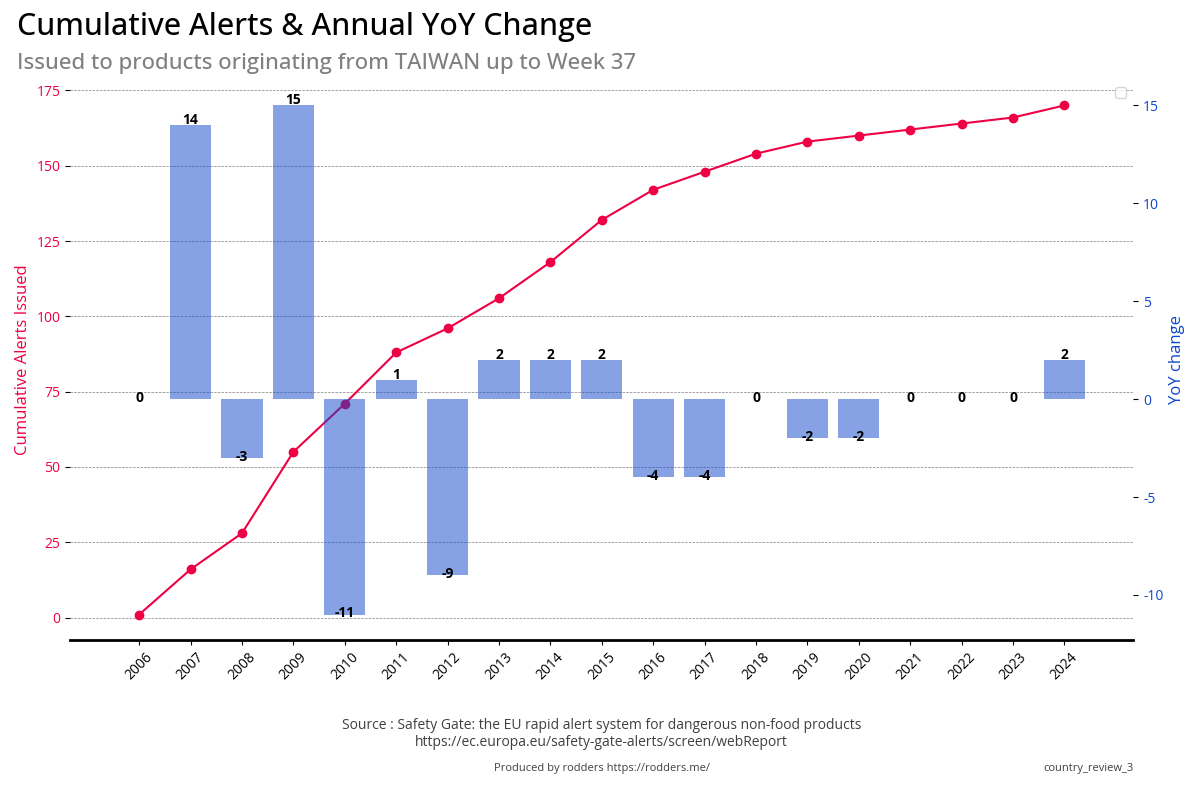
|
| Taiwan | 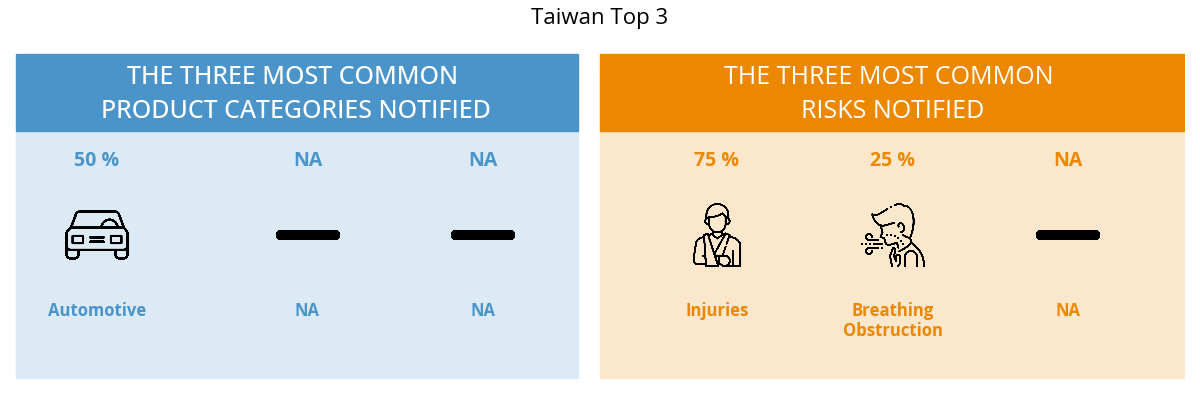 |
|
| UK | 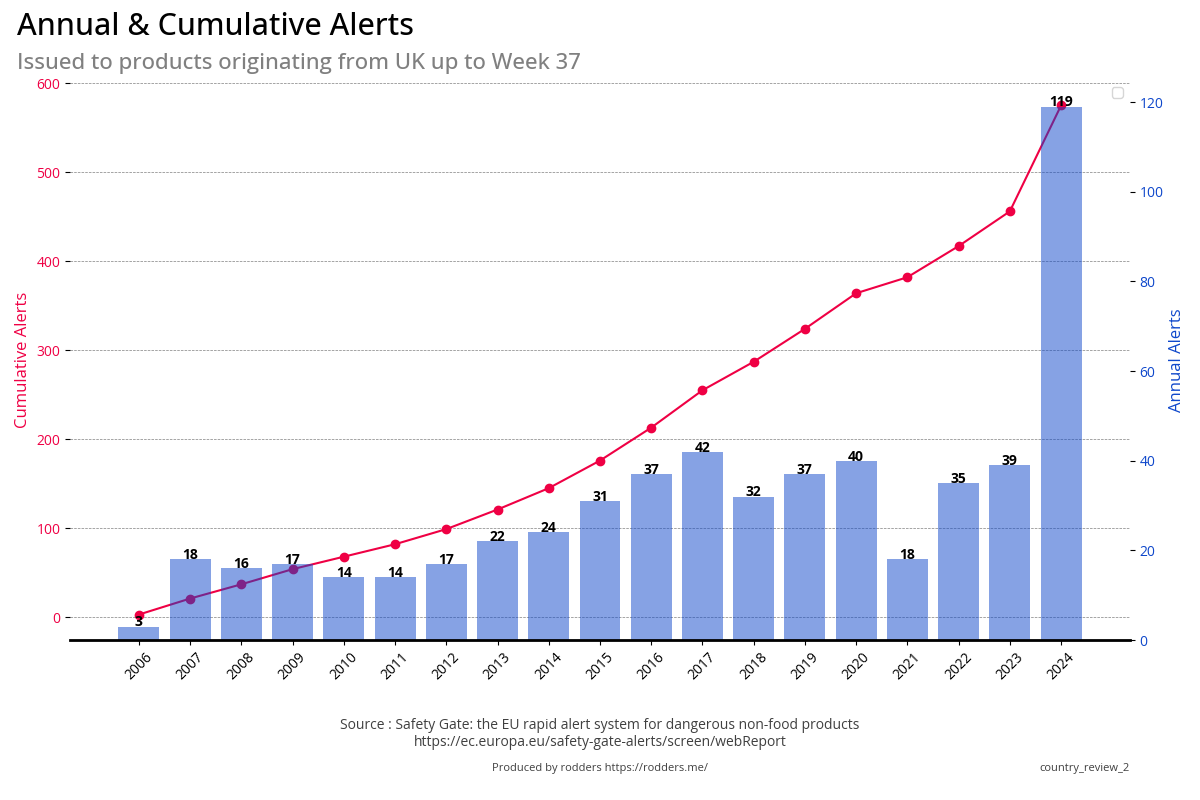 |
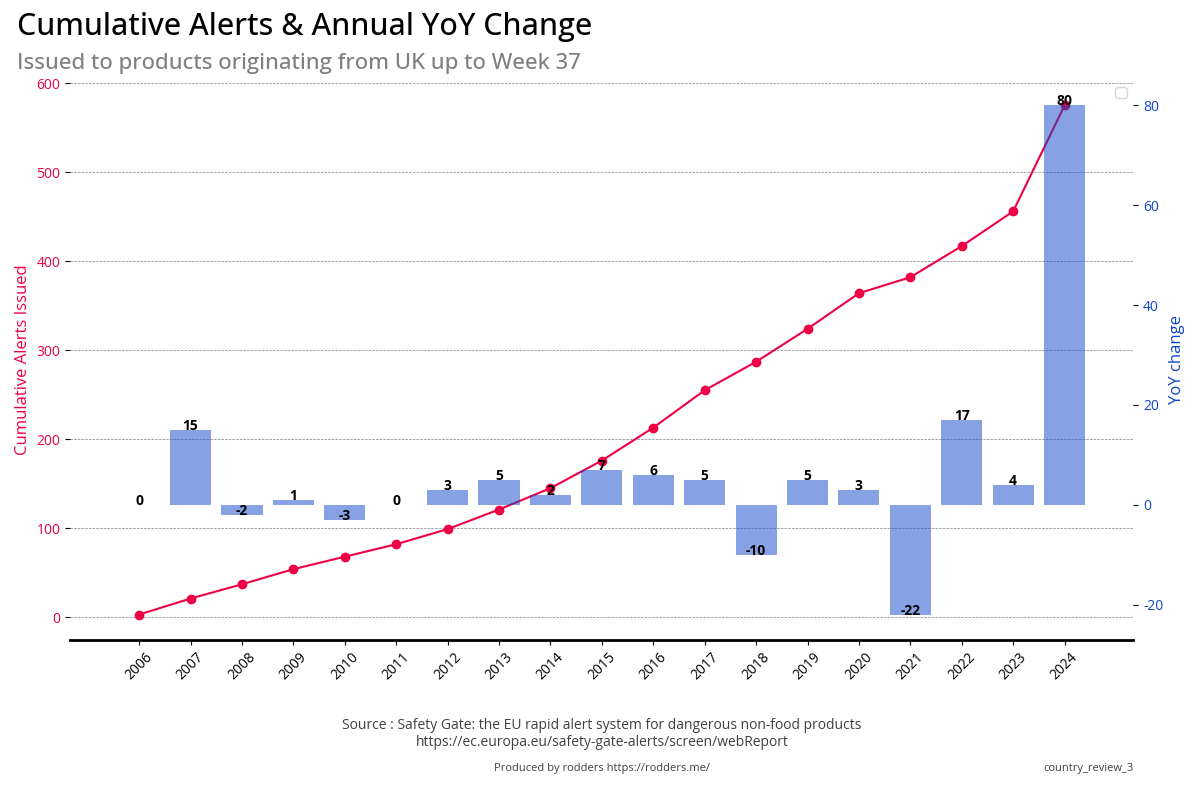 |
| UK | 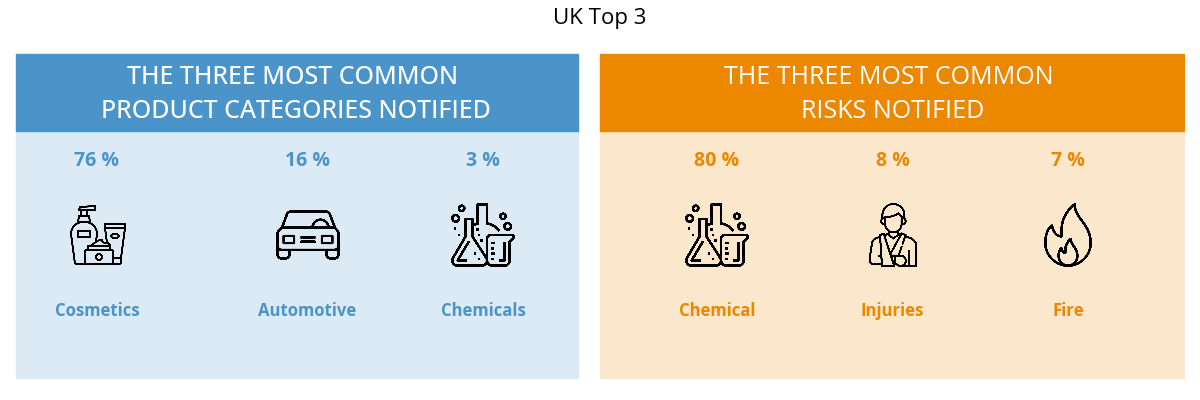 |
|
| USA | 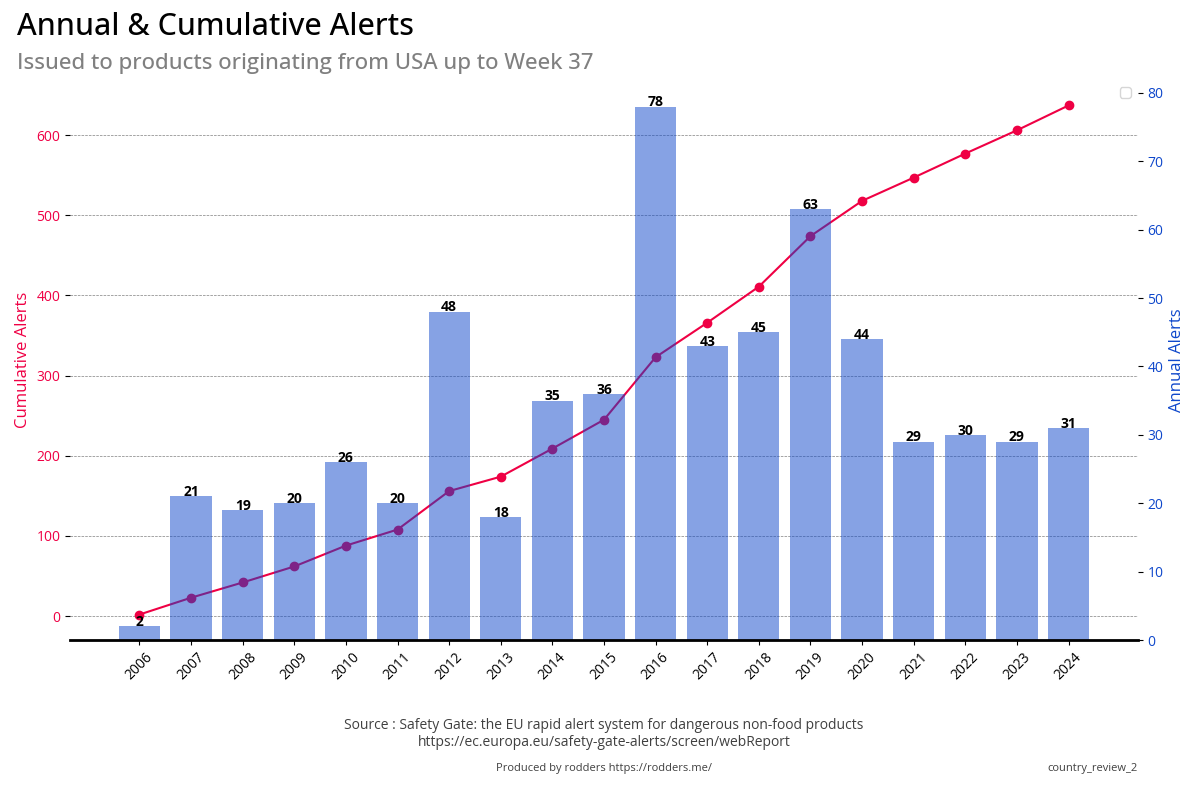 |
 |
| USA | 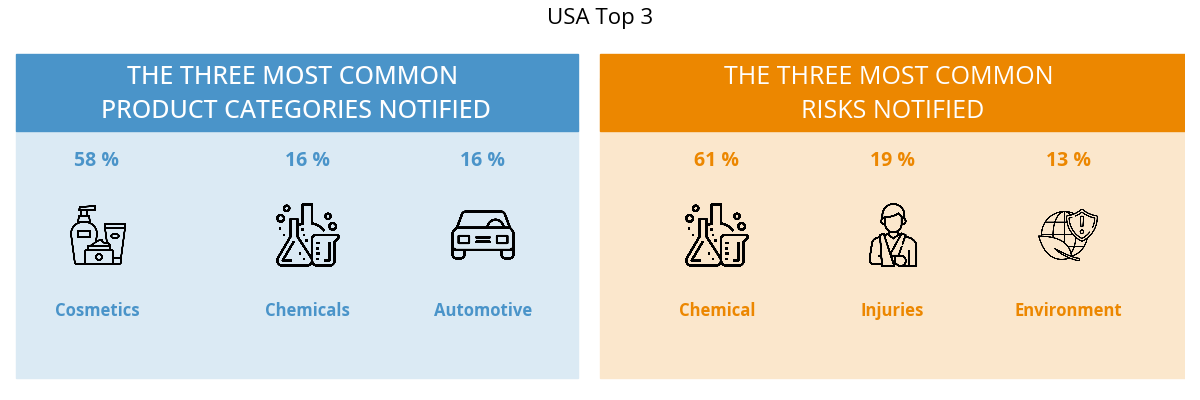 |
|
| Other | 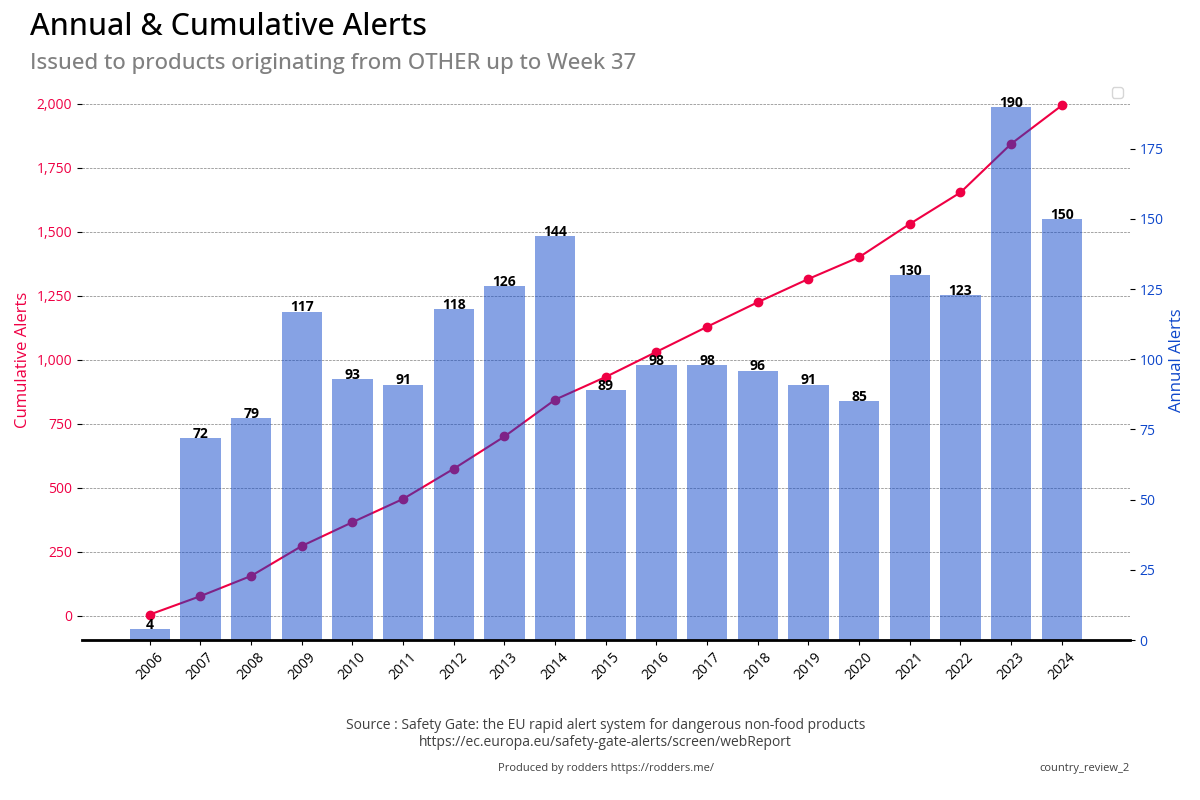 |
|
| Other |  |
|
| Unknown | 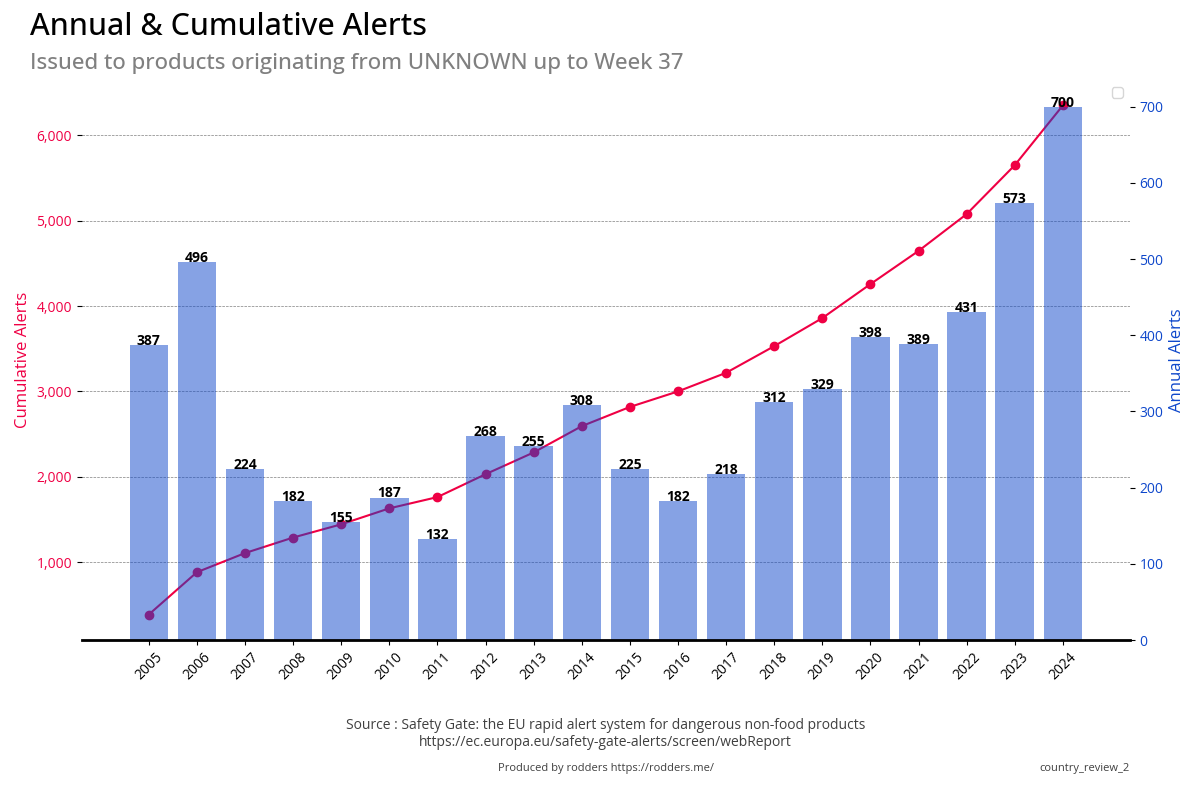 |
|
| Unknown | 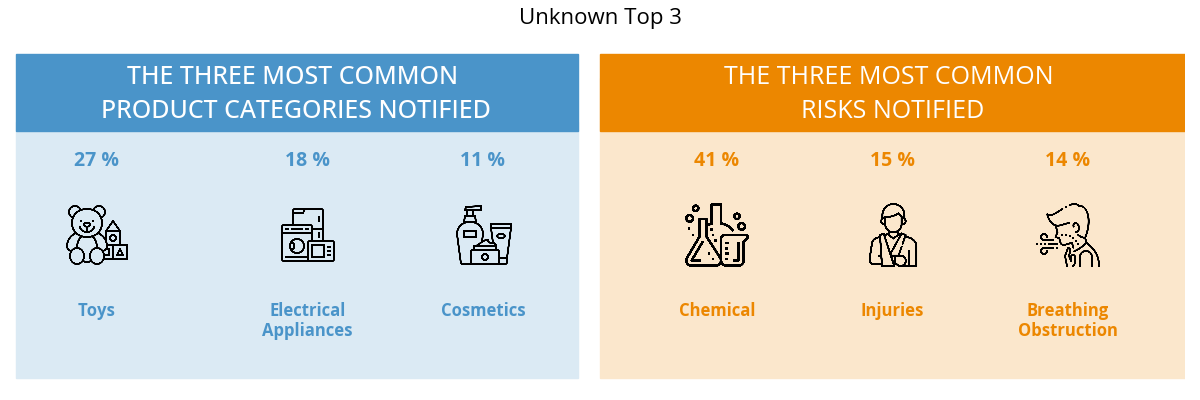 |
|
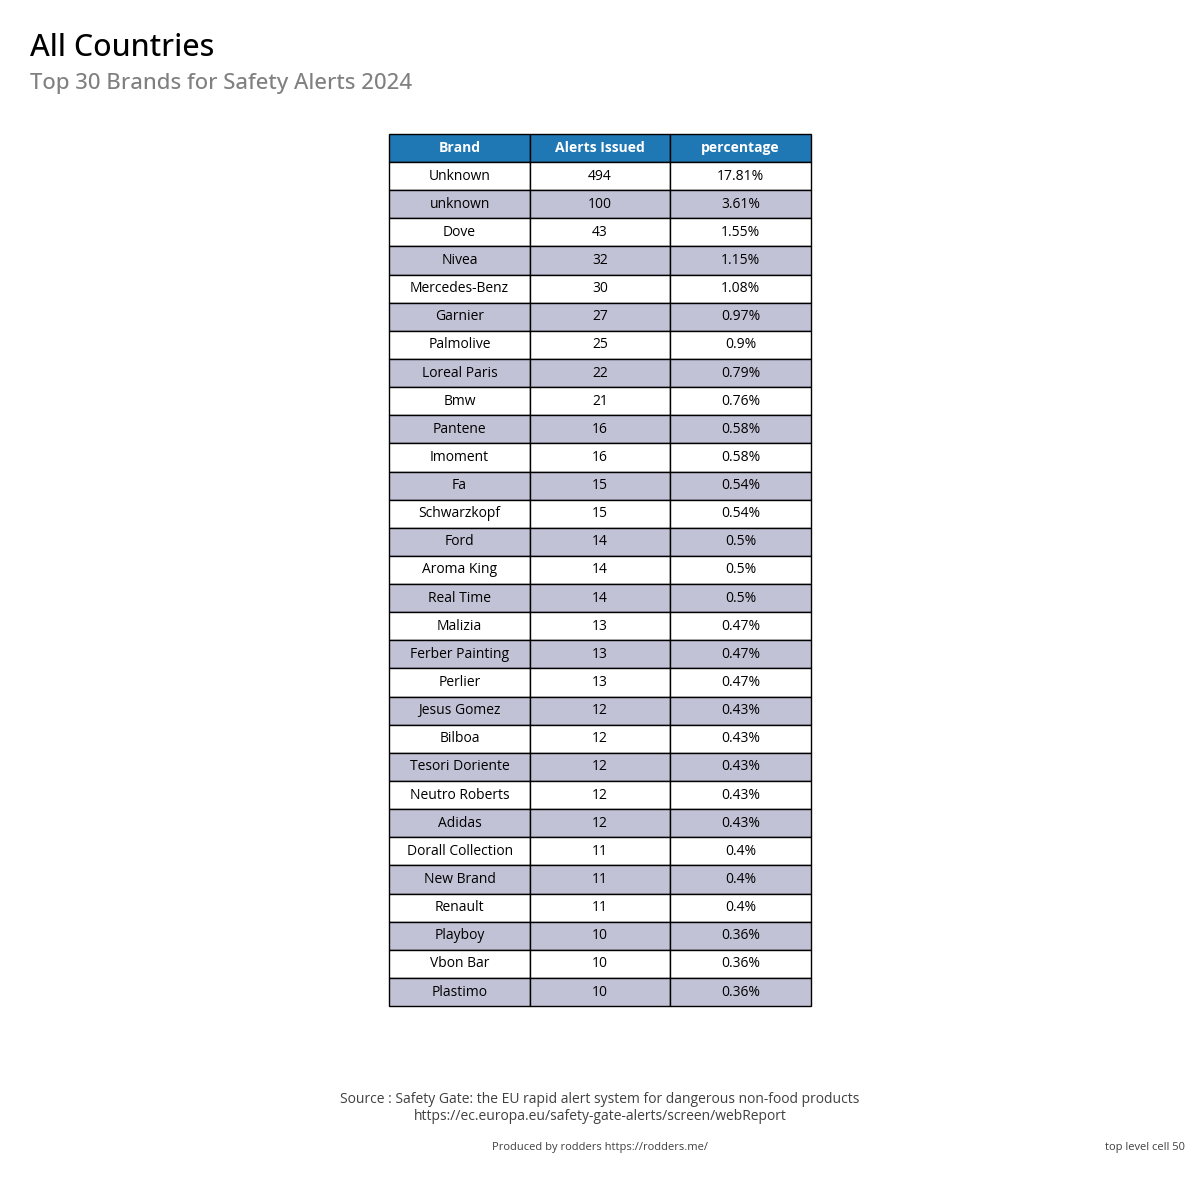
Top 30 Worldwide brands for Safety Alerts
Top 3 Worldwide Product Categories
#1 - Top 3 Product Categories
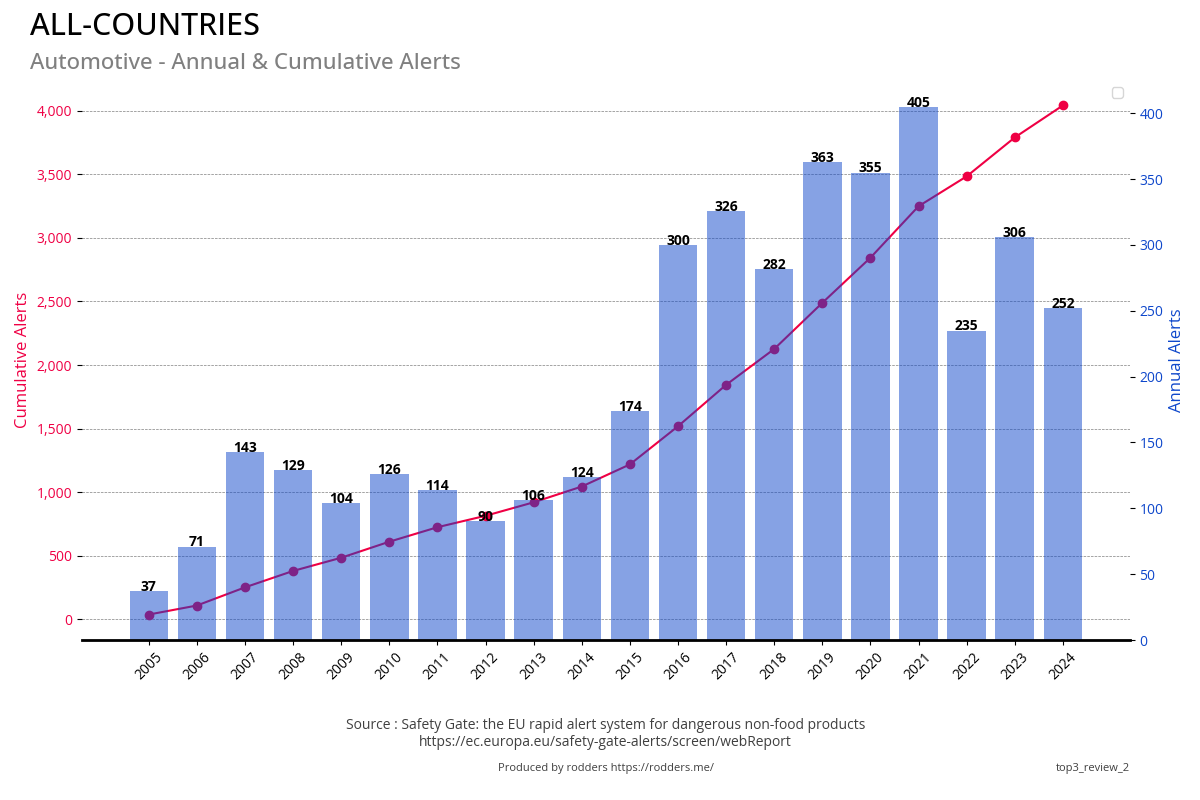
Total, Annual and Cumulative Alerts
| Annual Alerts | Cumulative Total and YoY Change |
|---|---|
|
|
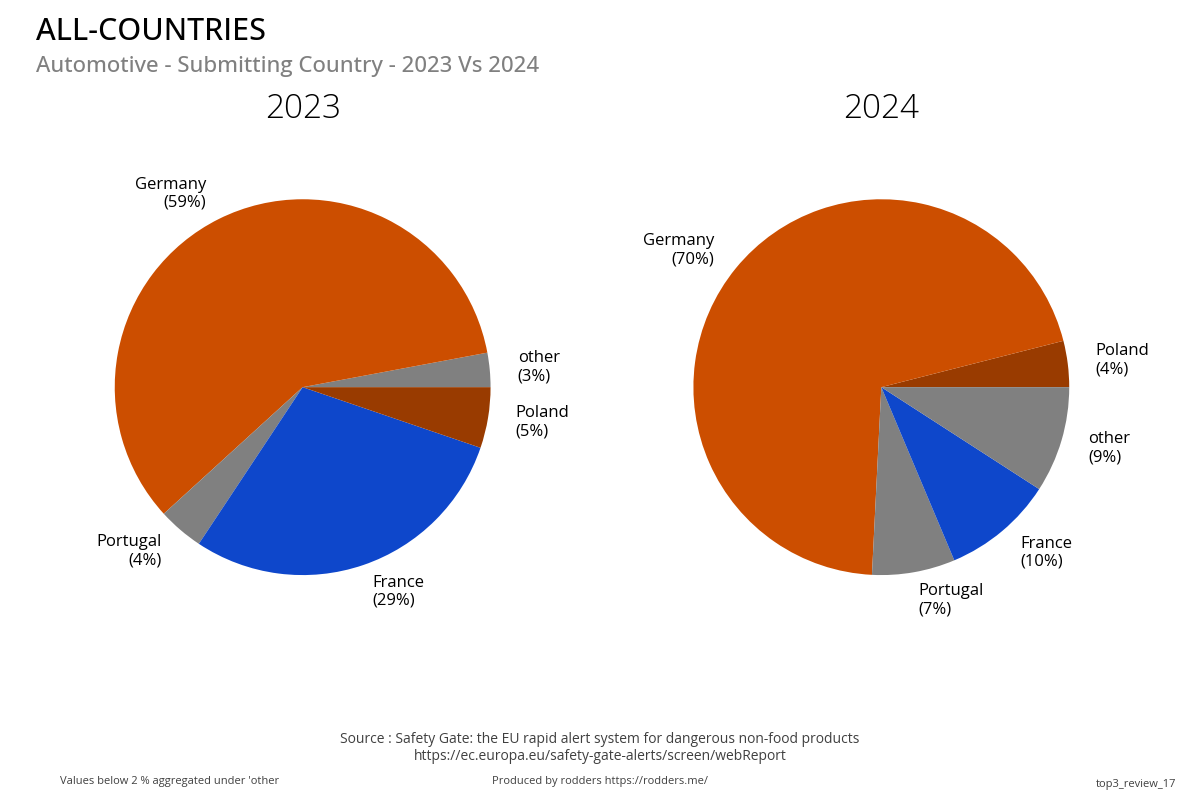
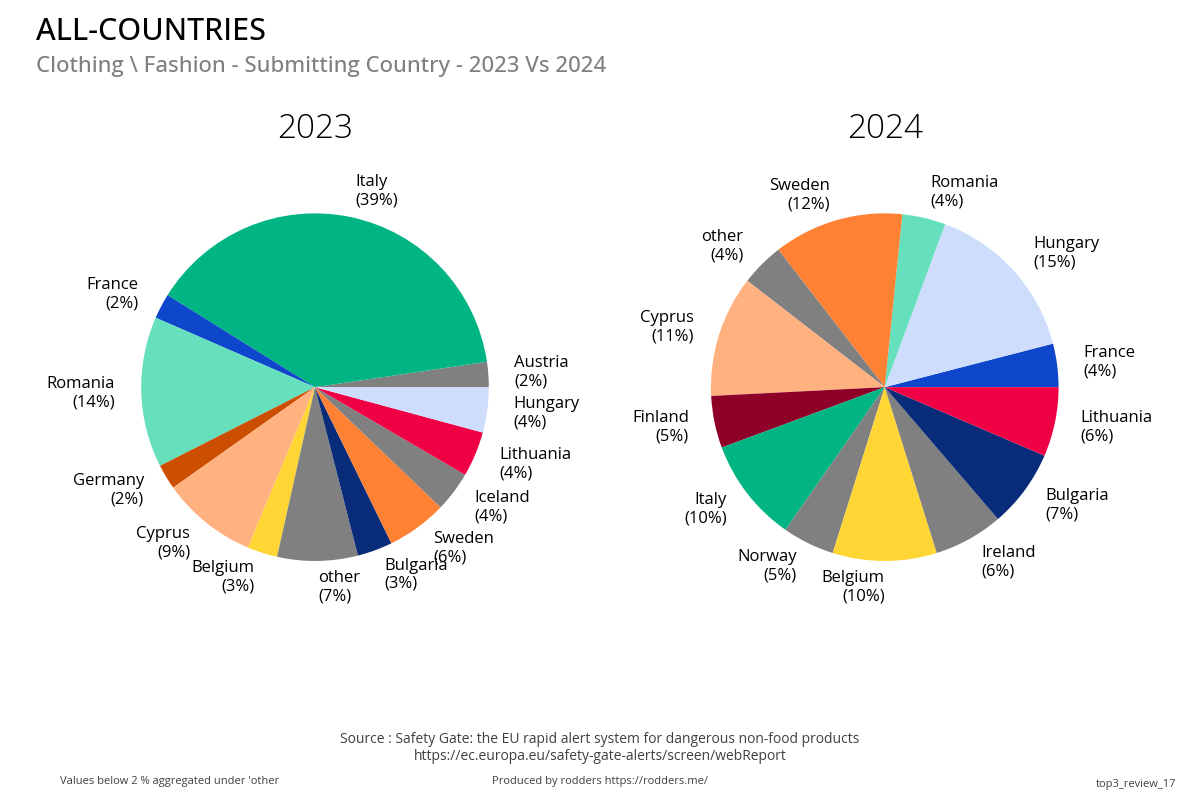
#1 - Submitting Country
Previous Year Vs Current Year
Annual Total and Annual Percentage of Total
| Annual Total | Annual % of total |
|---|---|
|
|
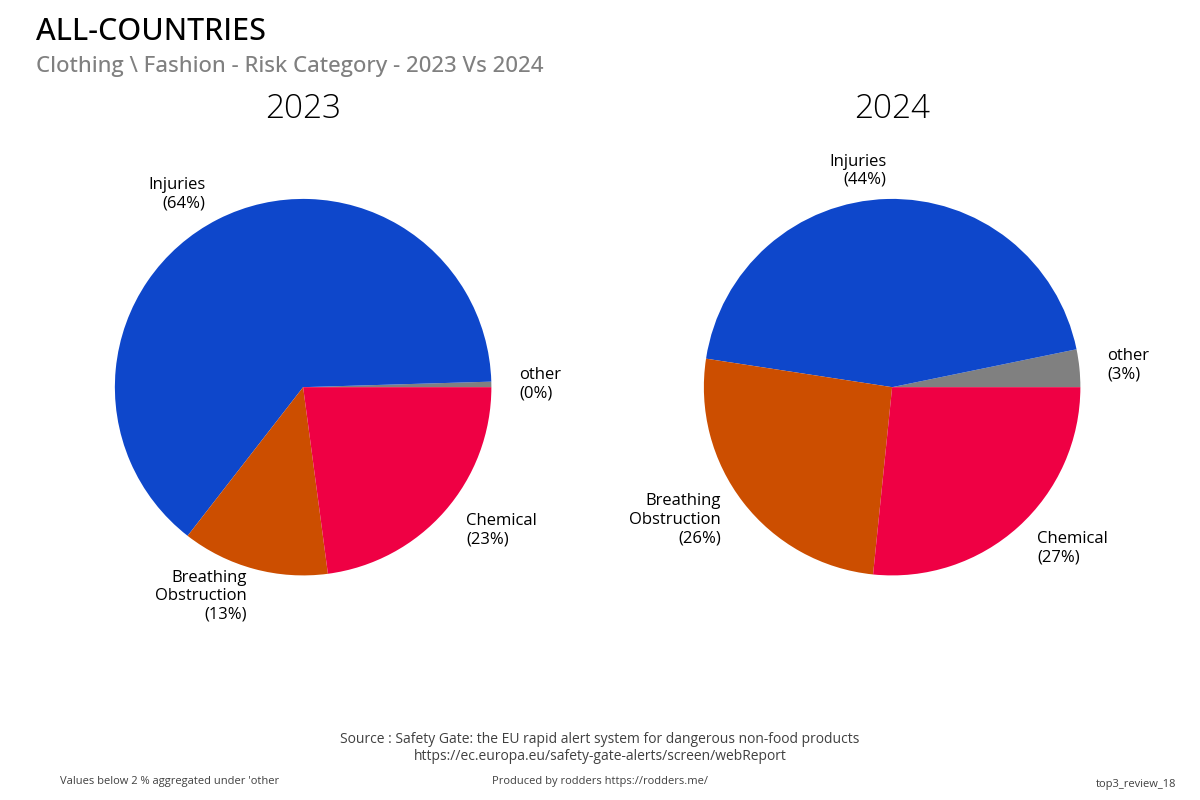
#1 - Risk Category
Previous Year Vs Current Year
Annual Total and Annual Percentage of Total
| Annual Total | Annual % of Total |
|---|---|
|
|
#1 - Counterfeit
Previous Year Vs Current Year
Annual Total and Annual Percentage of Total
| Annual Total | Annual % of Total |
|---|---|
|
|
#1 - Compulsory / Voluntary Action Required /Responsible Party
#1 - Compulsory / Voluntary Action Required
Previous Year Vs Current Year
Annual Total / Compulsory Vs Voluntary
Annual Total
Compulsory Vs Voluntary
Go to Top
#1 - Compulsory / Voluntary Responsible Party
Previous Year Vs Current Year
Annual Total / Compulsory Vs Voluntary
Annual Total
Compulsory Vs Voluntary
Go to Top
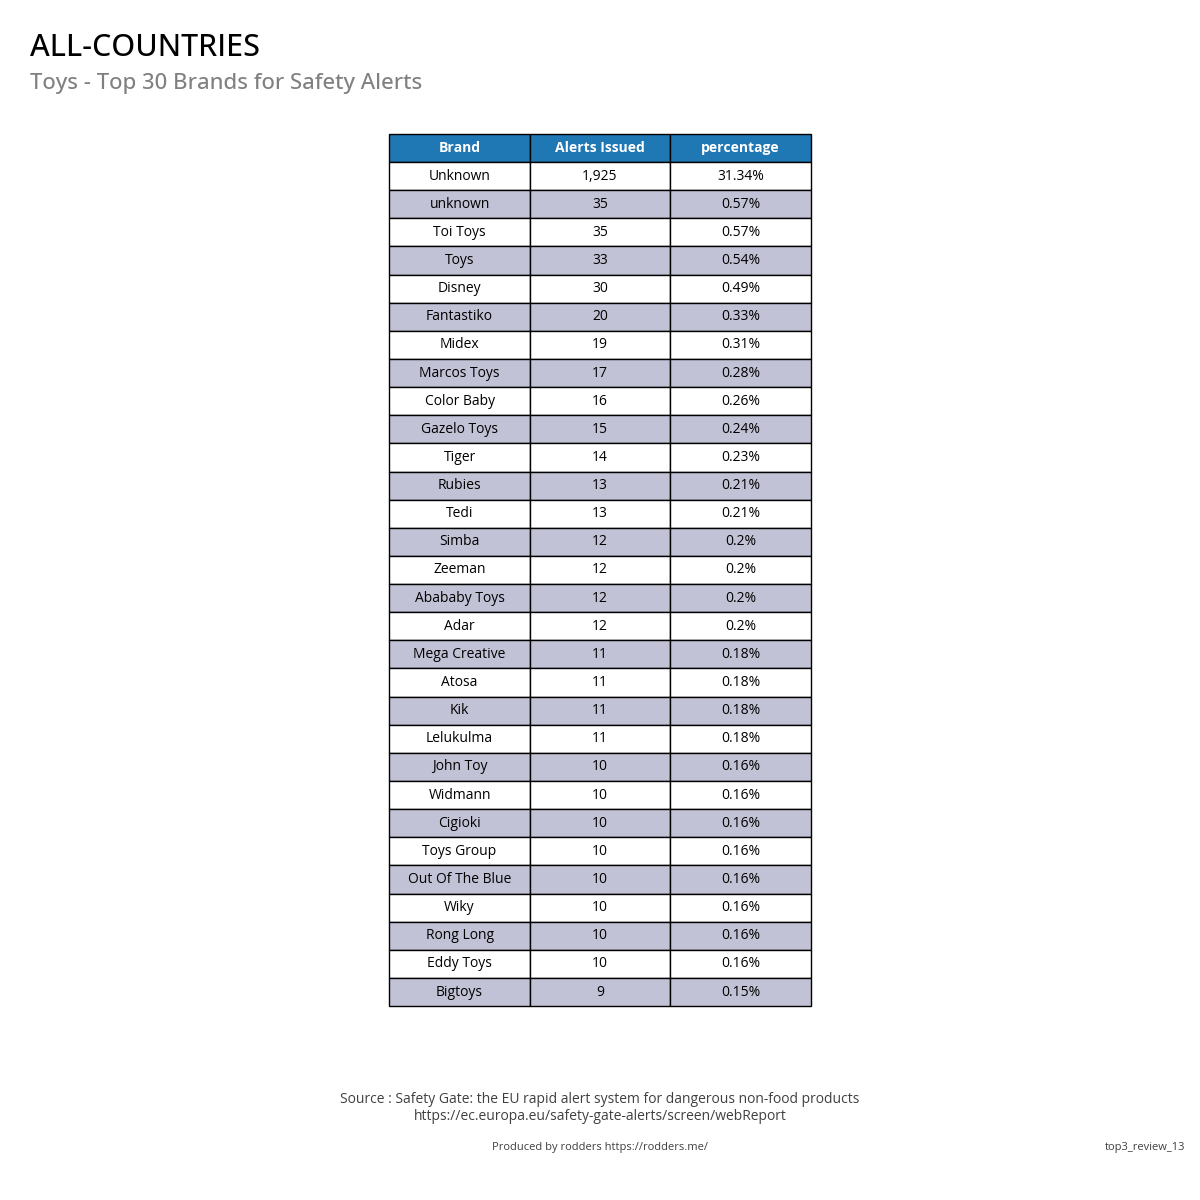
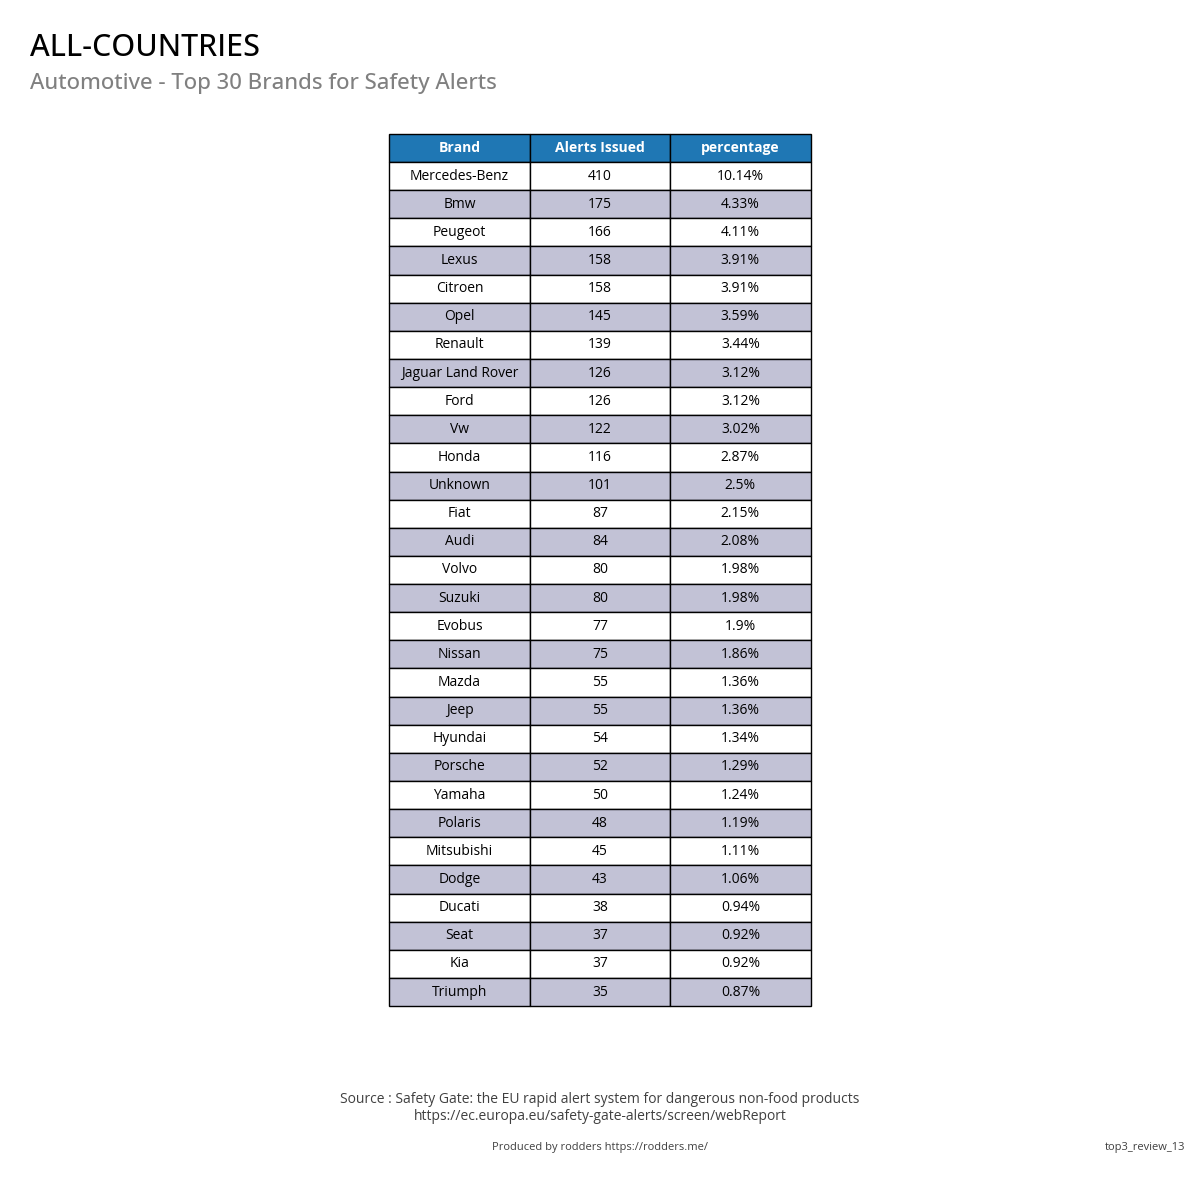
#1 - Top 30 Brands for Safety Alerts
Top 30 Brands
Go to Top
#2 - Top 3 Product Categories
Total, Annual and Cumulative Alerts
Annual Alerts
Cumulative Total and YoY Change
Go to Top
#2 - Submitting Country
Previous Year Vs Current Year
Annual Total / Annual Percentage of Total
Annual Total
Cumulative Total and YoY Change
Go to Top
#2 - Risk Category
Previous Year Vs Current Year
Annual Total / Annual Percentage of Total
Annual Total
Cumulative Total and YoY Change
Go to Top
#2 - Counterfeit
Previous Year Vs Current Year
Annual Total and Annual Percentage of Total
Annual Total
Cumulative Total and YoY Change
Go to Top
#2 - Compulsory / Voluntary Action Required / Responsible Party
#2 - Compulsory / Voluntary Action Required
Previous Year Vs Current Year
Annual Total
Compulsory Vs Voluntary Total
Go to Top
#2 - Compulsory / Voluntary Responsible Party
Previous Year Vs Current Year
Annual Total / Compulsory Vs Voluntary Total
Annual Total
Compulsory Vs Voluntary Total
Go to Top
#2 - Top Brands for Safety Alerts
Top 30 Brands
Go to Top
#3 - Top 3 Product Categories
Total, Annual and Cumulative Alerts
Annual Alerts
Cumulative Total and YoY Change
Go to Top
#3 - Submitting Country
Previous Year Vs Current Year
Annual Total and Annual Percentage of Total
Annual Total
Cumulative Total and YoY Change
Go to Top
#3 - Risk Category
Previous Year Vs Current Year
Annual Total and Annual Percentage of Total
Annual Total
Annual Percentage of Total
Go to Top
#3 - Counterfeit
Previous Year Vs Current Year
Annual Total and Annual Percentage of Total
Annual Total
Annual Percentage of Total
Go to Top
#3 - Annual Total and Compulsory Vs Voluntary Total
#3 - Compulsory / Voluntary Action Required
Previous Year Vs Current Year
Annual Total
Compulsory Vs Voluntary Total
Go to Top
#3 - Compulsory / Voluntary Responsible Party
Previous Year Vs Current Year
#3 - Annual / Total Compulsory Vs Voluntary Total
Annual Total
Compulsory Vs Voluntary Total
Go to Top
#3 - Top Brands for Safety Alerts
| Annual Total | Compulsory Vs Voluntary |
|---|---|
|
|
|
| Annual Total | Compulsory Vs Voluntary |
|---|---|
|
|
|
#1 - Top 30 Brands for Safety Alerts
| Top 30 Brands |
|---|
|
|
#2 - Top 3 Product Categories
Total, Annual and Cumulative Alerts
| Annual Alerts | Cumulative Total and YoY Change |
|---|---|
|
|
|
#2 - Submitting Country
Previous Year Vs Current Year
Annual Total / Annual Percentage of Total
Annual Total
Cumulative Total and YoY Change
Go to Top
#2 - Risk Category
Previous Year Vs Current Year
Annual Total / Annual Percentage of Total
Annual Total
Cumulative Total and YoY Change
Go to Top
#2 - Counterfeit
Previous Year Vs Current Year
Annual Total and Annual Percentage of Total
Annual Total
Cumulative Total and YoY Change
Go to Top
#2 - Compulsory / Voluntary Action Required / Responsible Party
#2 - Compulsory / Voluntary Action Required
Previous Year Vs Current Year
Annual Total
Compulsory Vs Voluntary Total
Go to Top
#2 - Compulsory / Voluntary Responsible Party
Previous Year Vs Current Year
Annual Total / Compulsory Vs Voluntary Total
Annual Total
Compulsory Vs Voluntary Total
Go to Top
#2 - Top Brands for Safety Alerts
Top 30 Brands
Go to Top
#3 - Top 3 Product Categories
Total, Annual and Cumulative Alerts
Annual Alerts
Cumulative Total and YoY Change
Go to Top
#3 - Submitting Country
Previous Year Vs Current Year
Annual Total and Annual Percentage of Total
Annual Total
Cumulative Total and YoY Change
Go to Top
#3 - Risk Category
Previous Year Vs Current Year
Annual Total and Annual Percentage of Total
Annual Total
Annual Percentage of Total
Go to Top
#3 - Counterfeit
Previous Year Vs Current Year
Annual Total and Annual Percentage of Total
Annual Total
Annual Percentage of Total
Go to Top
#3 - Annual Total and Compulsory Vs Voluntary Total
#3 - Compulsory / Voluntary Action Required
Previous Year Vs Current Year
Annual Total
Compulsory Vs Voluntary Total
Go to Top
#3 - Compulsory / Voluntary Responsible Party
Previous Year Vs Current Year
#3 - Annual / Total Compulsory Vs Voluntary Total
Annual Total
Compulsory Vs Voluntary Total
Go to Top
#3 - Top Brands for Safety Alerts
| Annual Total | Cumulative Total and YoY Change |
|---|---|
|
|
|
| Annual Total | Cumulative Total and YoY Change |
|---|---|
|
|
|
| Annual Total | Cumulative Total and YoY Change |
|---|---|
|
|
|
| Annual Total | Compulsory Vs Voluntary Total |
|---|---|
|
|
|
| Annual Total | Compulsory Vs Voluntary Total |
|---|---|
|
|
|
| Top 30 Brands |
|---|
|
|
| Annual Alerts | Cumulative Total and YoY Change |
|---|---|
|
|
|
| Annual Total | Cumulative Total and YoY Change |
|---|---|
|
|
|
| Annual Total | Annual Percentage of Total |
|---|---|
|
|
|
| Annual Total | Annual Percentage of Total |
|---|---|
|
|
|
#3 - Annual Total and Compulsory Vs Voluntary Total
#3 - Compulsory / Voluntary Action Required
Previous Year Vs Current Year
| Annual Total | Compulsory Vs Voluntary Total |
|---|---|
|
|
|
#3 - Compulsory / Voluntary Responsible Party
Previous Year Vs Current Year
#3 - Annual / Total Compulsory Vs Voluntary Total
| Annual Total | Compulsory Vs Voluntary Total |
|---|---|
|
|
|