Jump to section
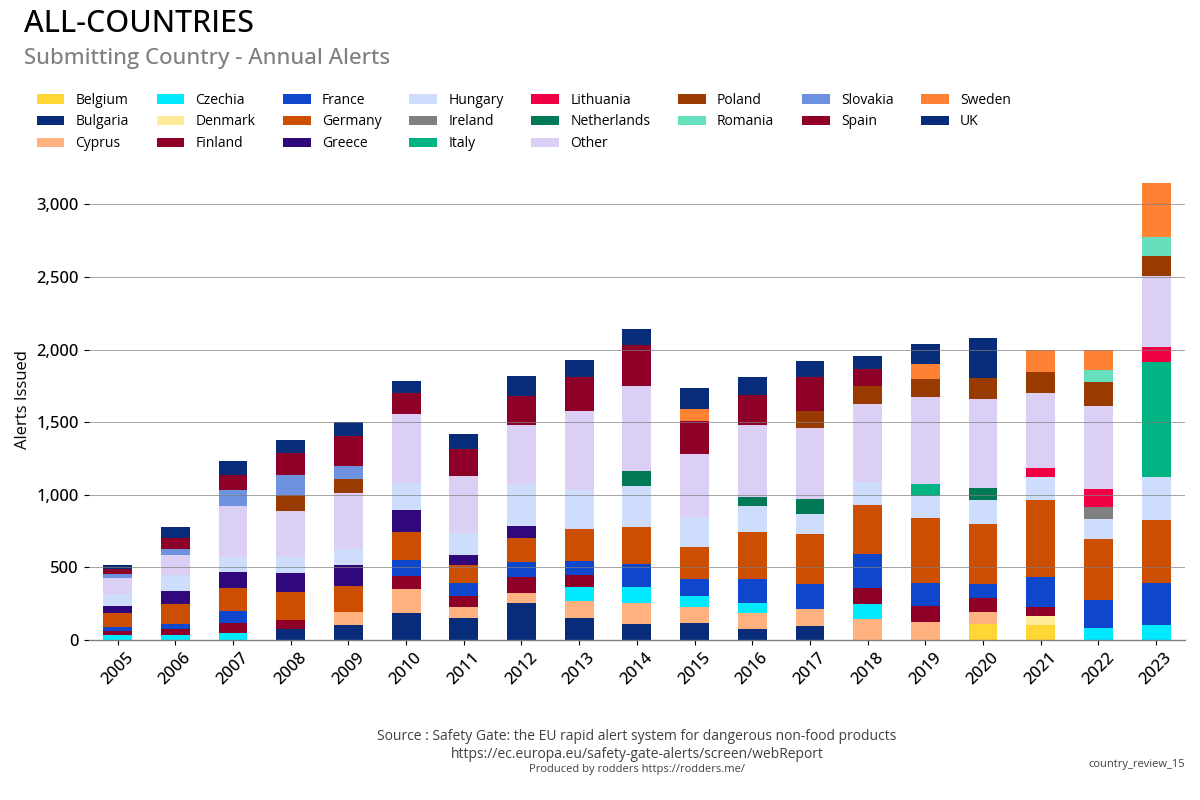
Annual Alerts
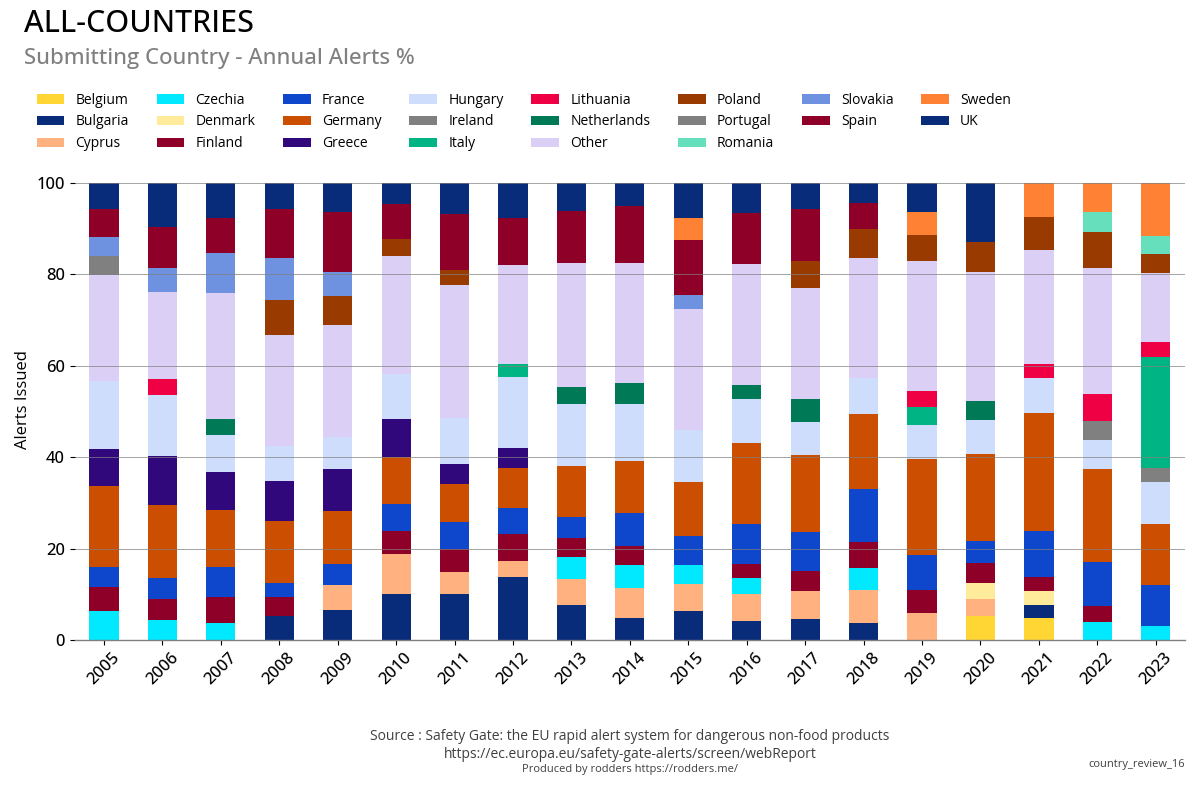
Submitting Country
Map Plot Previous Year Vs Current Year
Which countries' products get the most alerts?
Economic Area of Product origin Previous Year Vs Current Year
Country of Product Origin
Annual Alerts
Product Categories
Risk Category
Counterfeit type
Action Required
Responsible Party
Top 30 Worldwide brands for Safety Alerts
Top 15 Countries - Key Fact sheets
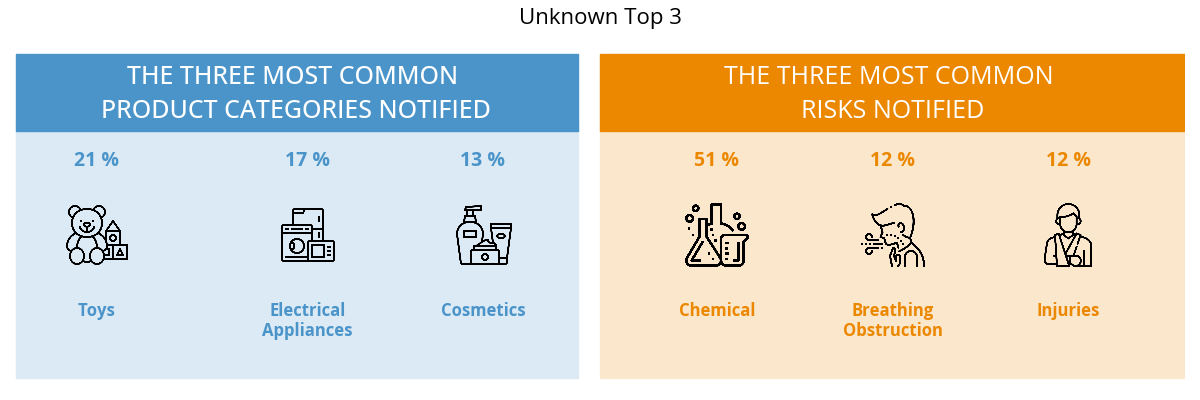
Top 3 Worldwide Product Categories
#1 - Top 3 Product Categories
#1 - Total, Annual and Cumulative Alerts
#1 - Submitting Country
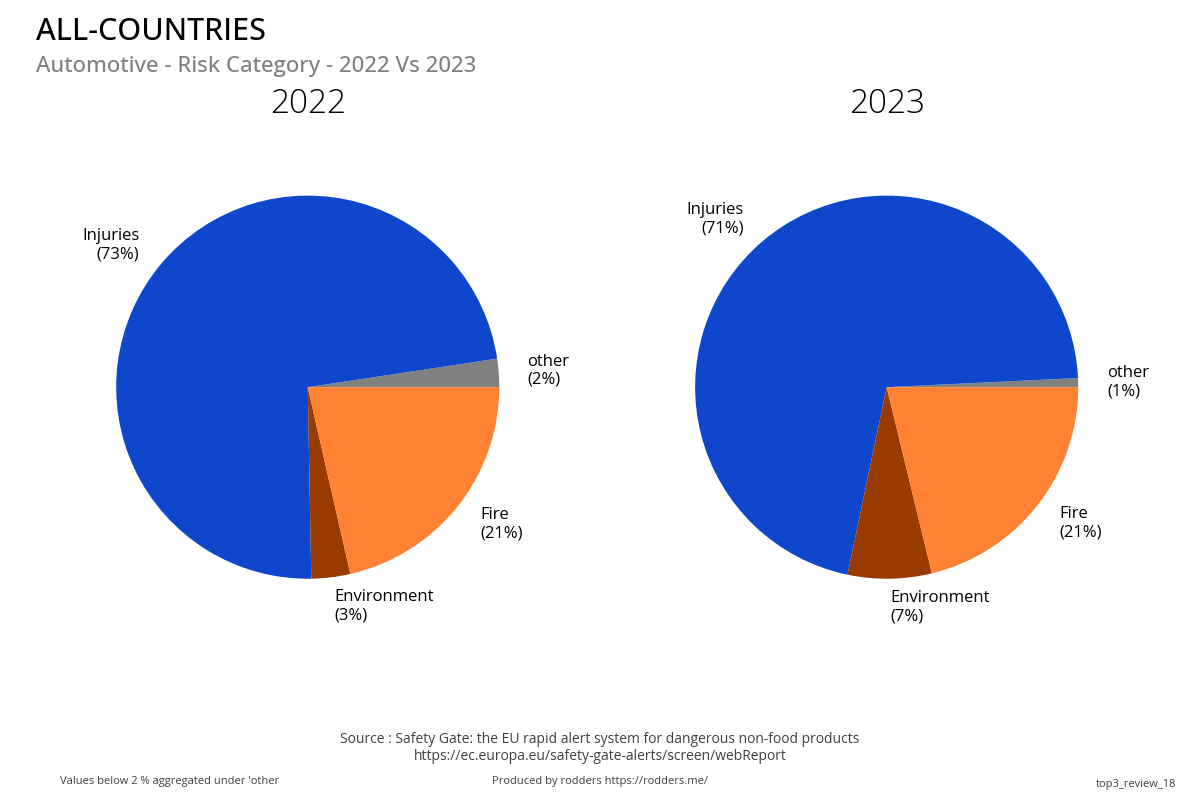
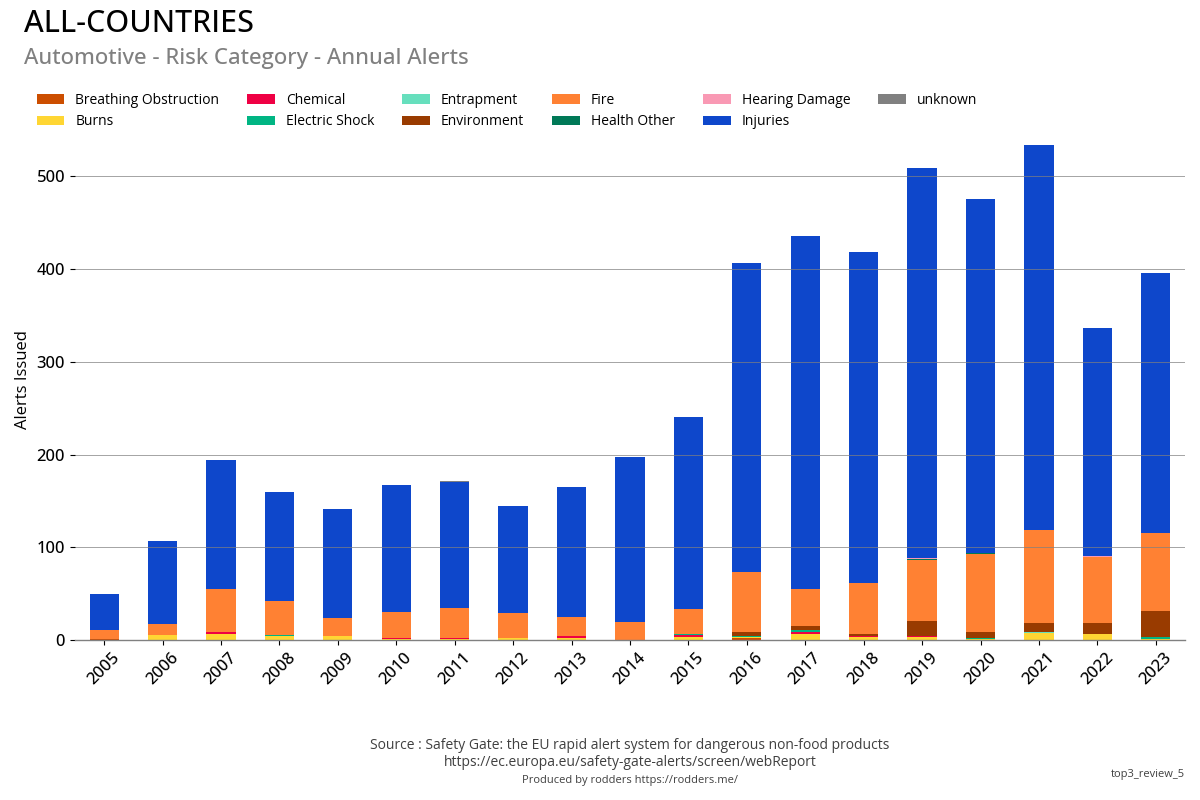
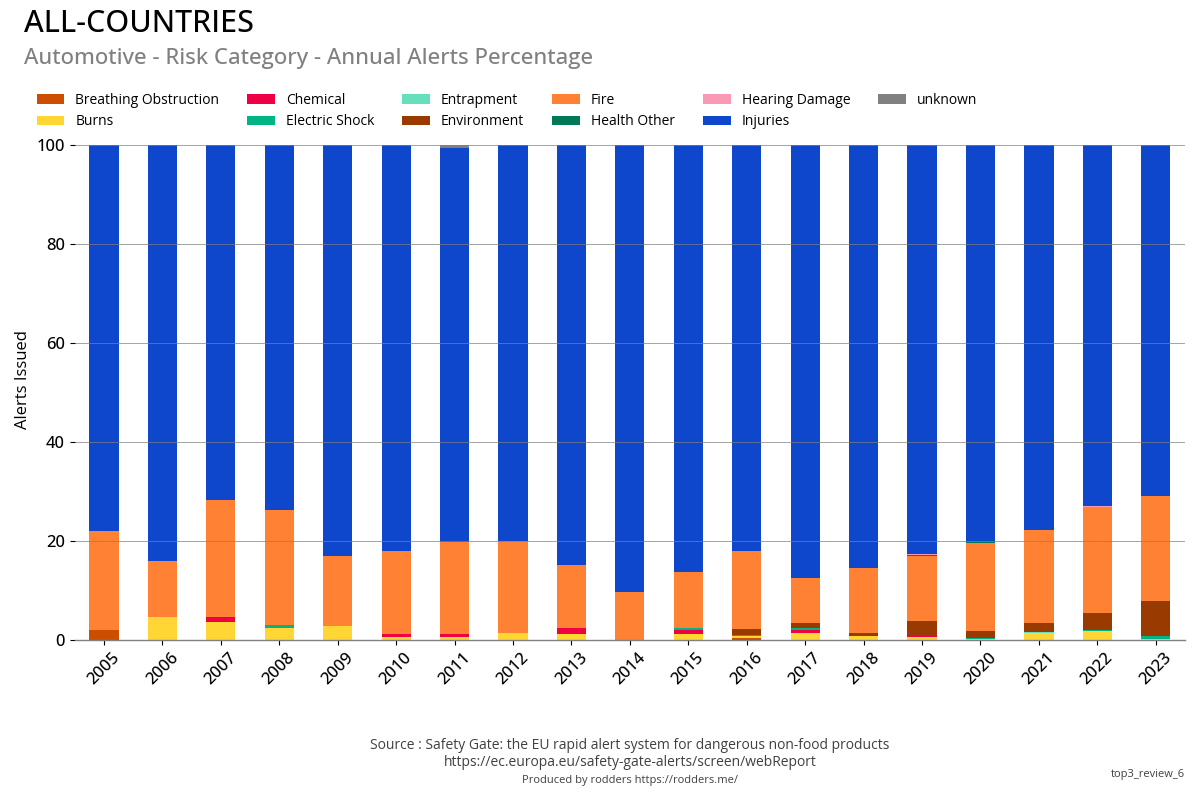
#1 - Risk Category
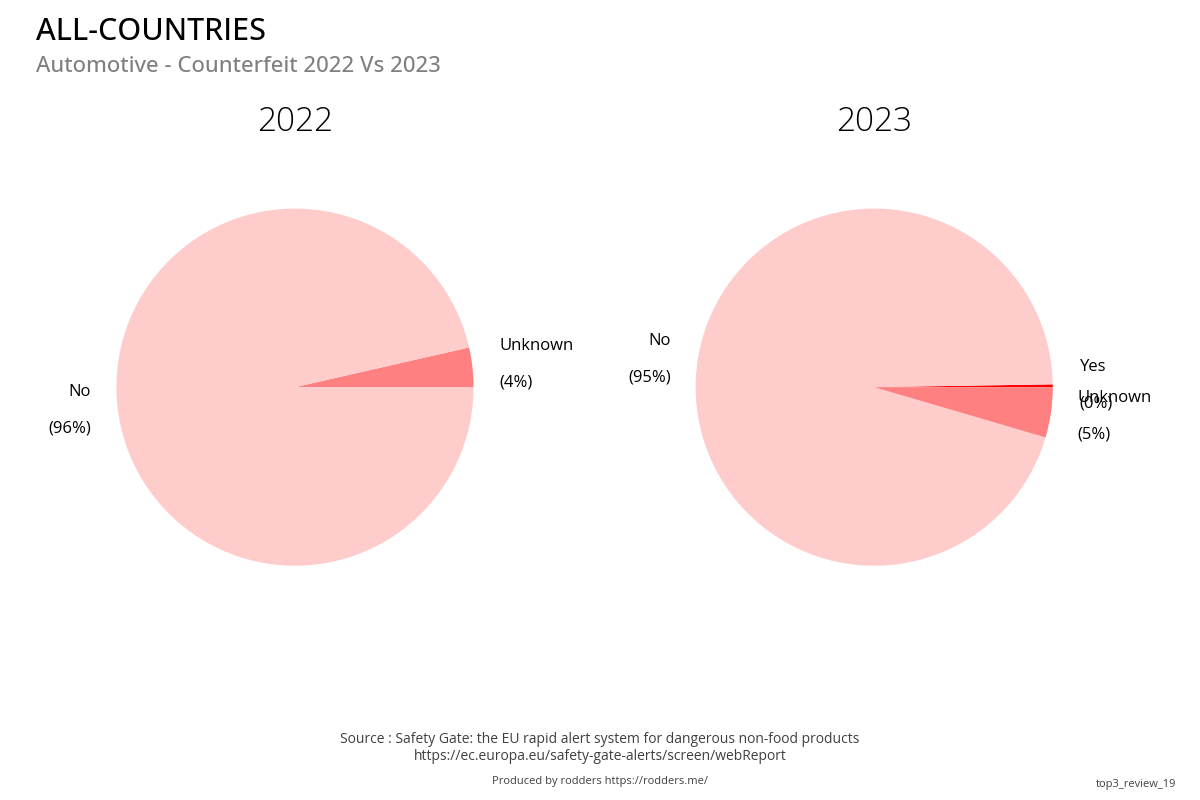
#1 - Counterfeit
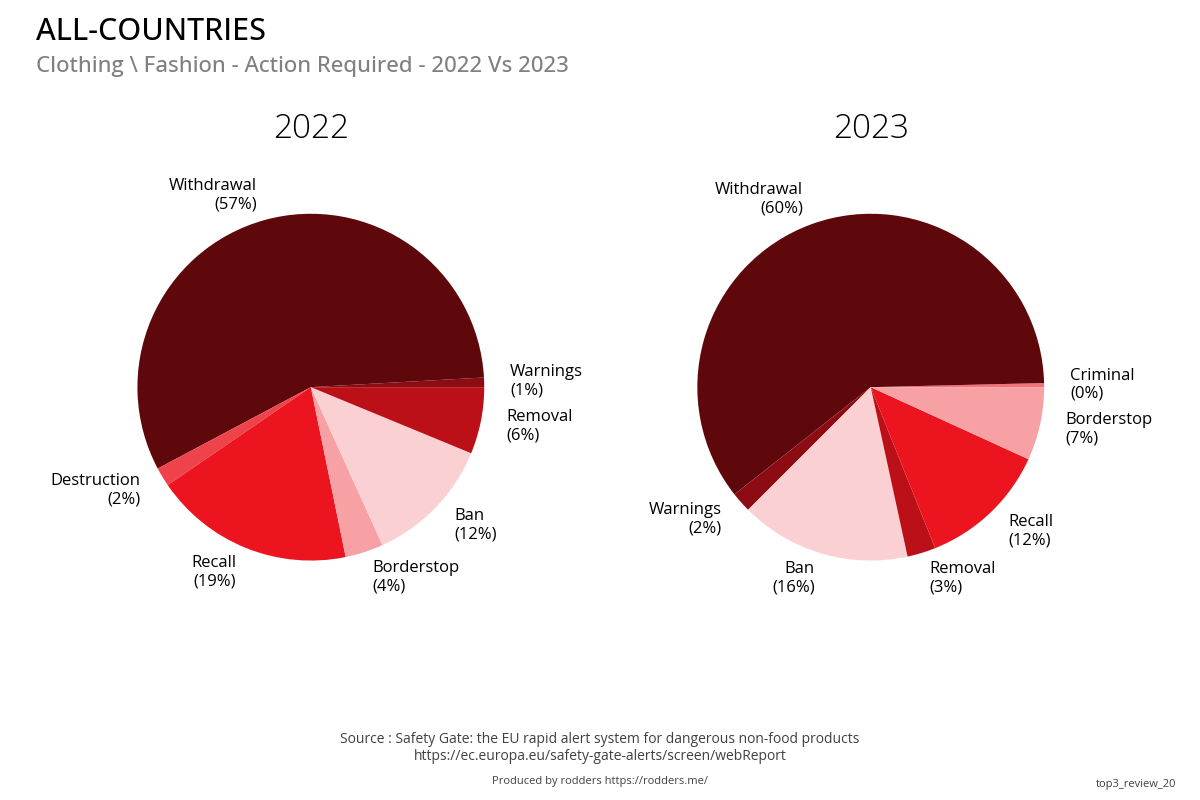
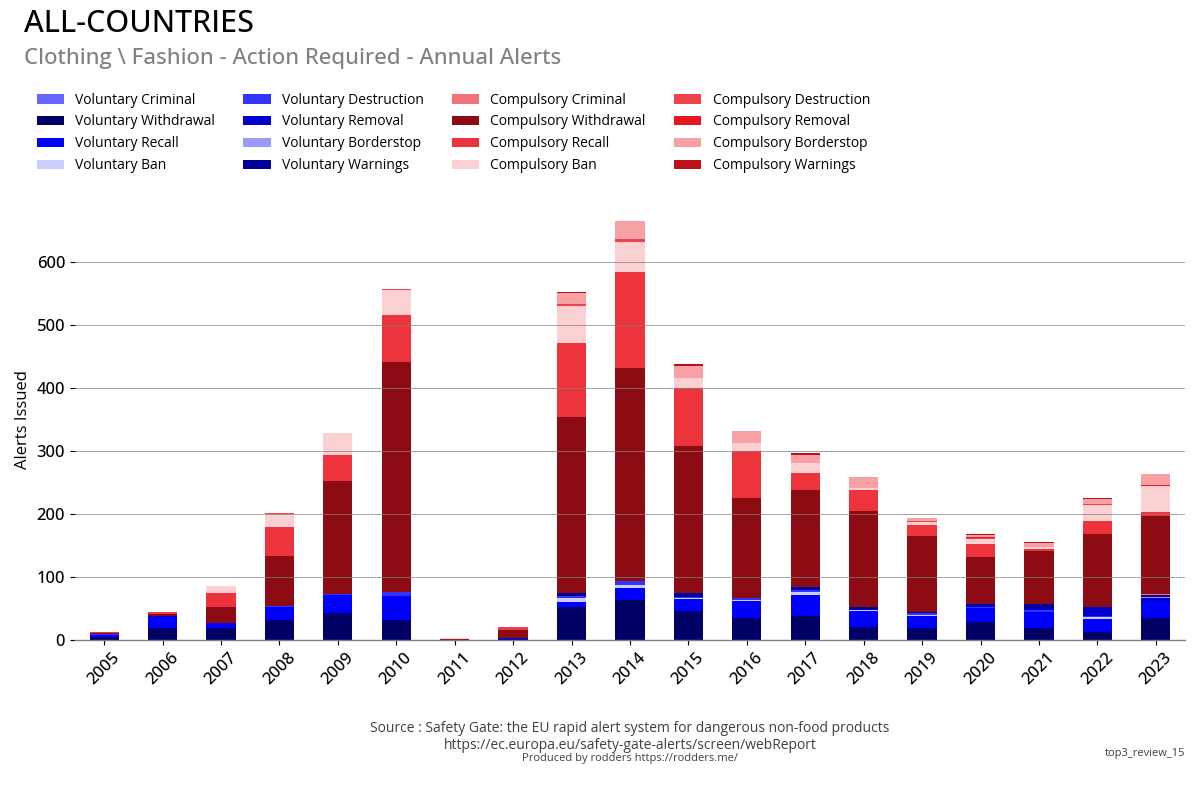
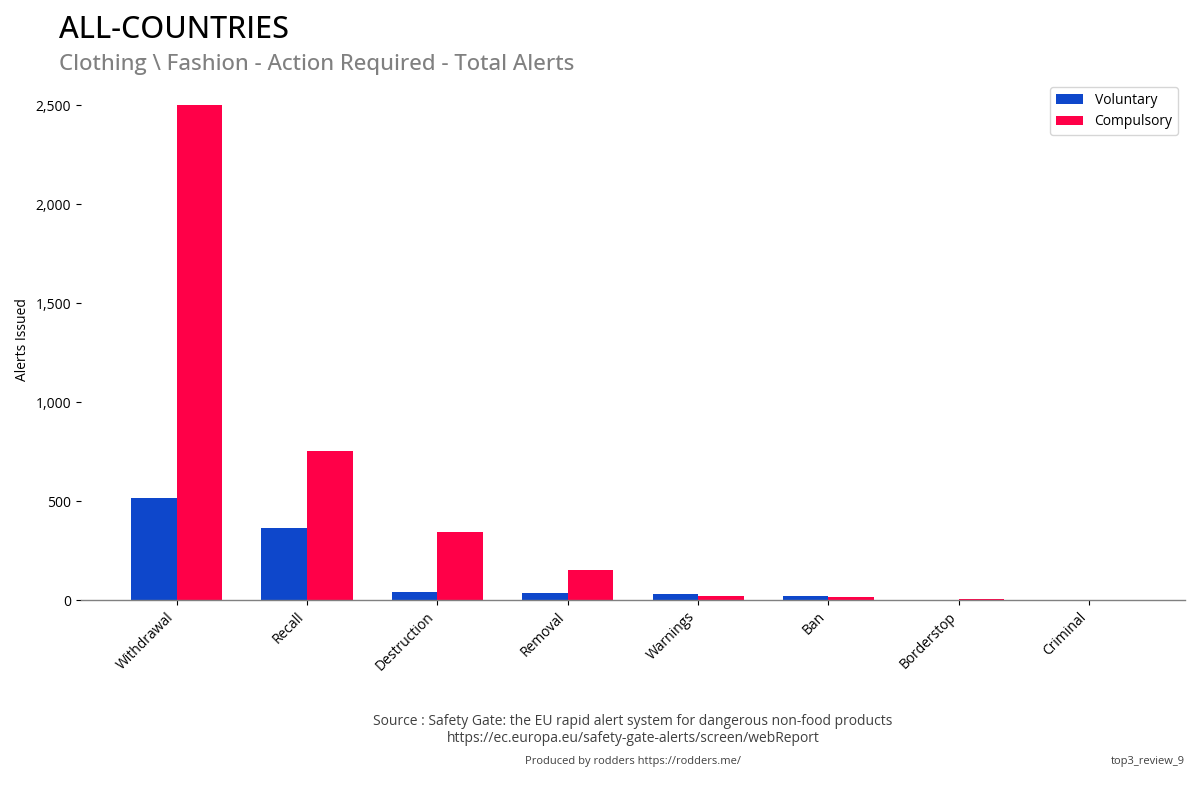
#1 - Compulsory / Voluntary Action Required
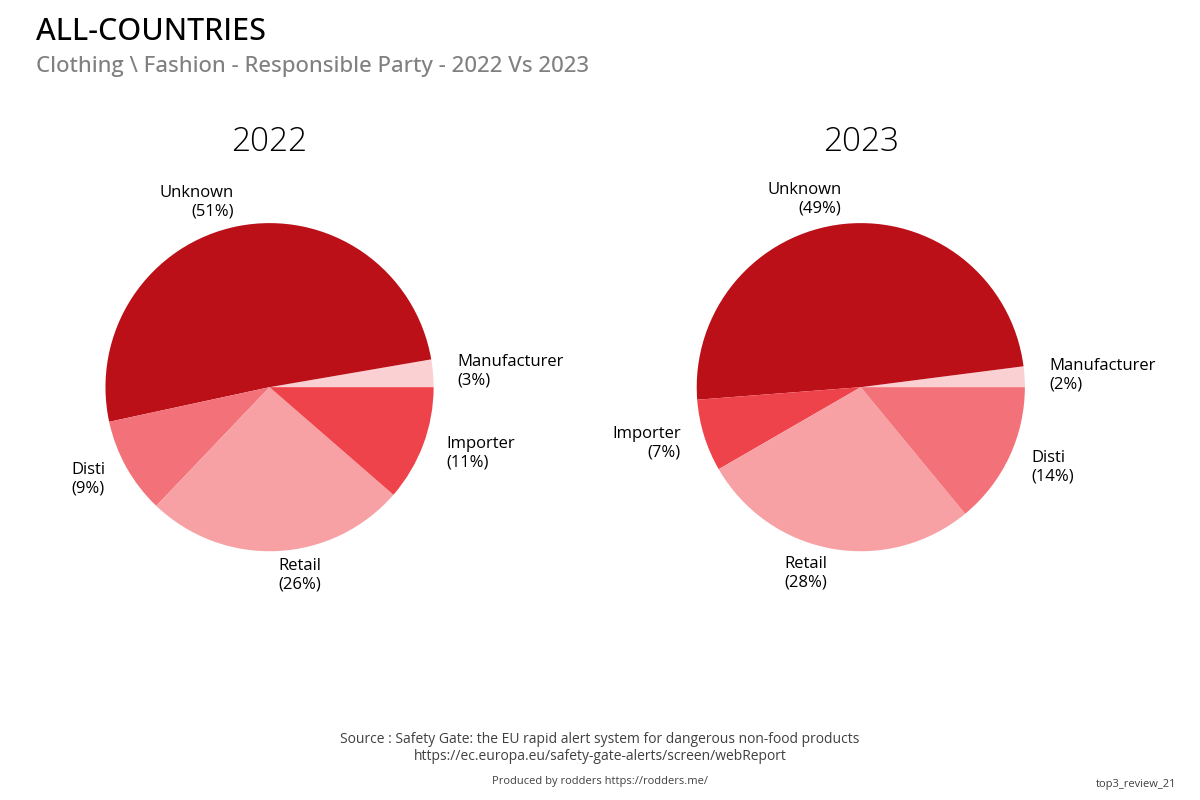
#1 - Compulsory / Voluntary Responsible Party
#1 - Top 30 Brands for Safety Alerts
#2 - Top 3 Product Categories
#2 - Total, Annual and Cumulative Alerts
#2 - Submitting Country
#2 - Risk Category
#2 - Counterfeit
#2 - Compulsory / Voluntary Action Required
#2 - Compulsory / Voluntary Responsible Party
#2 - Top Brands for Safety Alerts
#3 - Top 3 Product Categories
#3 - Total, Annual and Cumulative Alerts
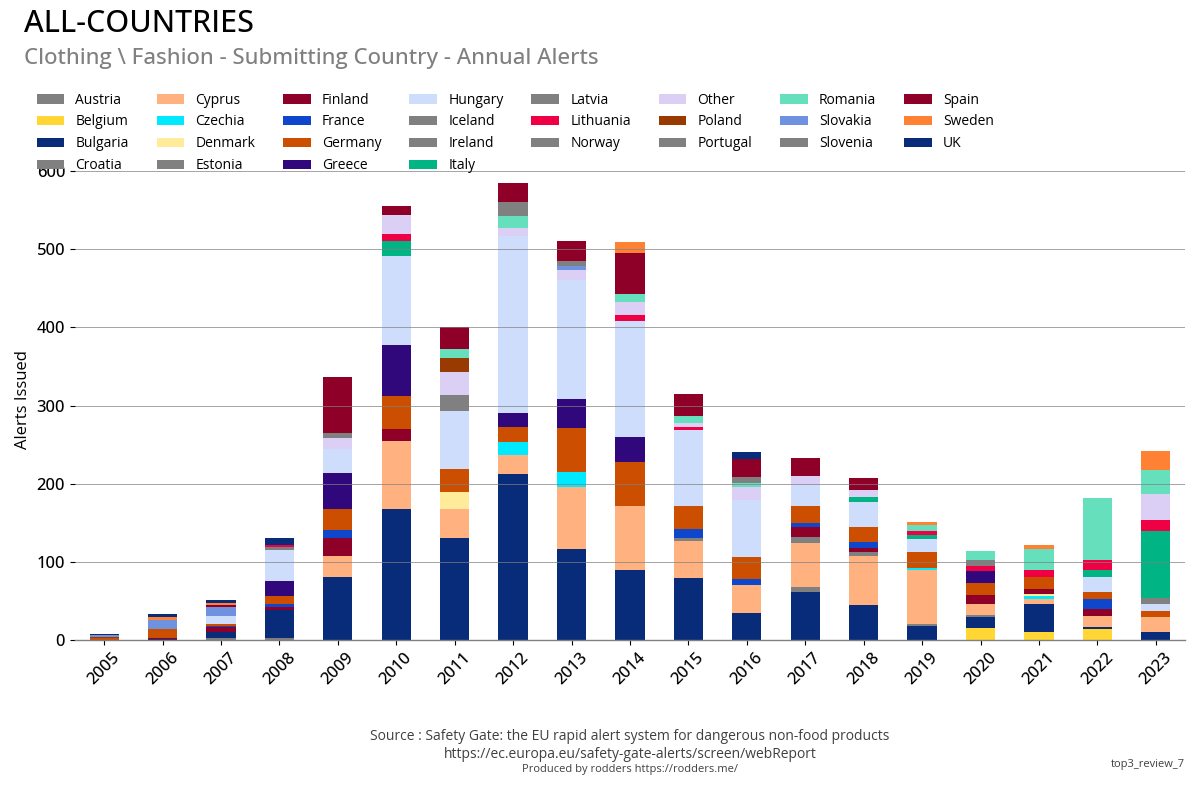
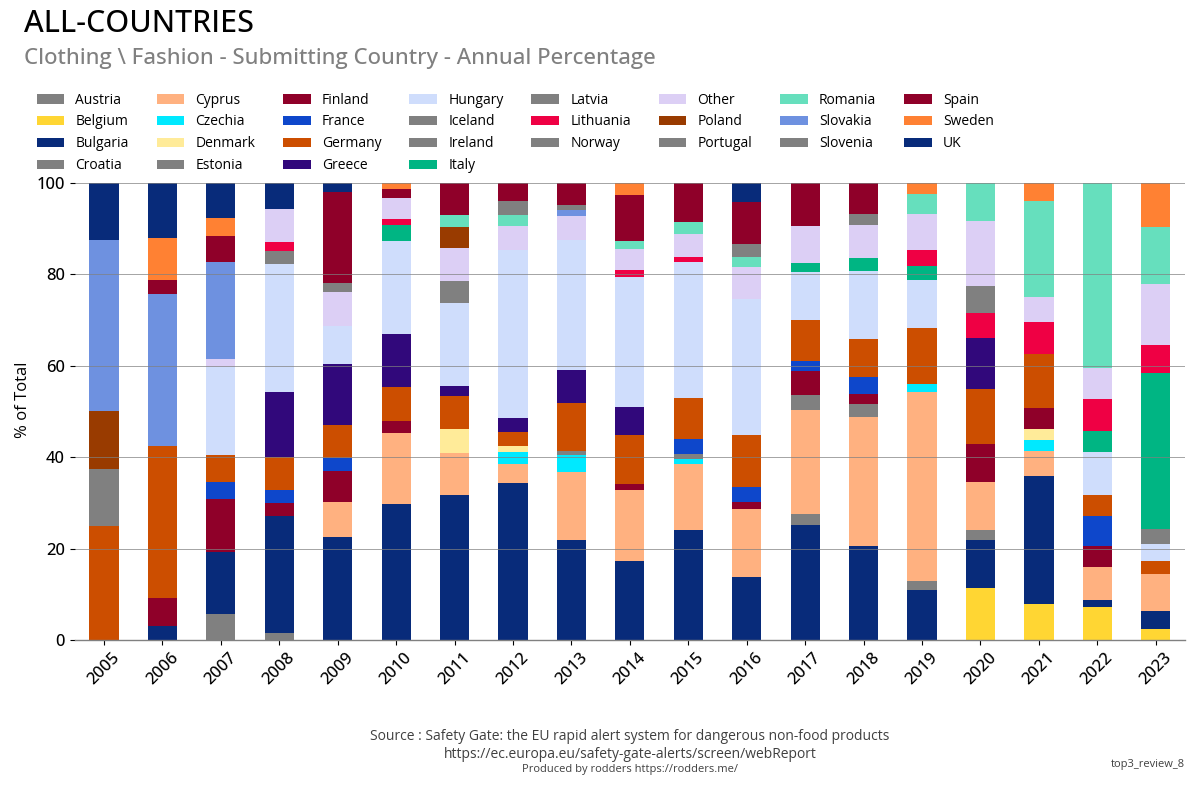
#3 - Submitting Country
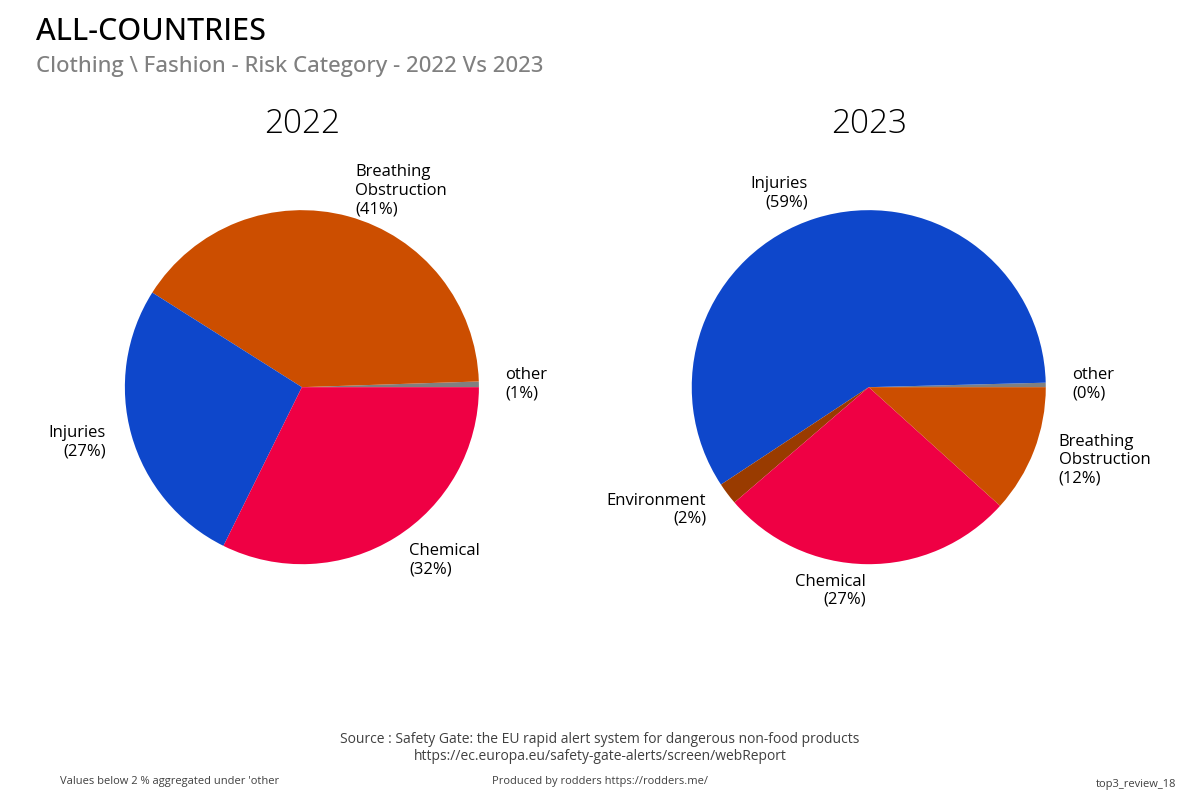
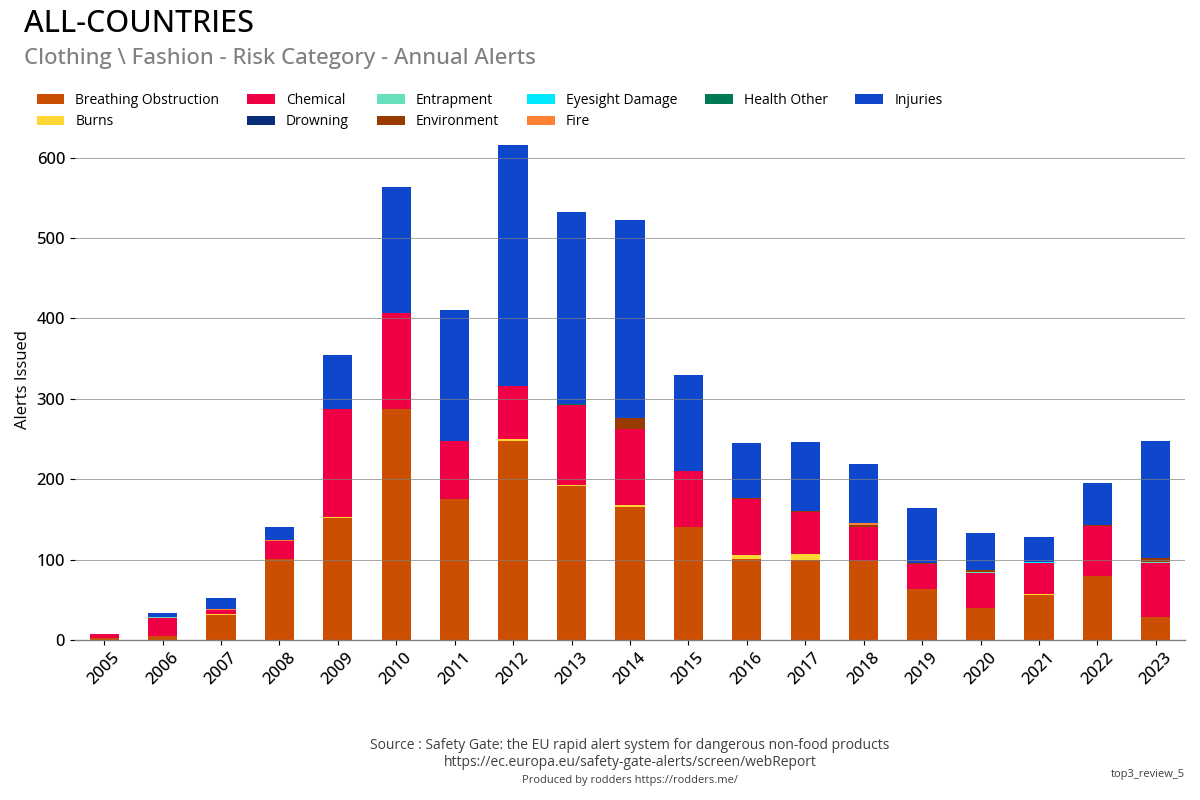
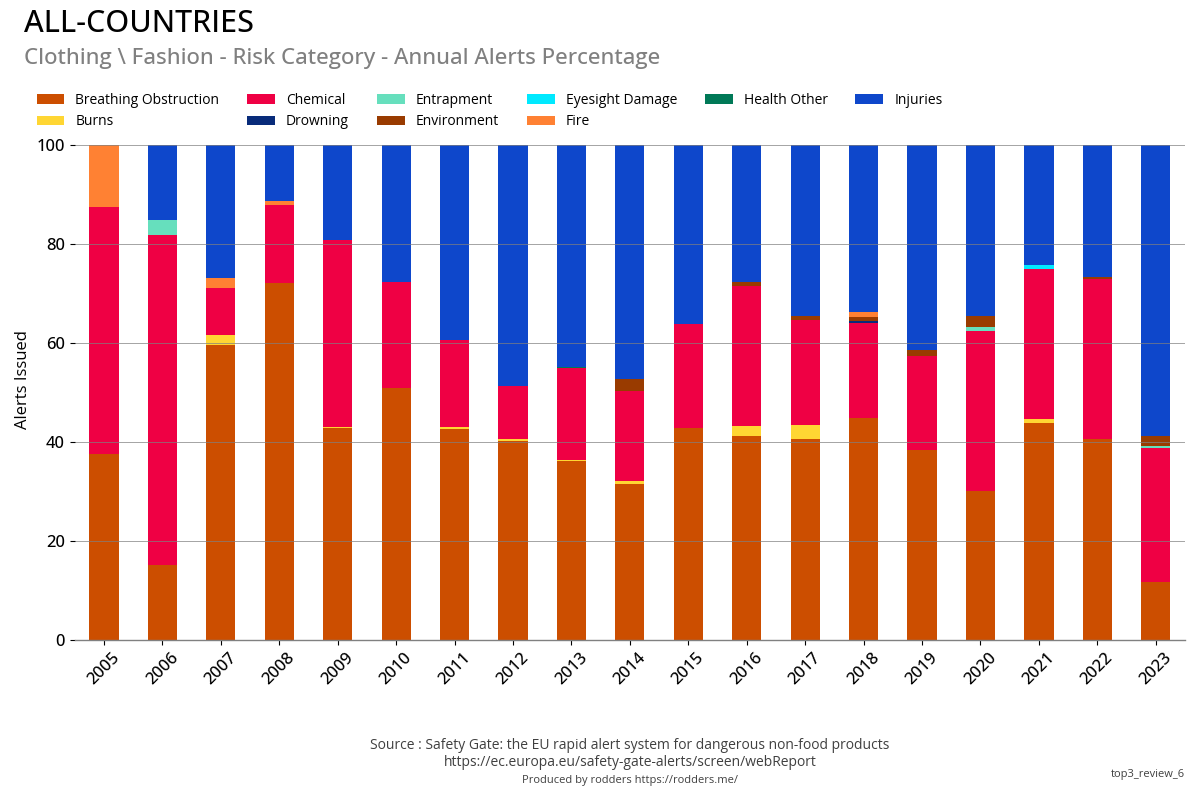
#3 - Risk Category
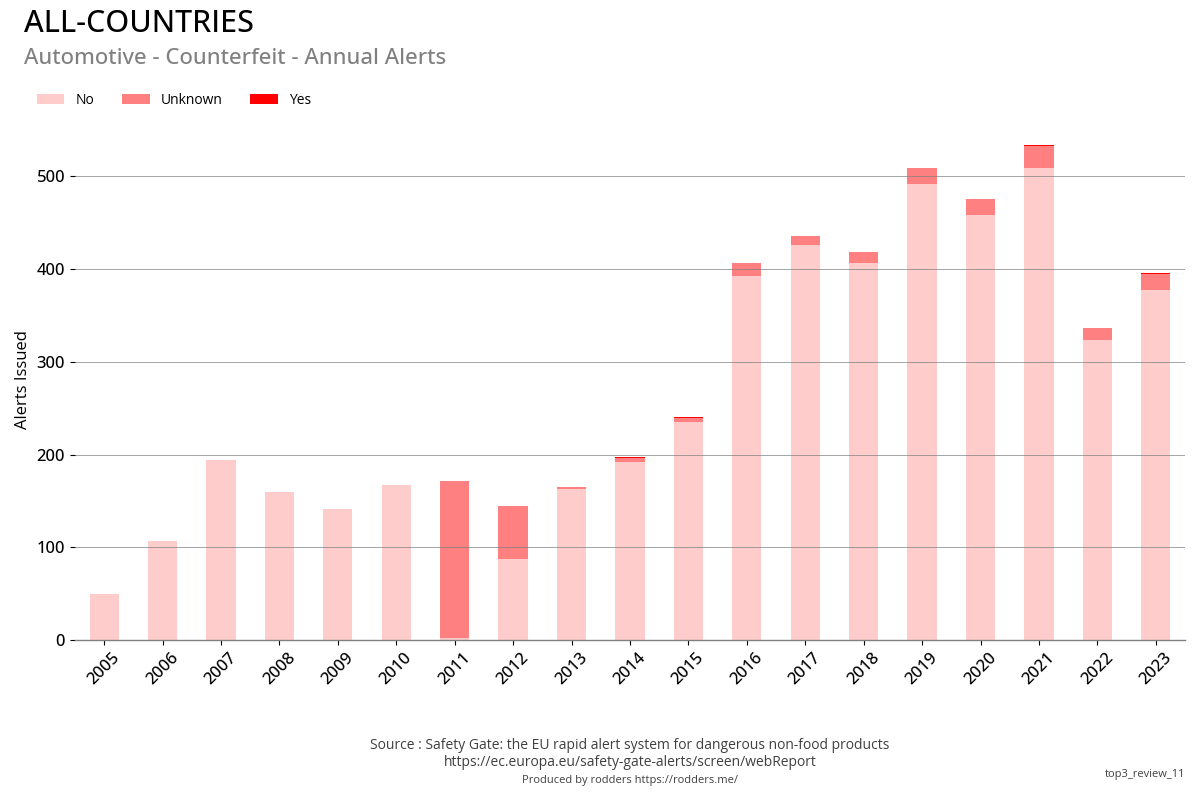
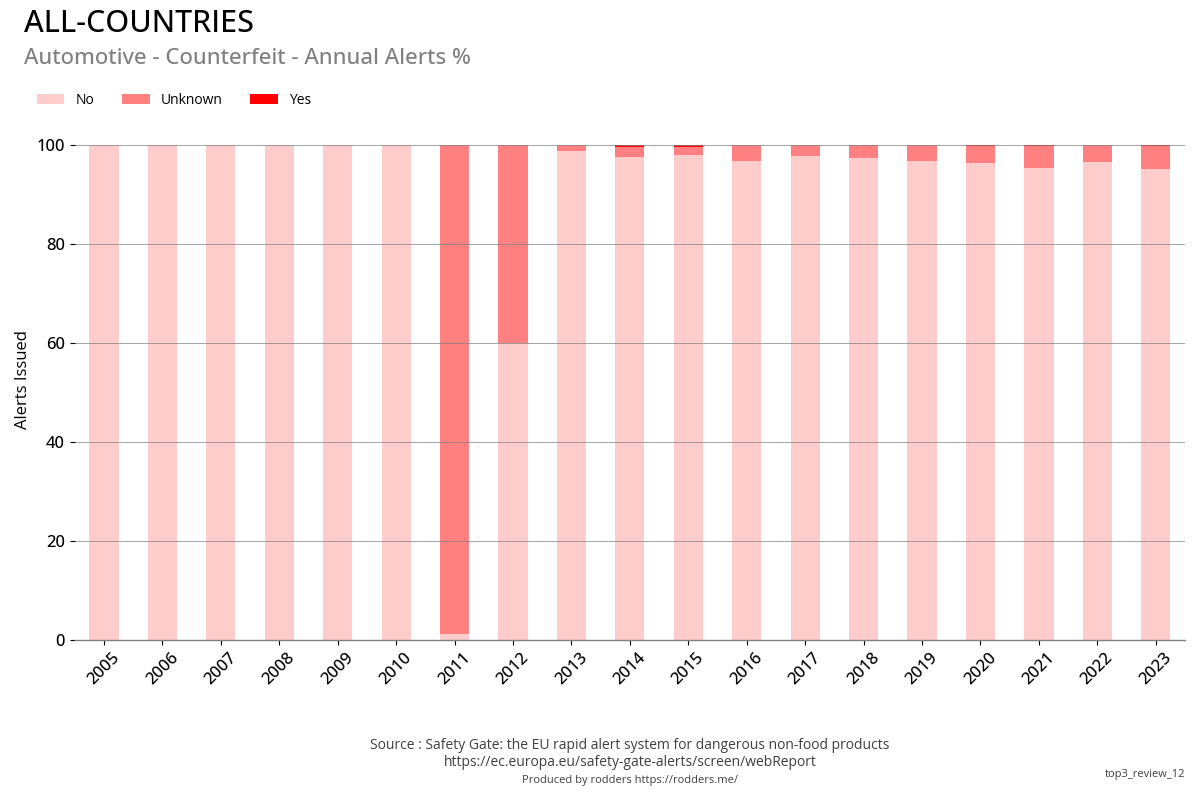
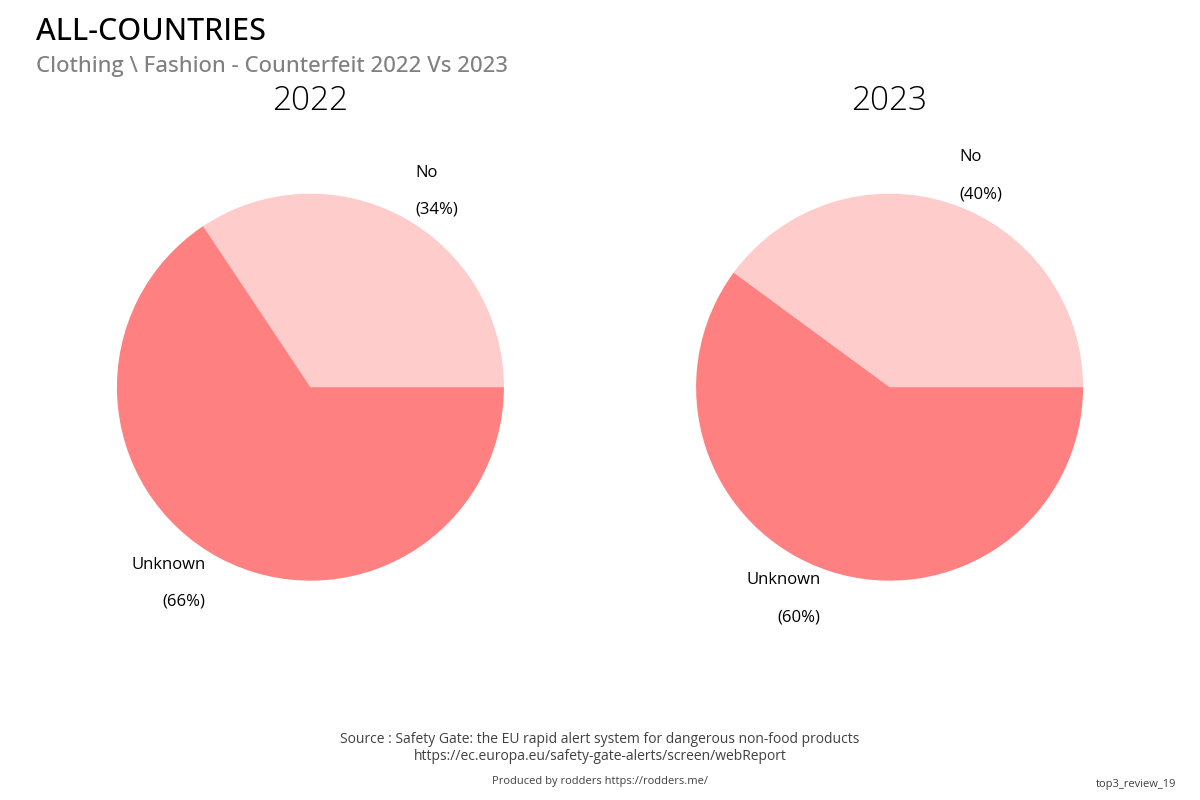
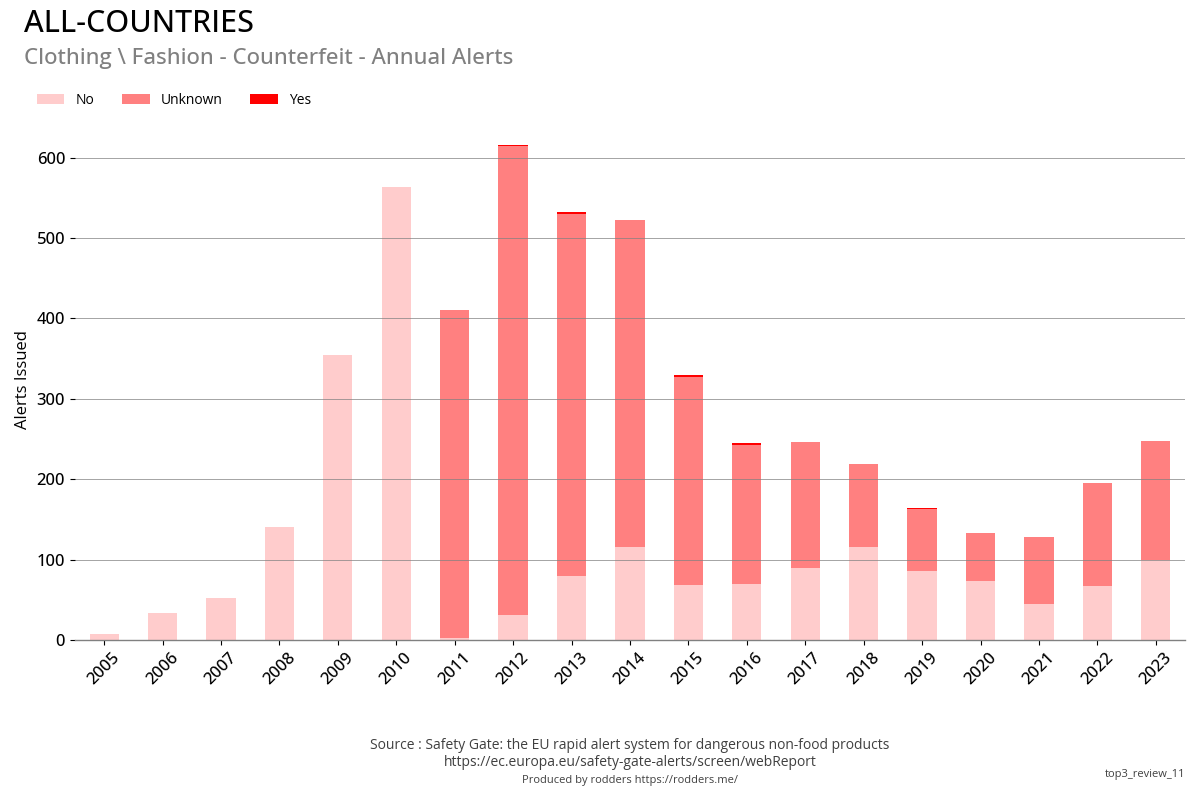
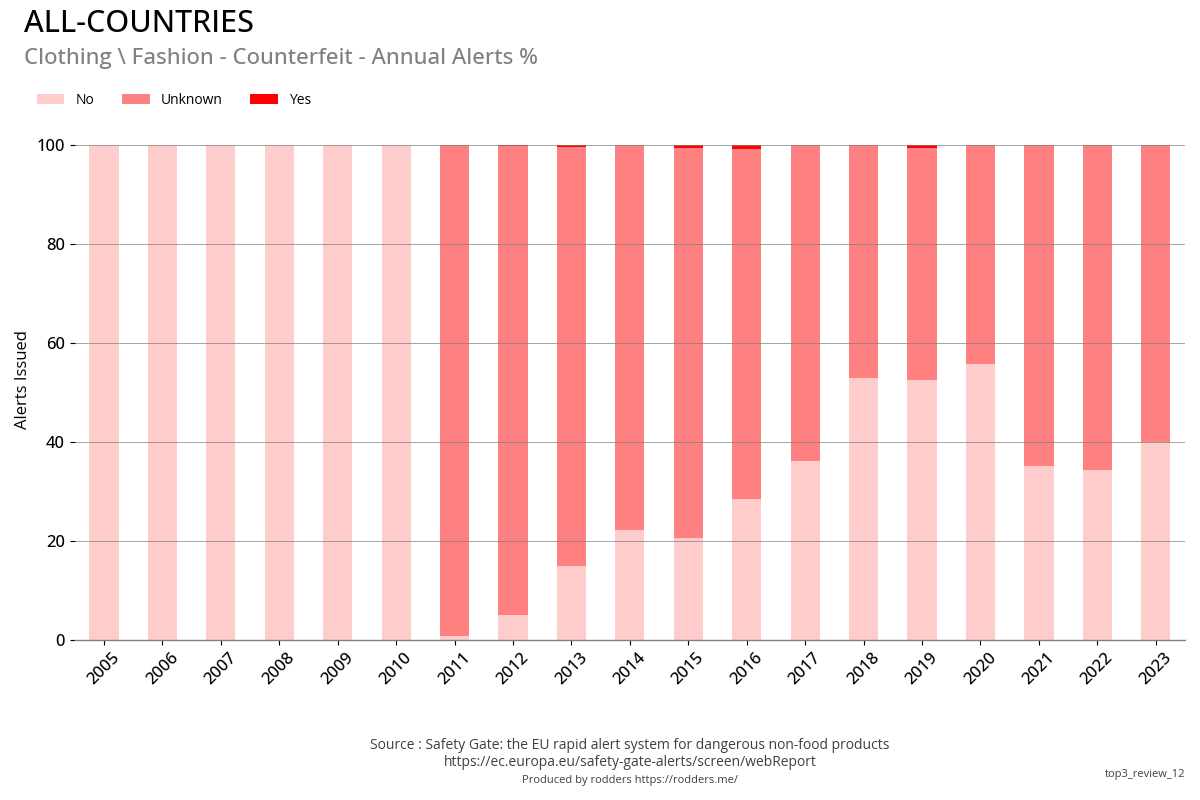
#3 - Counterfeit
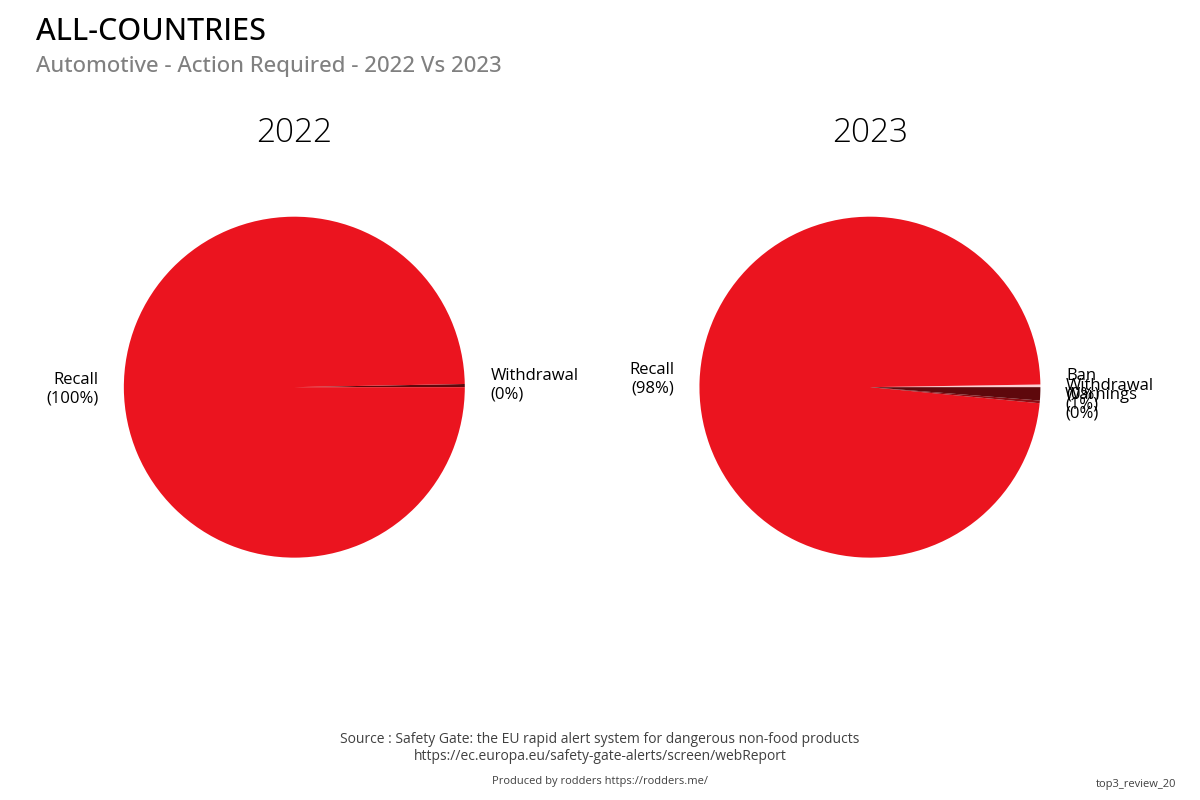
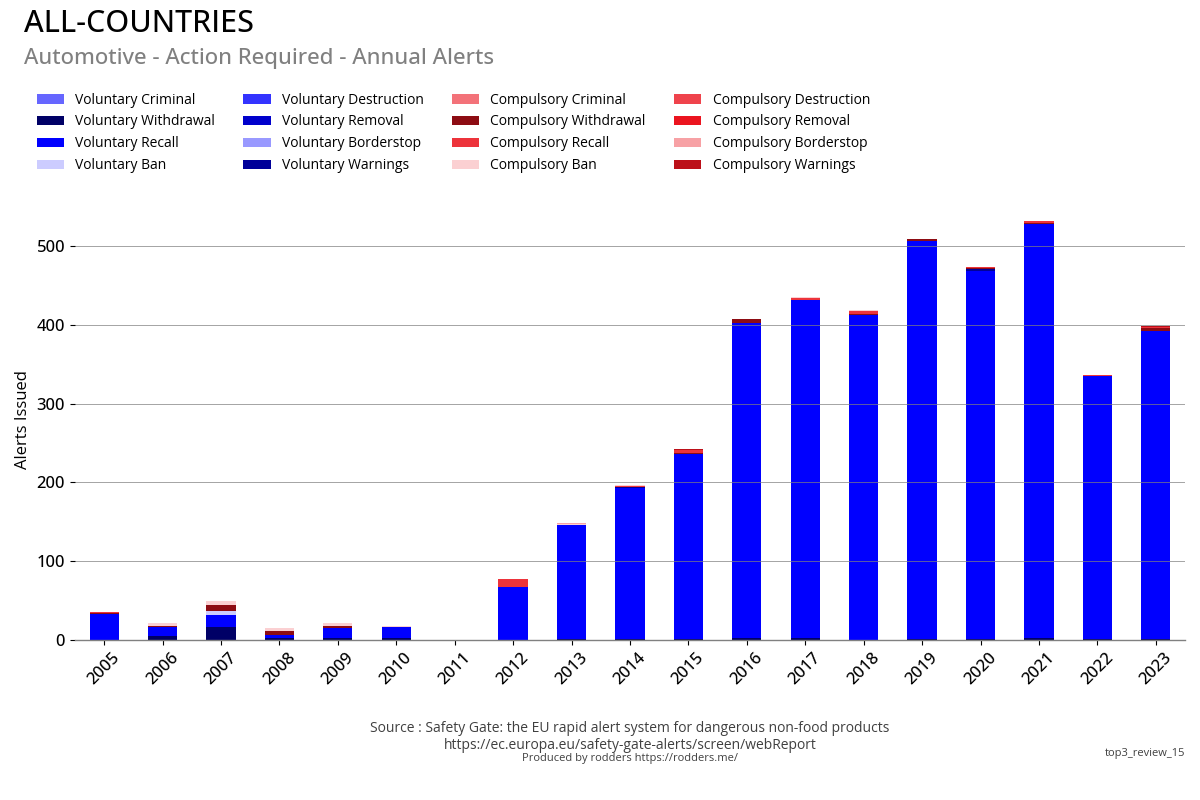
#3 - Compulsory / Voluntary Action Required
#3 - Compulsory / Voluntary Responsible Party
#3 - Top Brands for Safety Alerts
EU Safety Gate Visualisations report
Last Updated: Tuesday, September 17, 2024 12:55 PM - Data up to Week 37 - 2024
This report series compiles a detailed collection of visualisations depicting the safety alerts issued for non-food products by the
European Union. Featuring around 1,100 meticulously crafted matplotlib plots, this report offers an in-depth visual analysis of the total alerts,
allowing readers to easily interpret complex data trends, hazard types, and affected product categories. It serves as a valuable resource for those
seeking to understand the broader patterns and specifics of safety alerts through a graphical representation.
There are four reports in the series
Summary Report A summary for the year to date (comparing up to the same week number for each year) or for the total year
Visualisations Report A comprehensive suite of visualisation for the year to date (comparing up to the same week number for each year) or for the total year
Country Report Covering the top 15 countries of product origin, this report details 94 visualisation for each country, covering the main topics
of the Safety Gate data.
Country Comparison Report This report compares two countries, covering the top 15 countries of product origin, this report visualisations
cover the main topics of the Safety Gate data for each country.
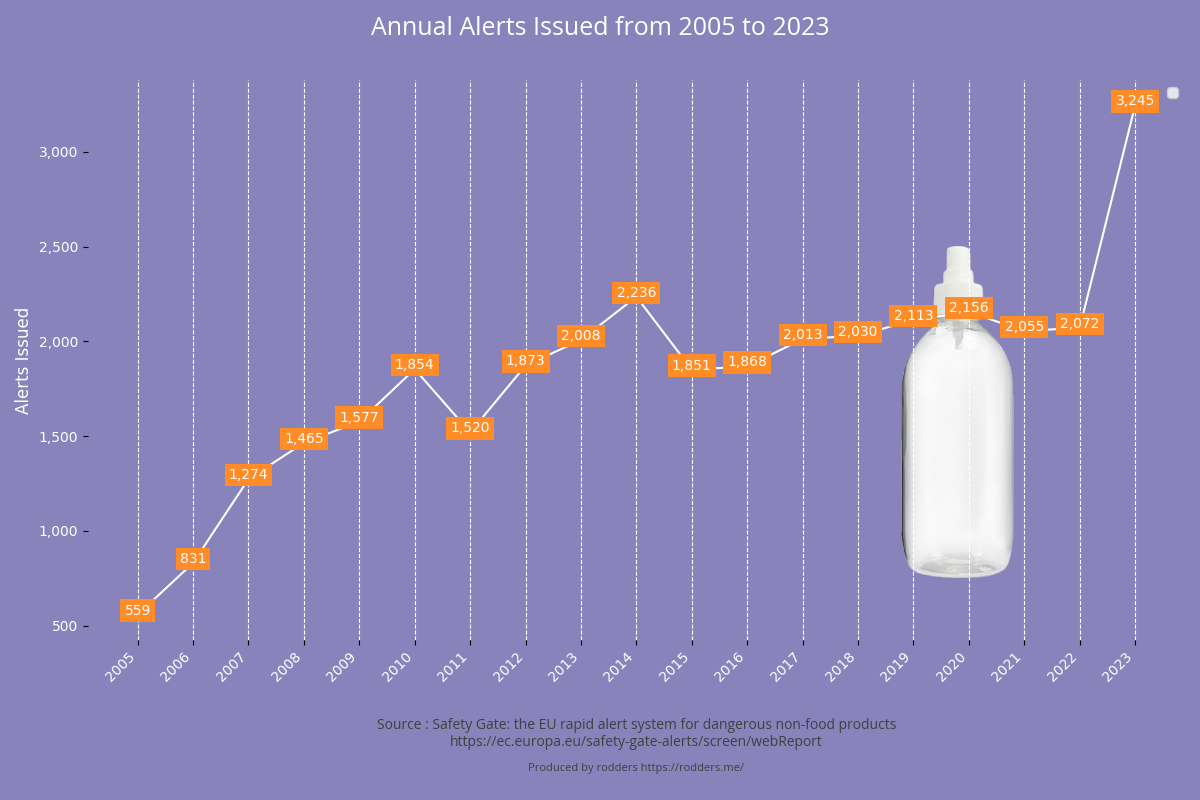
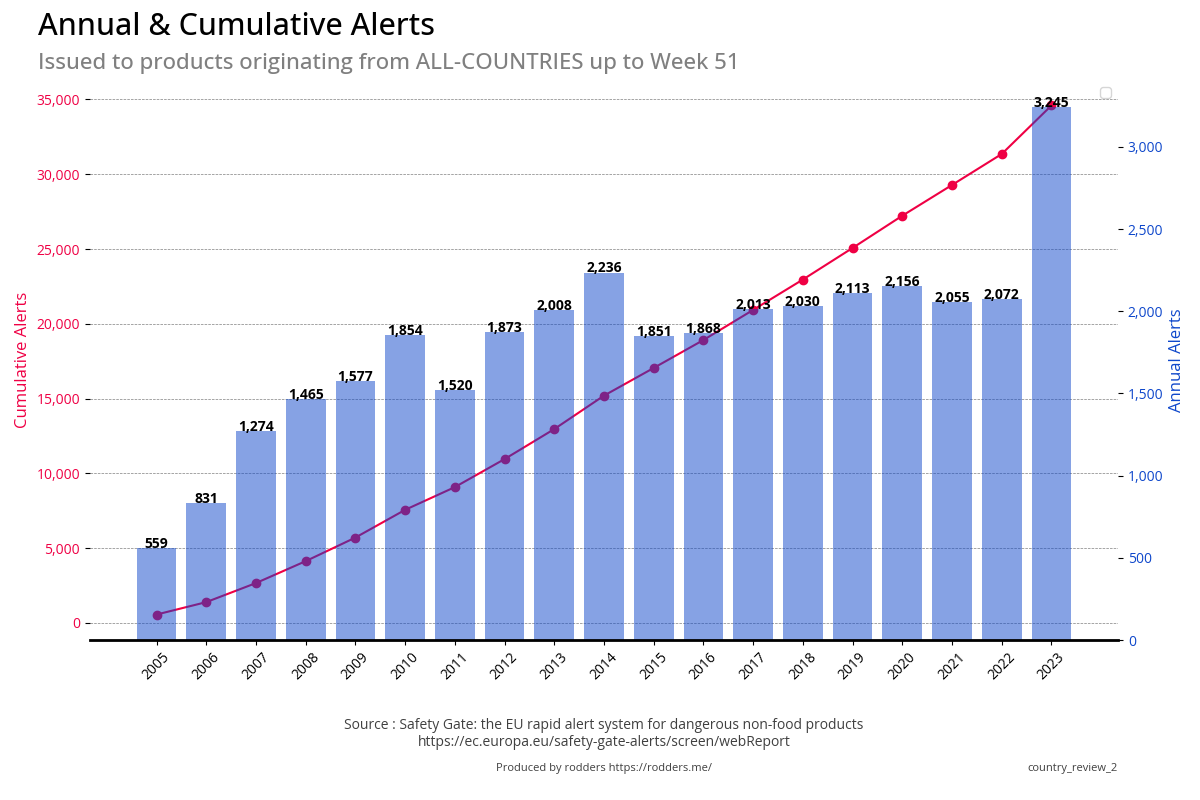
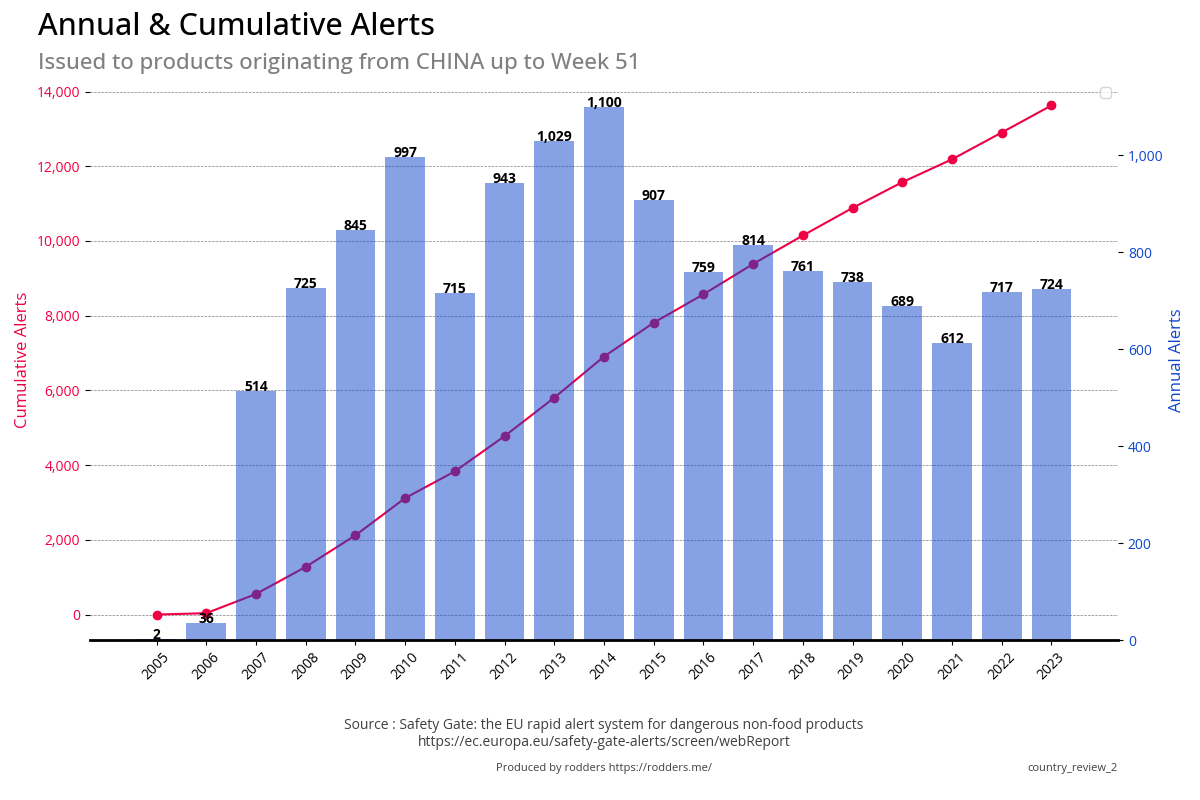
Annual Alerts
Total Annual Alerts Issued
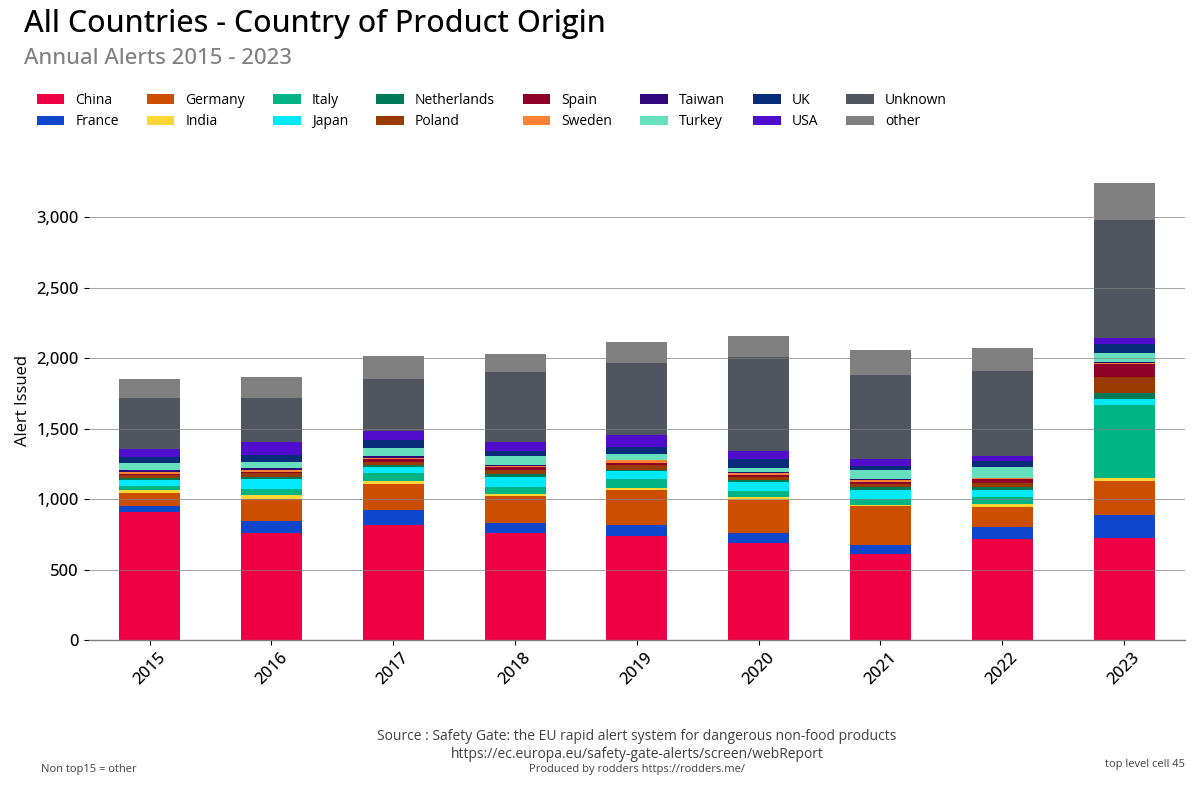
Over the last few years, the EU Safety Gate member states issue on average around 2,000
- 2,200 safety alerts per year.
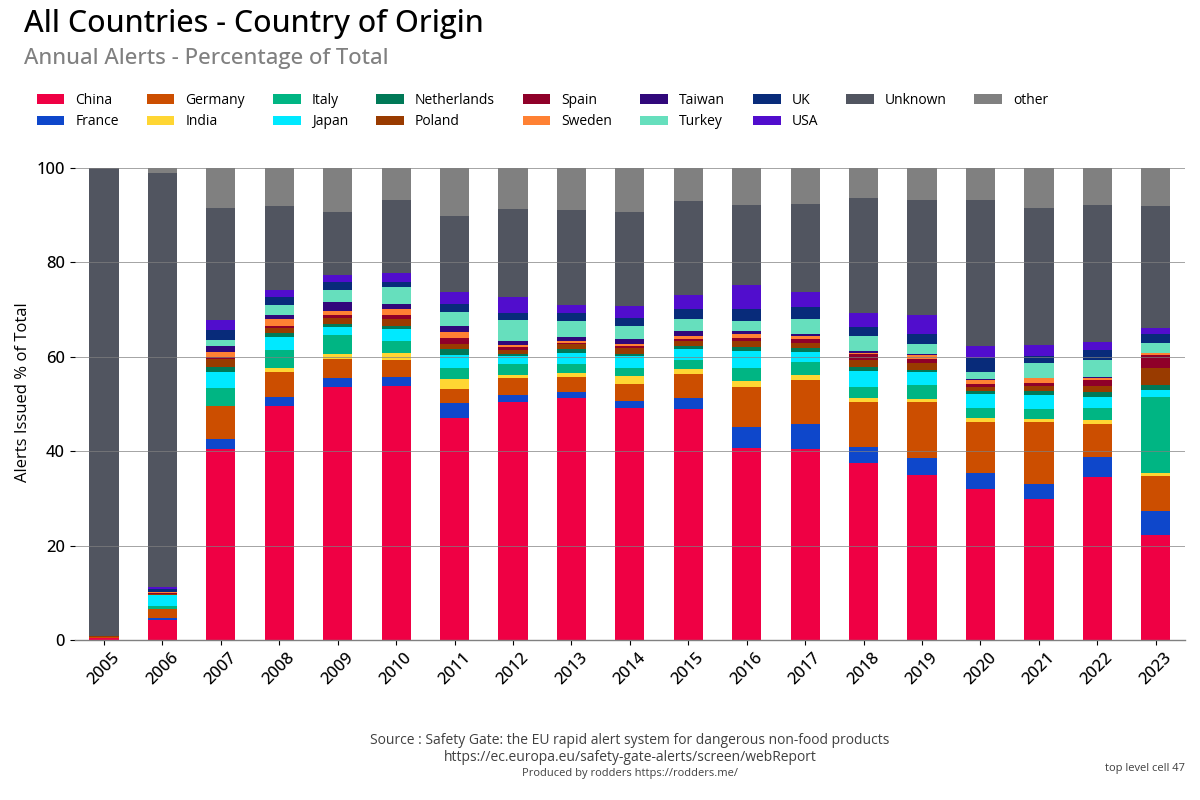
Around 25% of all alerts issued are for products where the Country of Origin is unknown.
On average China represents around 50% of Alerts issued
2023 was exceptional with 3412 alerts issued.
Metric
2005
2006
2007
2008
2009
2010
2011
2012
2013
2014
2015
Count
559
831
1,274
1,465
1,577
1,854
1,520
1,873
2,008
2,236
1,851
% Change
0
49
53
15
8
18
-18
23
7
11
-17
Change
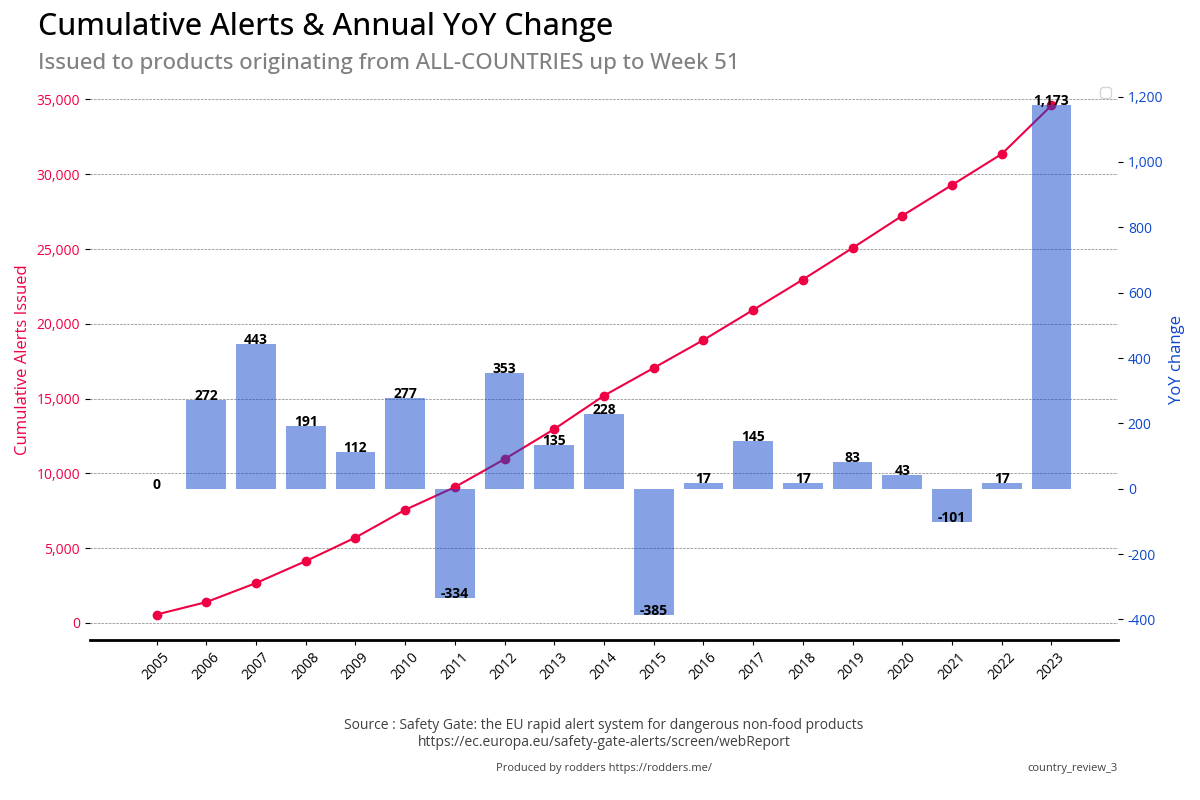
0
272
443
191
112
277
-334
353
135
228
-385
Metric
2016
2017
2018
2019
2020
2021
2022
2023
2024
2025
2026
Count
1,868
2,013
2,030
2,113
2,156
2,055
2,072
3,245
% Change
0
8
1
4
2
-5
1
57
Change
0
145
17
83
43
-101
17
1,173
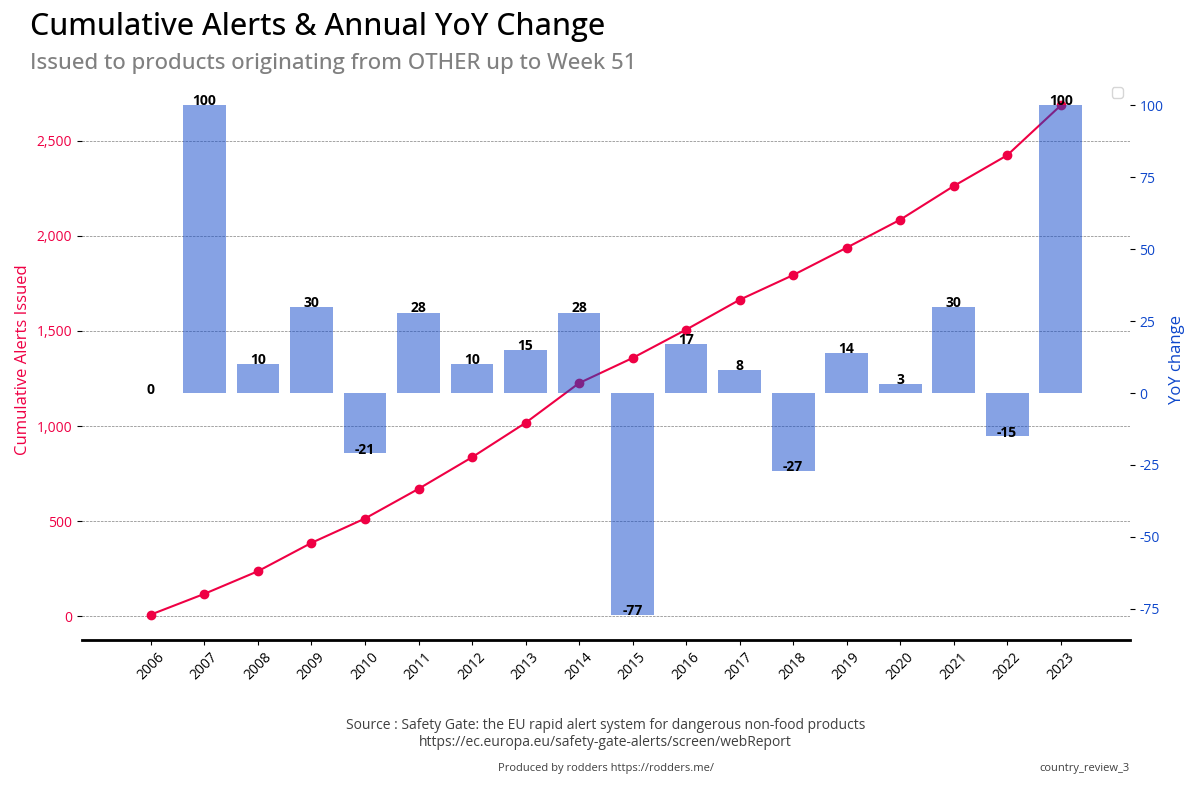
Annual Alerts Issued - YoY Change
2023 saw a 59% increase in the average number of alerts issued in a year, with the total alerts
issued increasing from 2,100 alerts in 2022 to 3,349 in 2023, an
increase of 1,249 over the previous year.
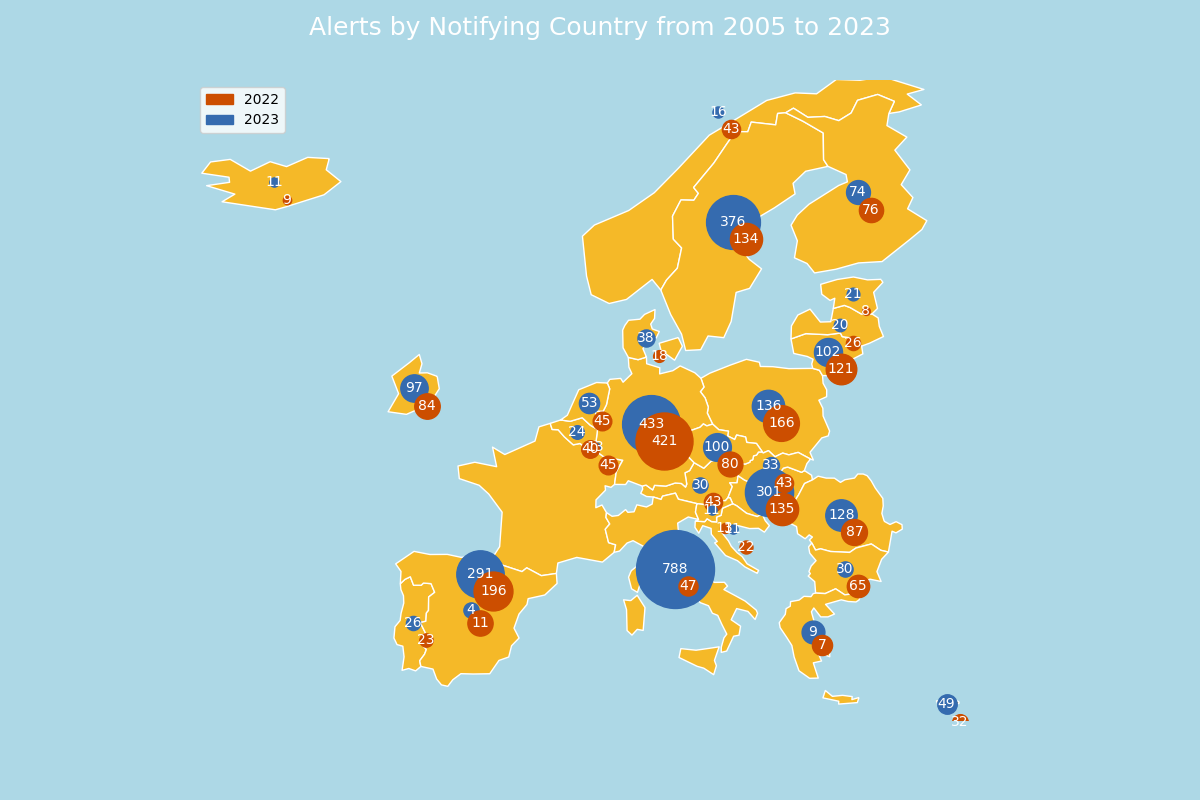
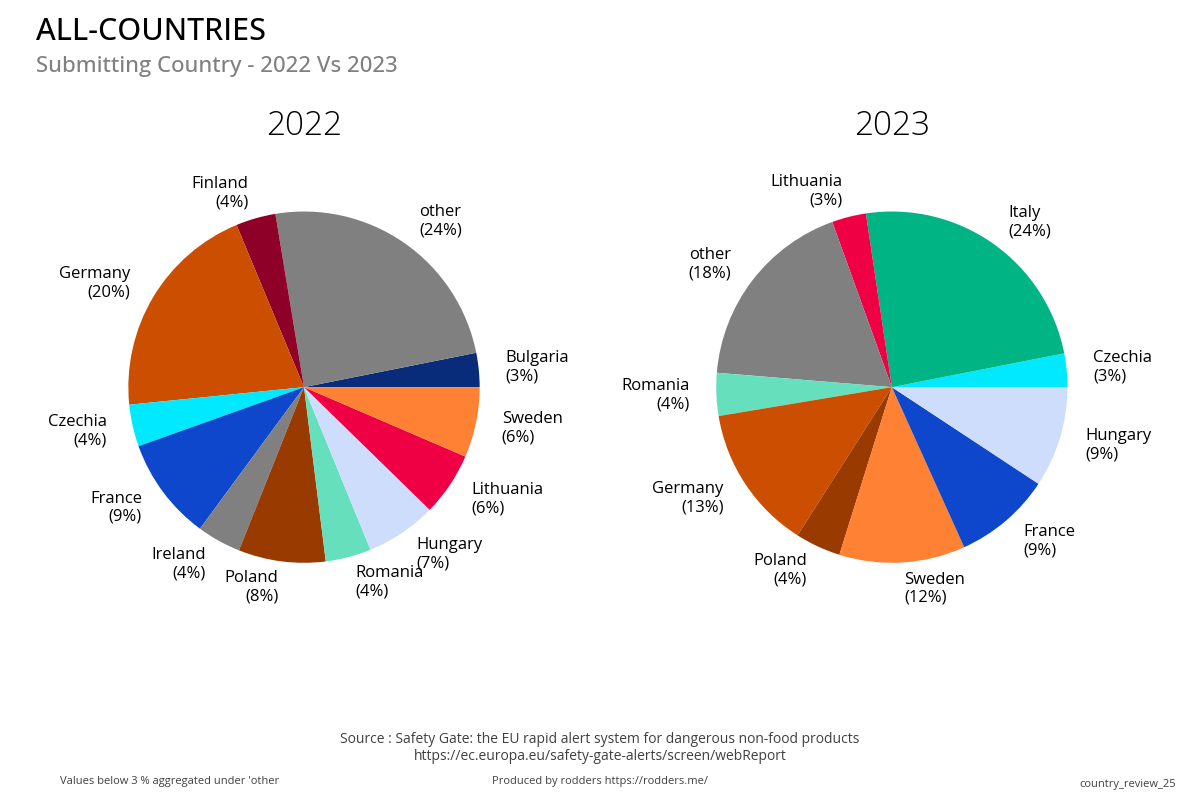
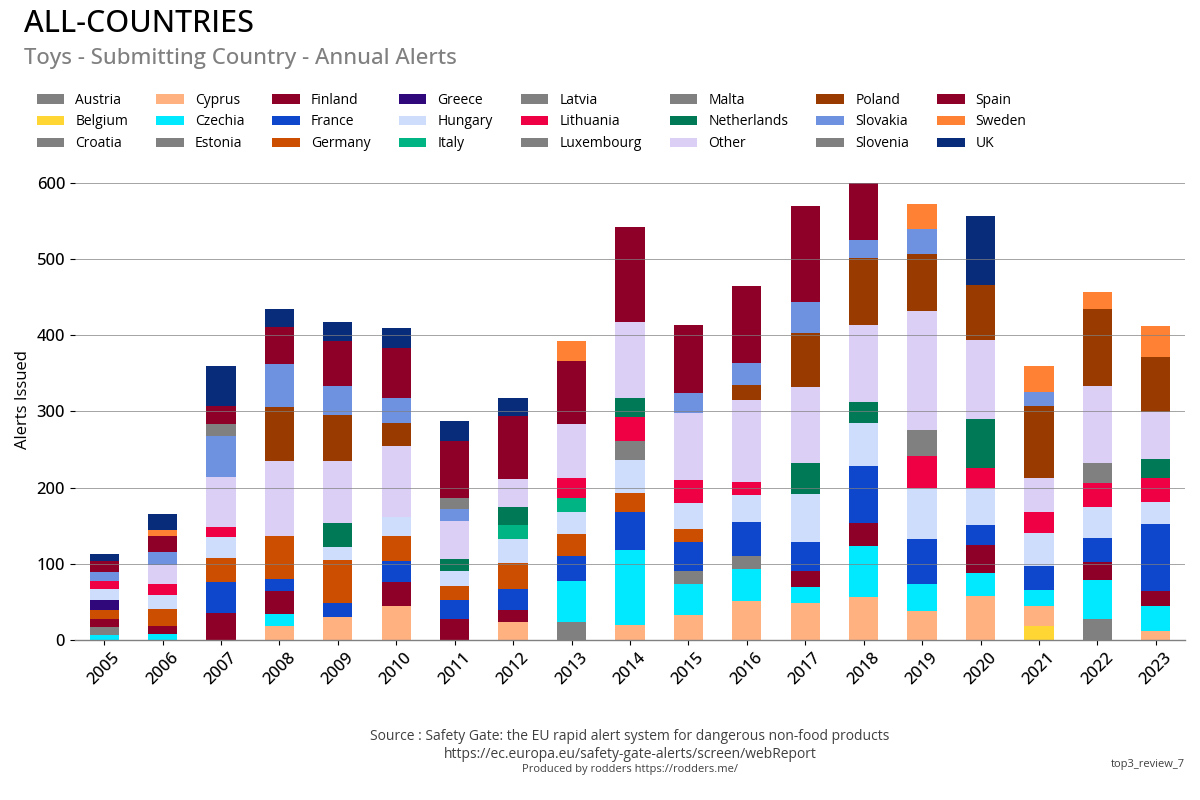
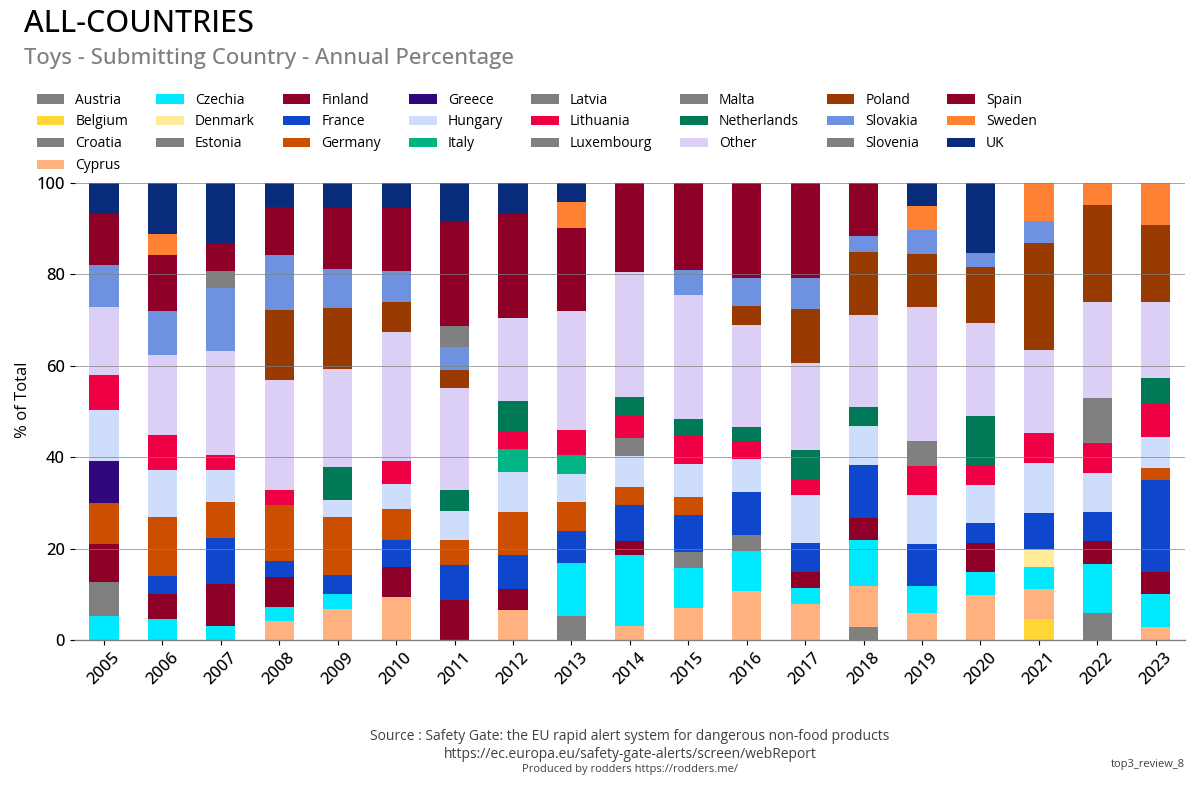
Submitting Country
The country that submitted the safety alert.
Map Plot Previous Year Vs Current Year
Previous Year Vs Current Year
Annual Alerts and Annual Percentage of Total
Annual Count
Annual Percent of Total
Go to Top
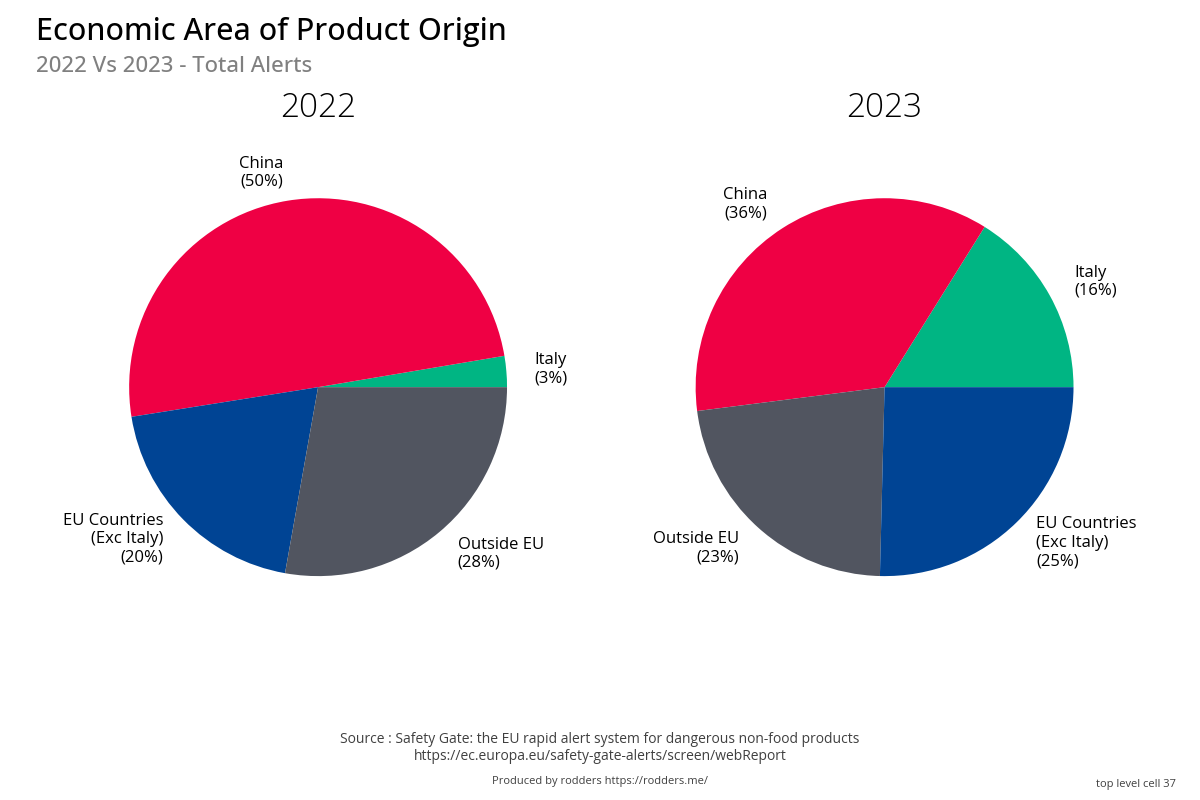
Which countries' products get the most alerts?
The following visualisations show the Economic Area of Product Origin with categories defined as:
EU Countries within Schengen or European Economic Area (Ex Italy for visibility of 2023 alerts)Italy - Italy represents around 15% of all alerts issued in 2023 and is highlighted for the 2023 exceptionOutside EU - Every other country not within the Eu CountriesChina - China represents a large proportion of Global Trade
Economic Area of Product origin Previous Year Vs Current Year
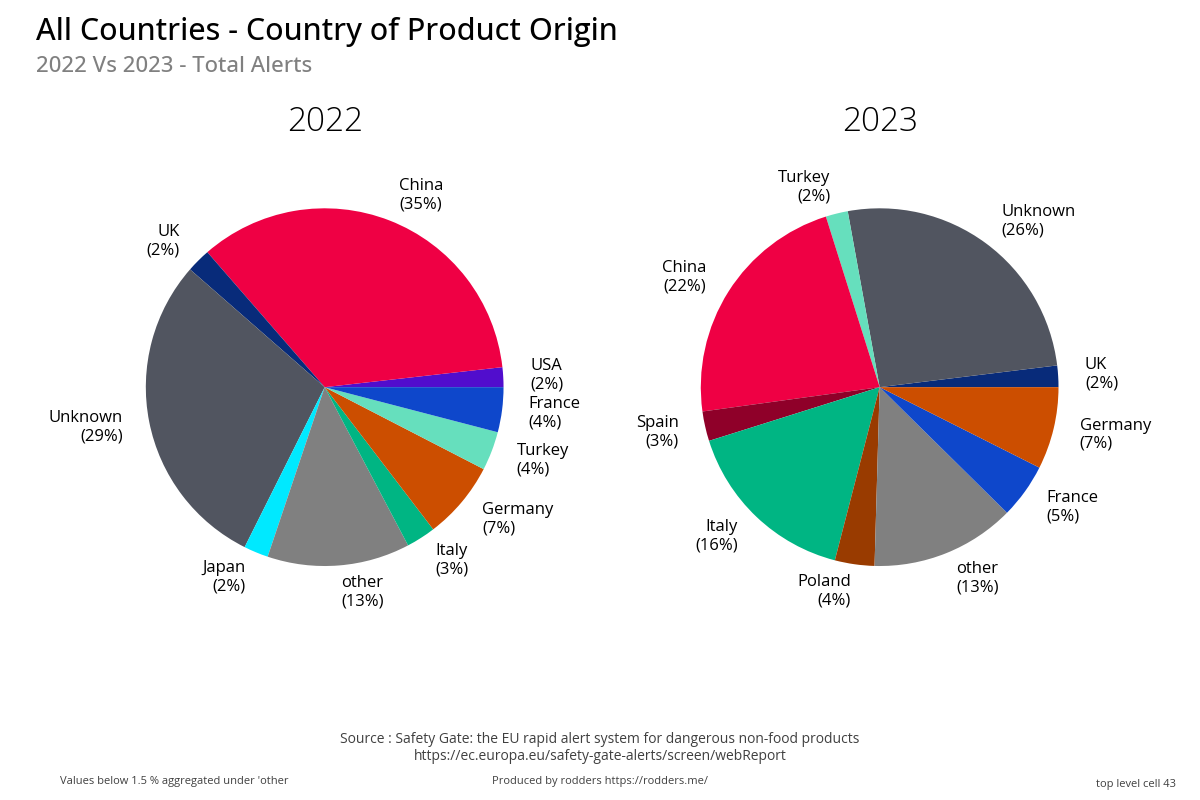
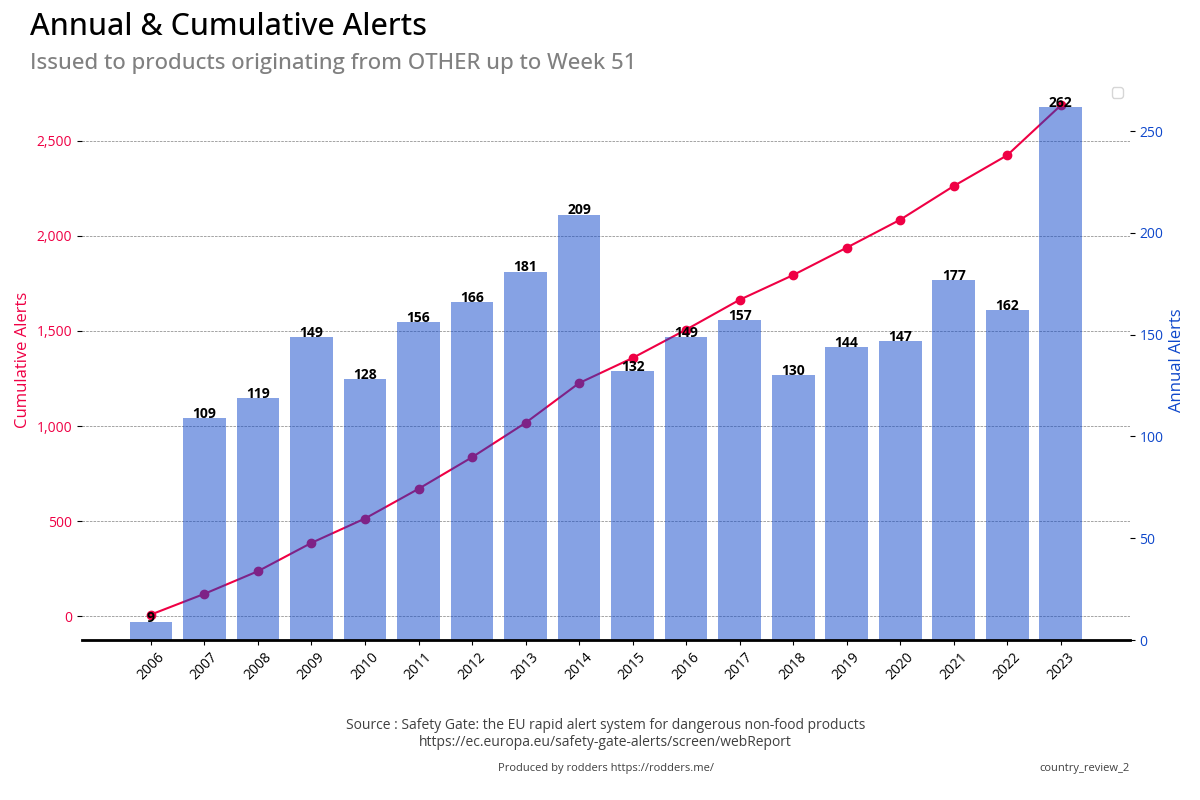
Country of Product Origin
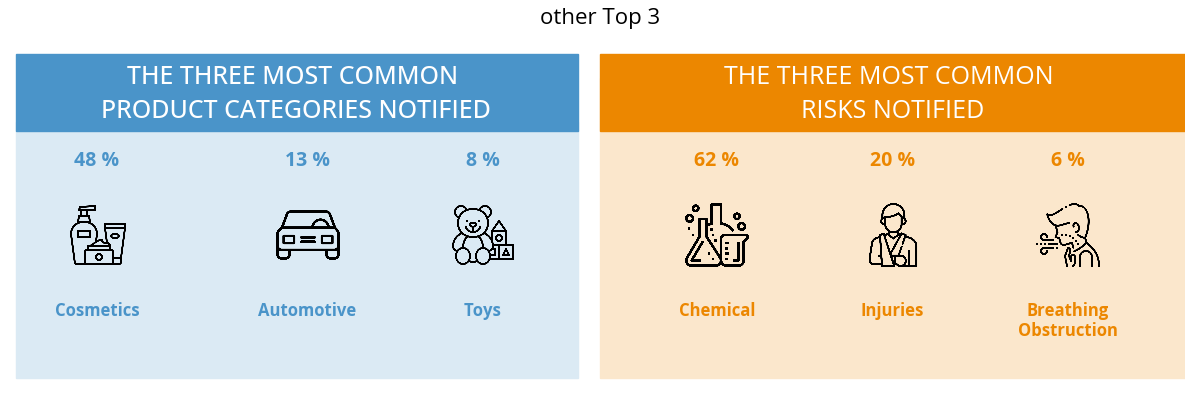
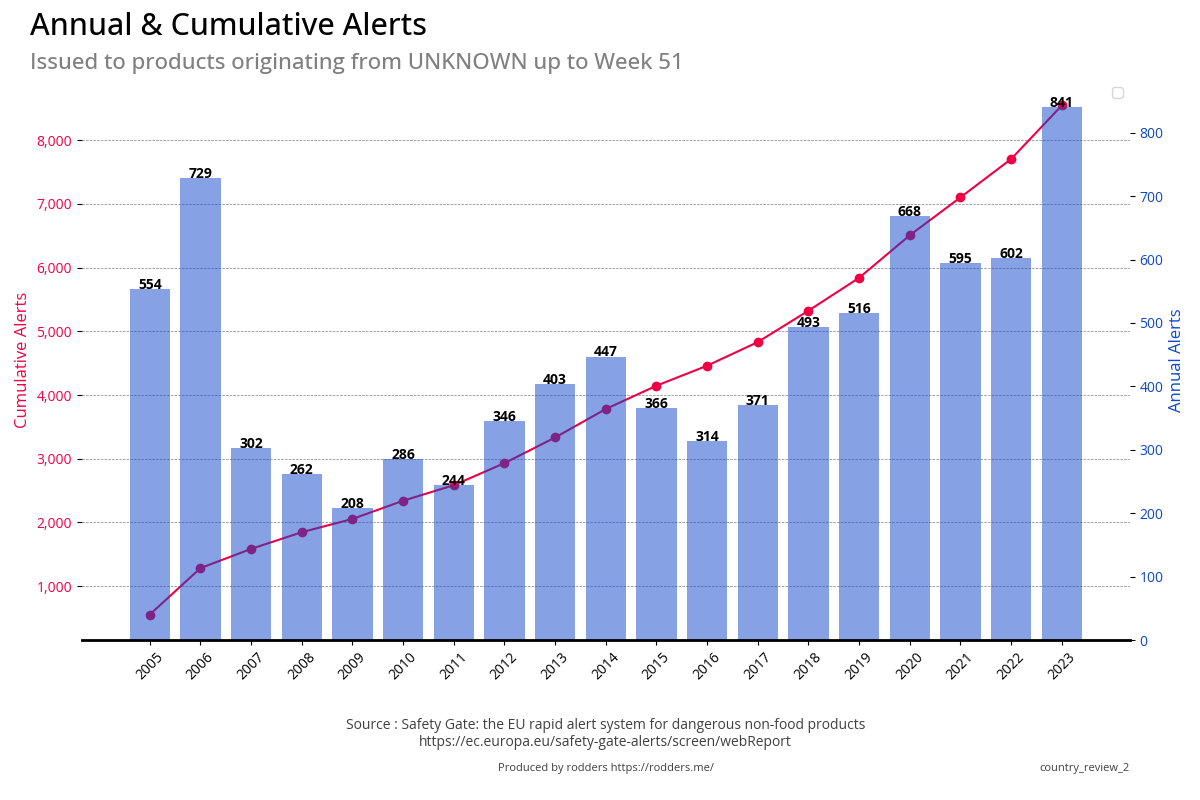
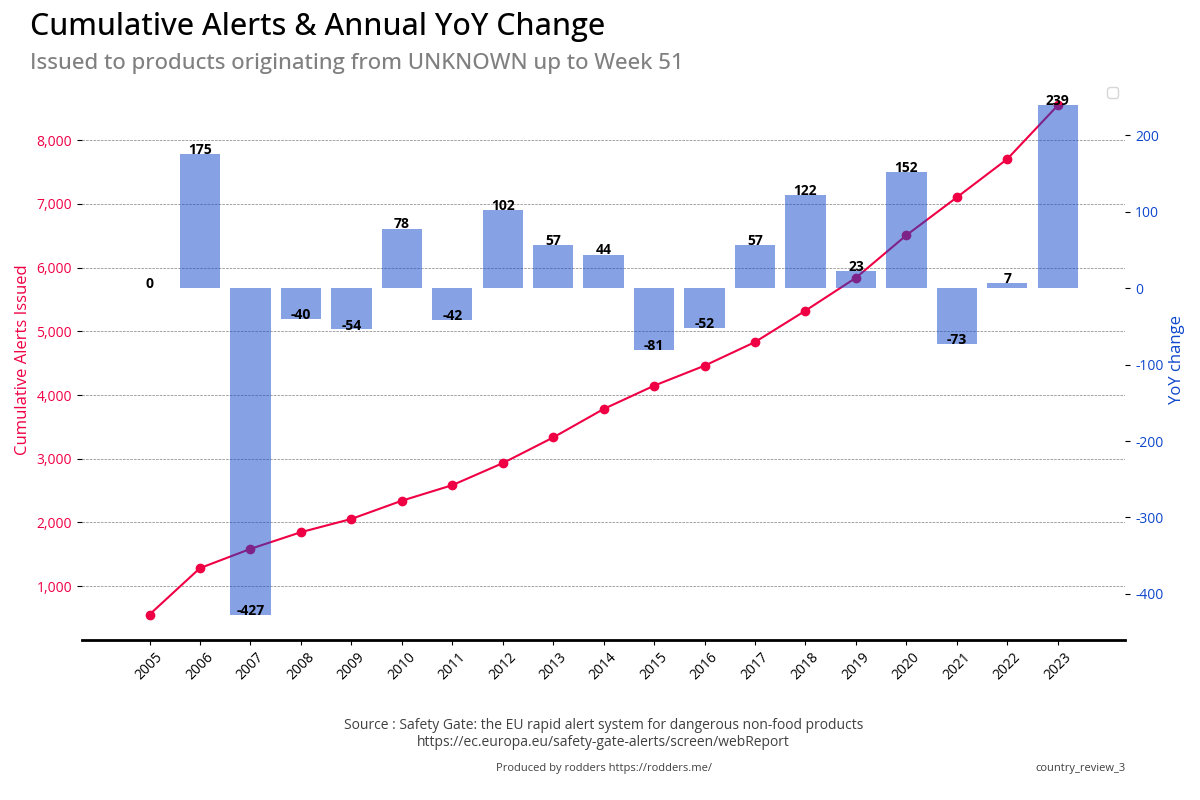
Within the Top 15 countries are two entries :
other Where the country isn't in the top 15, and represents 2,933 products or 8.4% of the totalUnknown Where the reporting member didn't record the country of origin, and represents 9,173 products, or 25.8% of the total Alerts issuedAnnual Alerts
All Countries' of product origin Annual Alerts
All Countries' of product origin percentage of Alerts issued
Go to Top
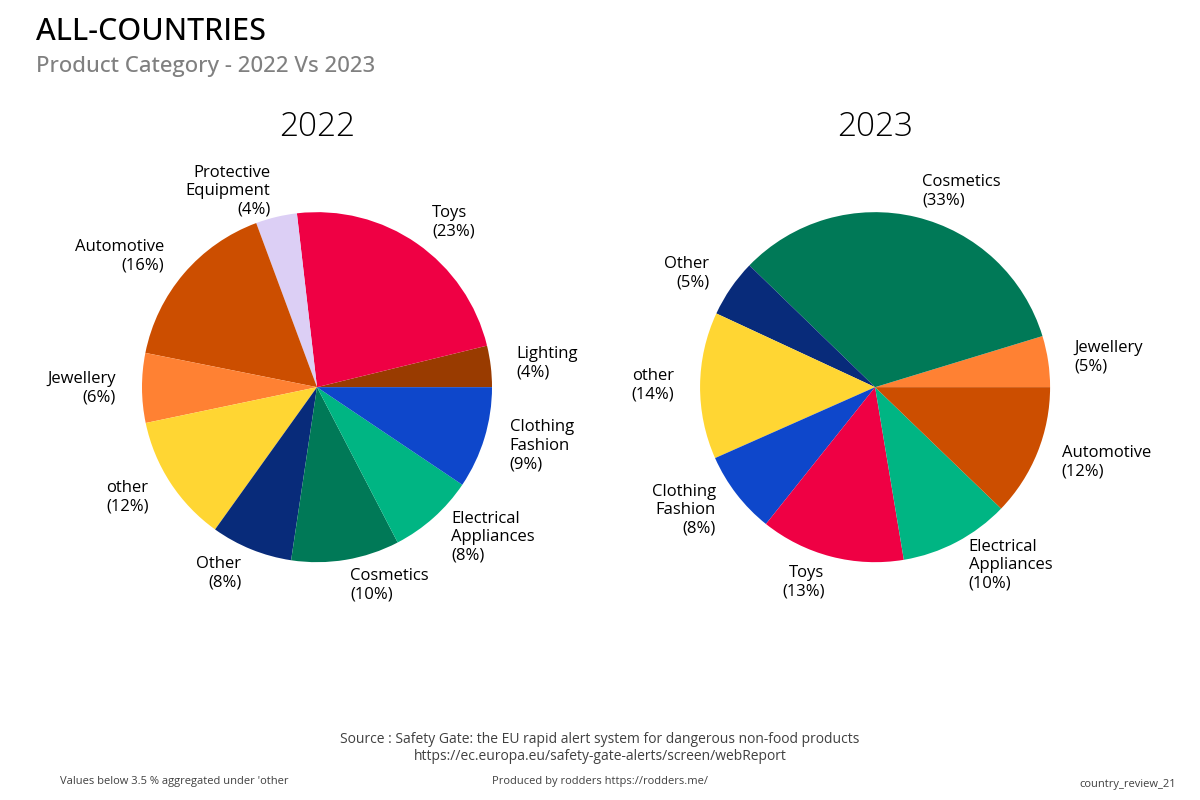
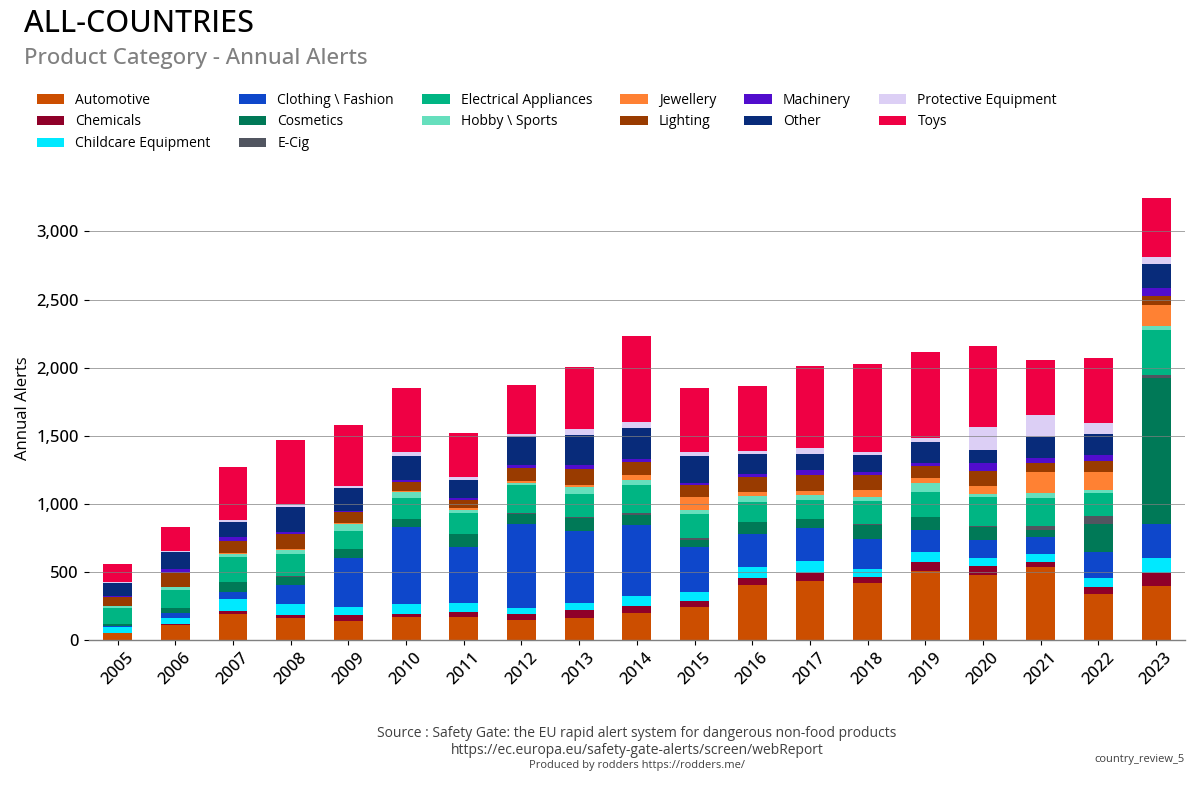
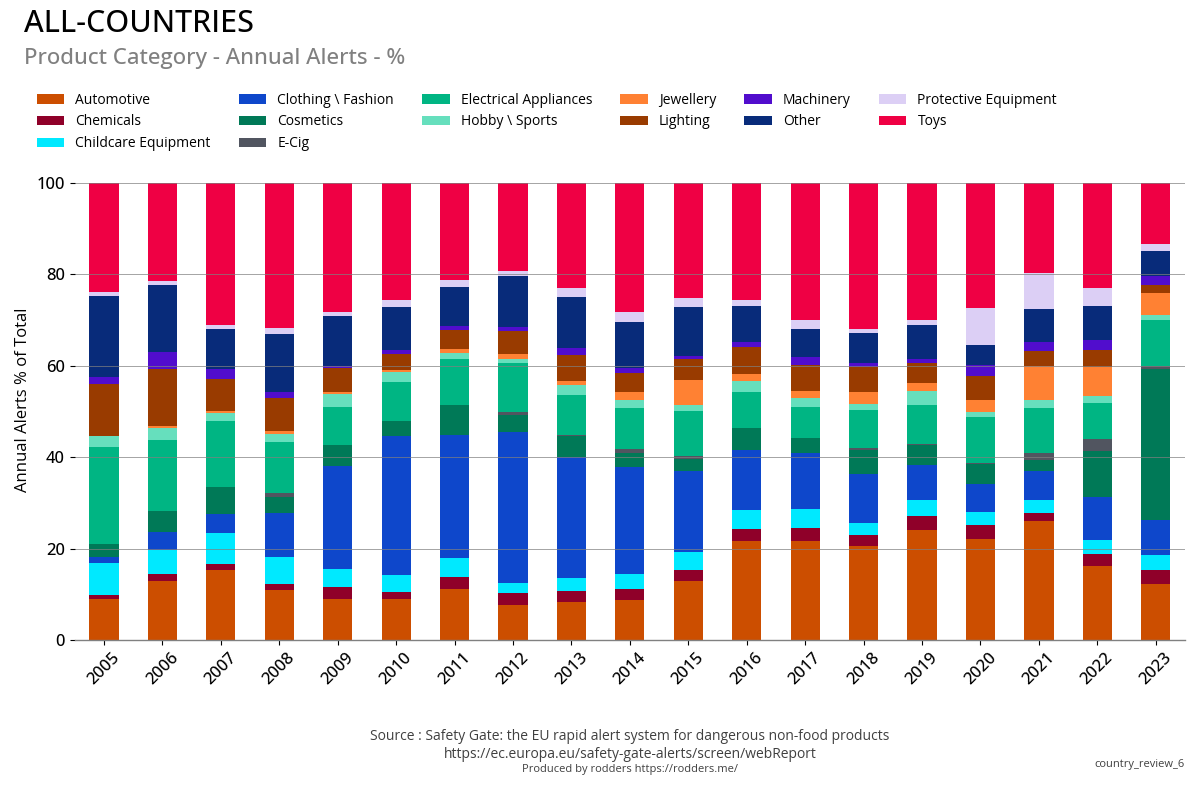
Product Categories
Previous Year Vs Current Year
Total & Annual Alerts
Over the last few years the Toys and Automotive categories are generally those with the most safety alerts.
The exception being 2023 where cosmetics took the top spot with 32% of all alerts issued being for cosmetic products.
Annual Count
Annual Percent of Total
Go to Top
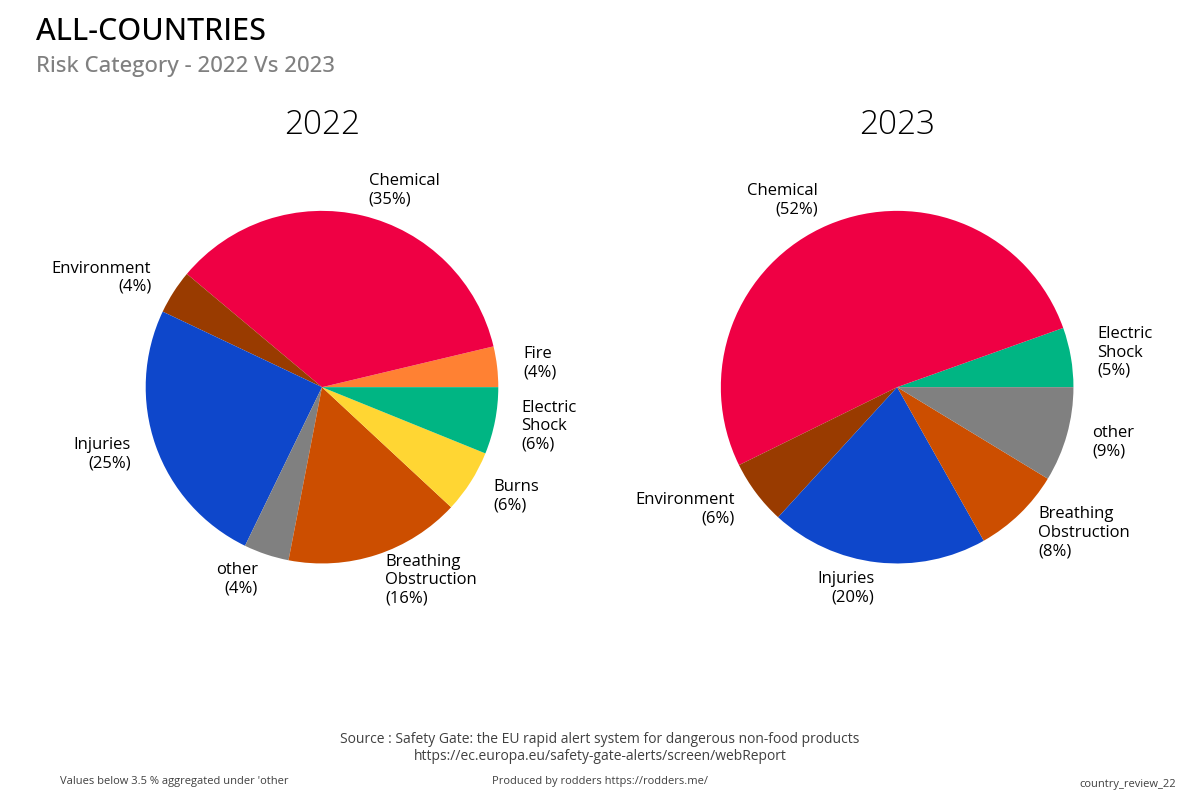
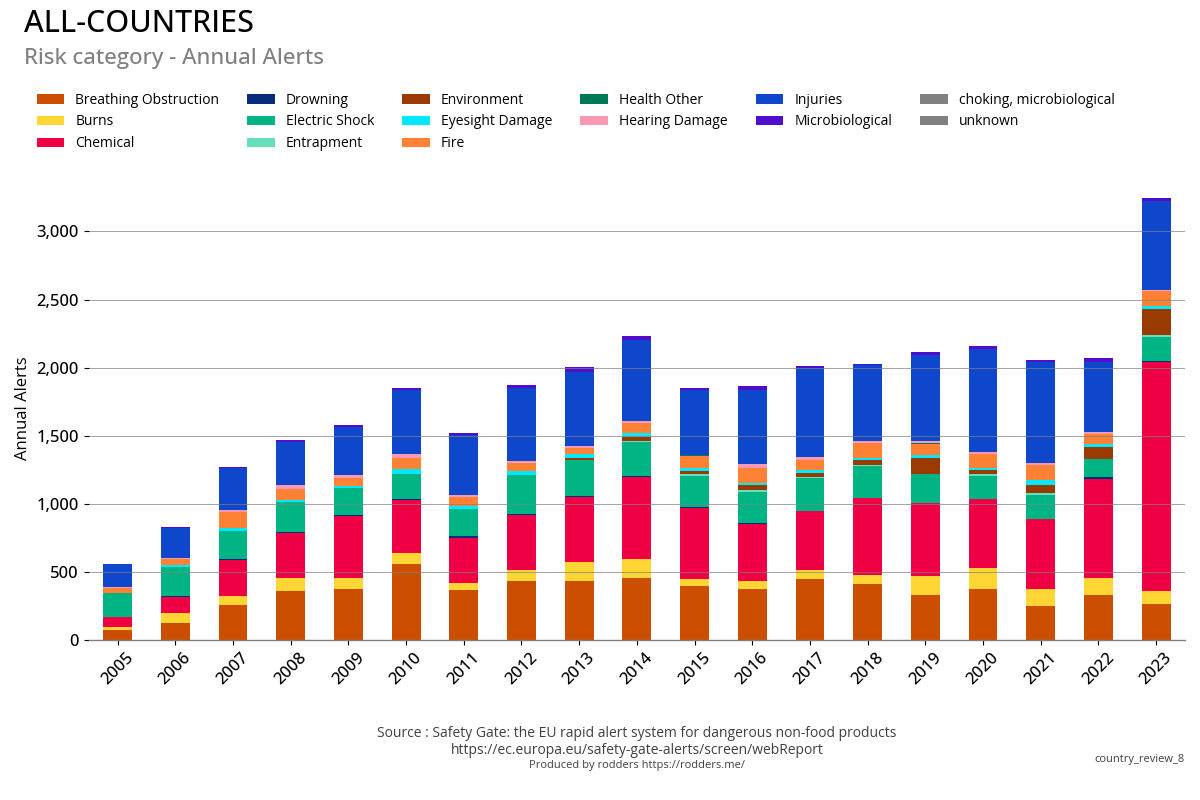
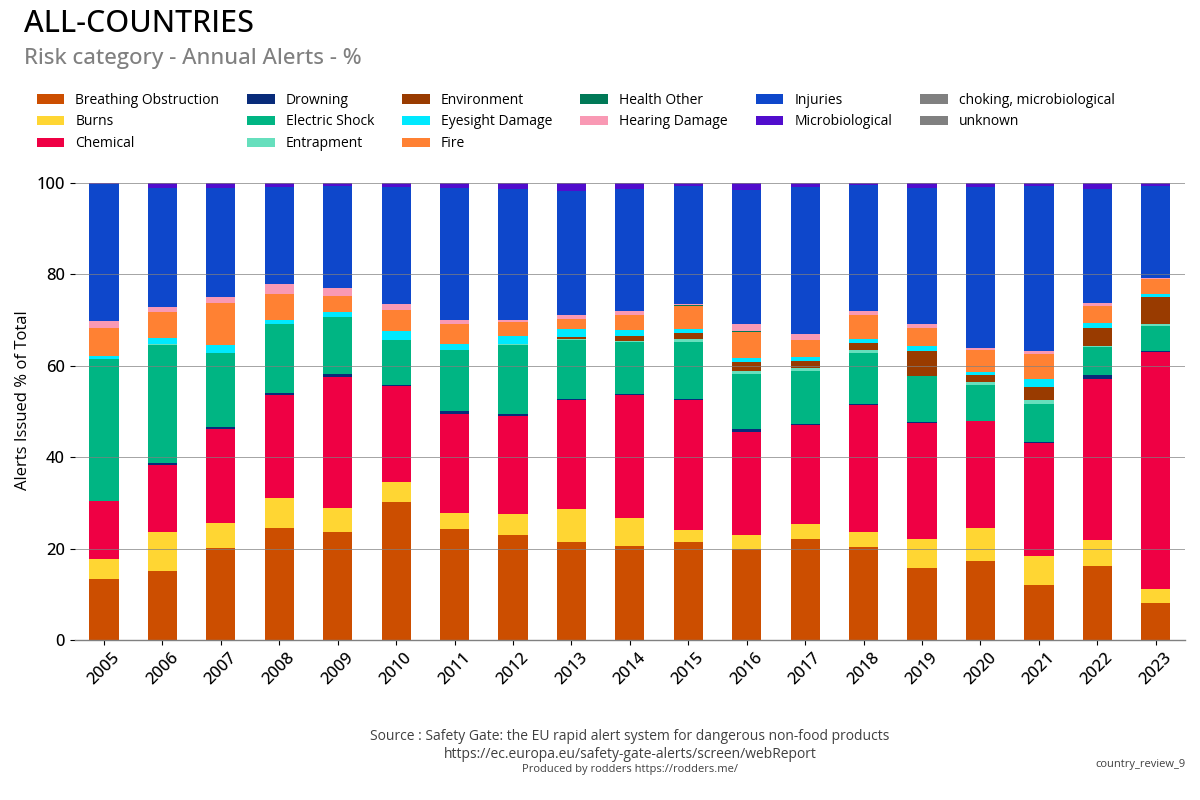
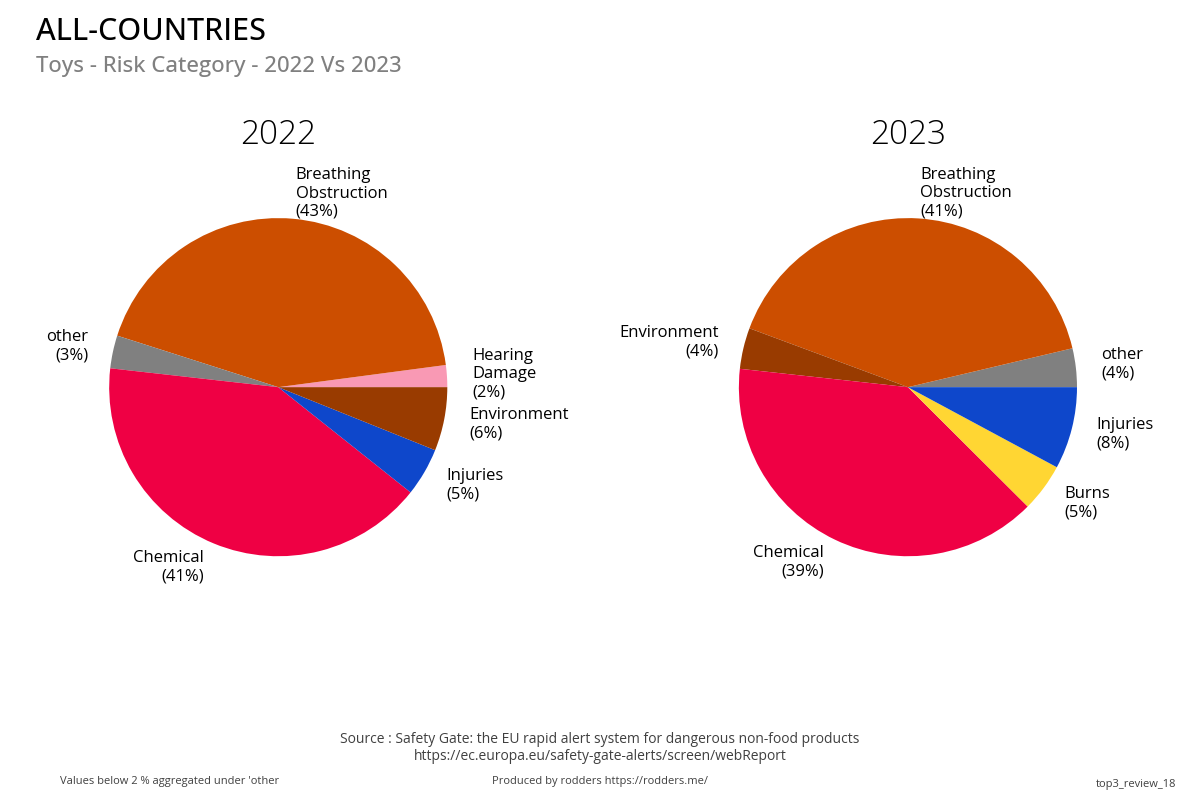
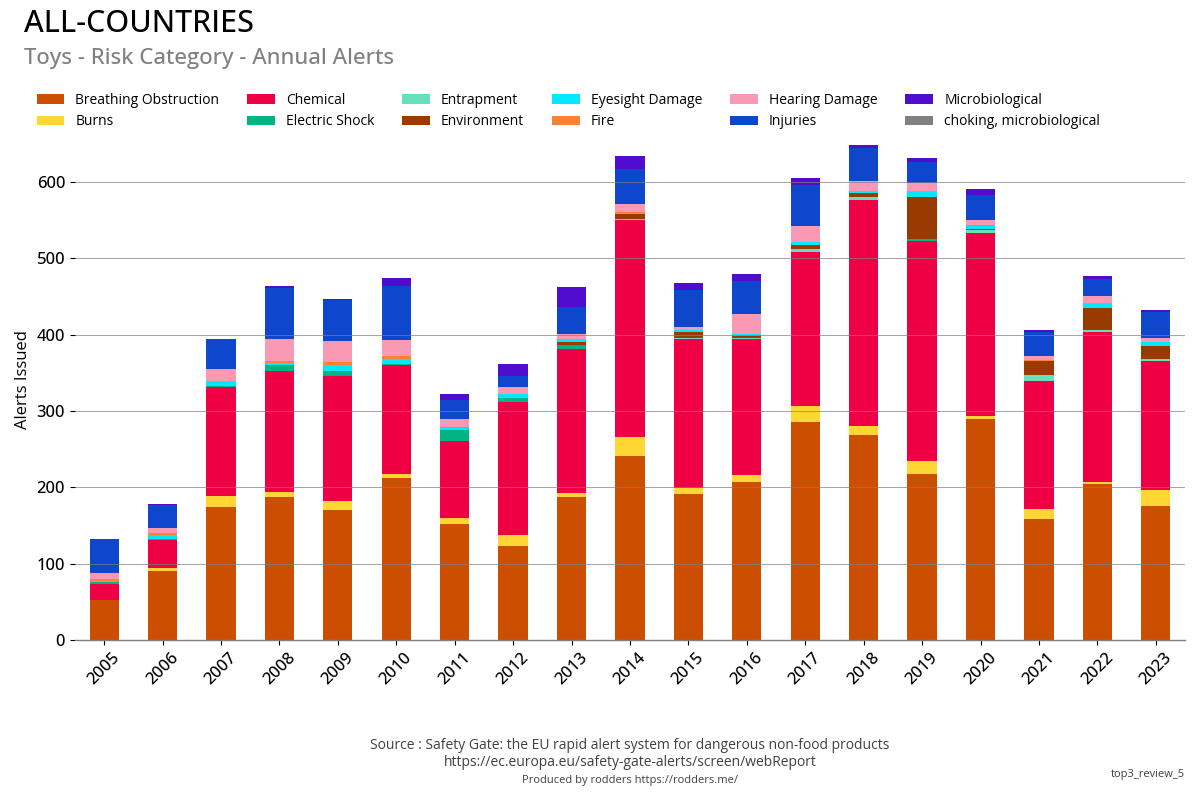
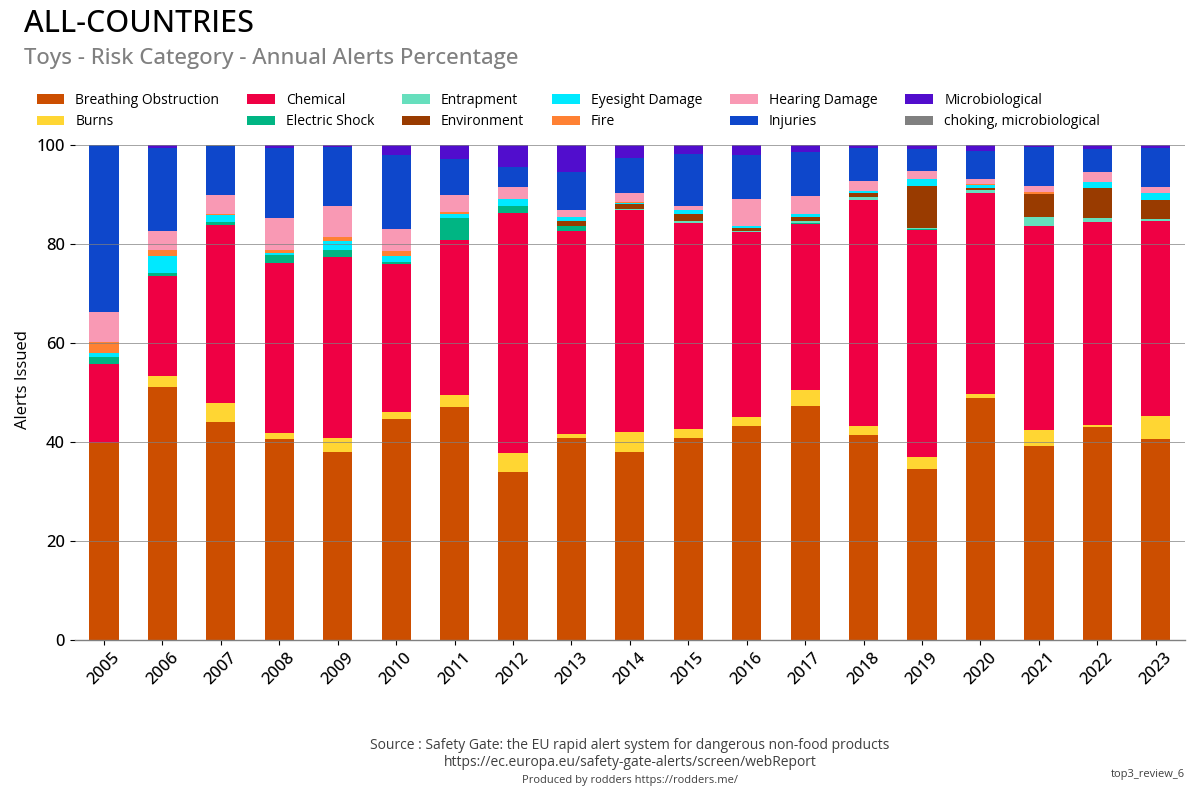
Risk Category
The majority of Injury risks come from the automotive product category (9.7% of 2022/2023 total)
The majority of risks from Toys are breathing obstruction (7% of total) and chemical (7% of total)
As previously noted the cosmetics risk is from the recent ban of BMHCA
Previous Year Vs Current Year
Total & Annual Alerts
Annual Count
Annual Percent of Total
Go to Top
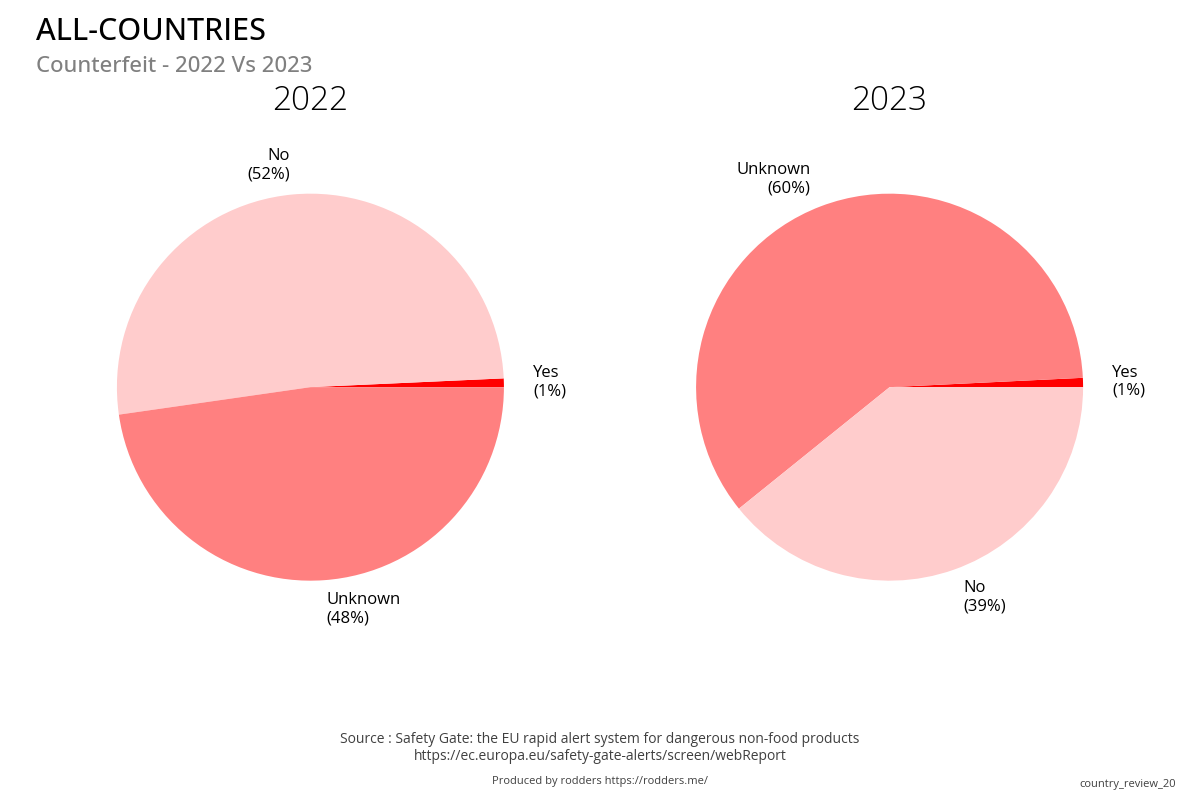
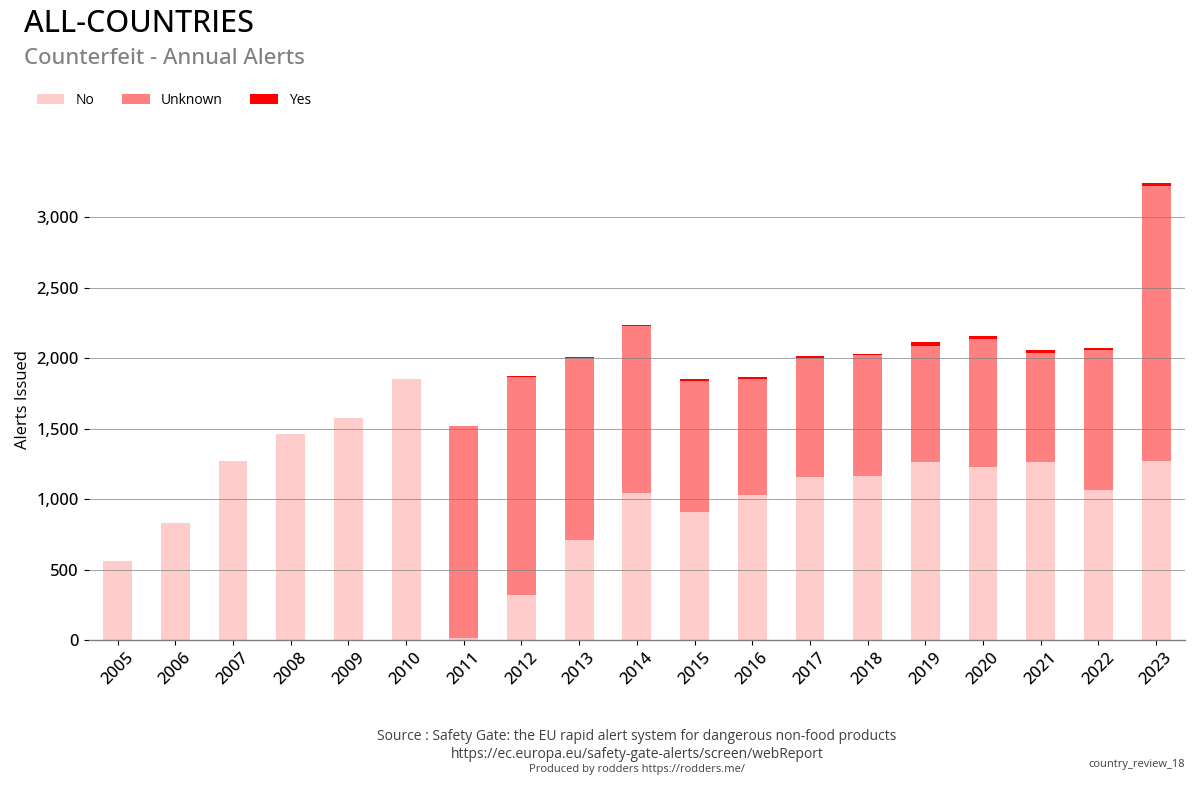
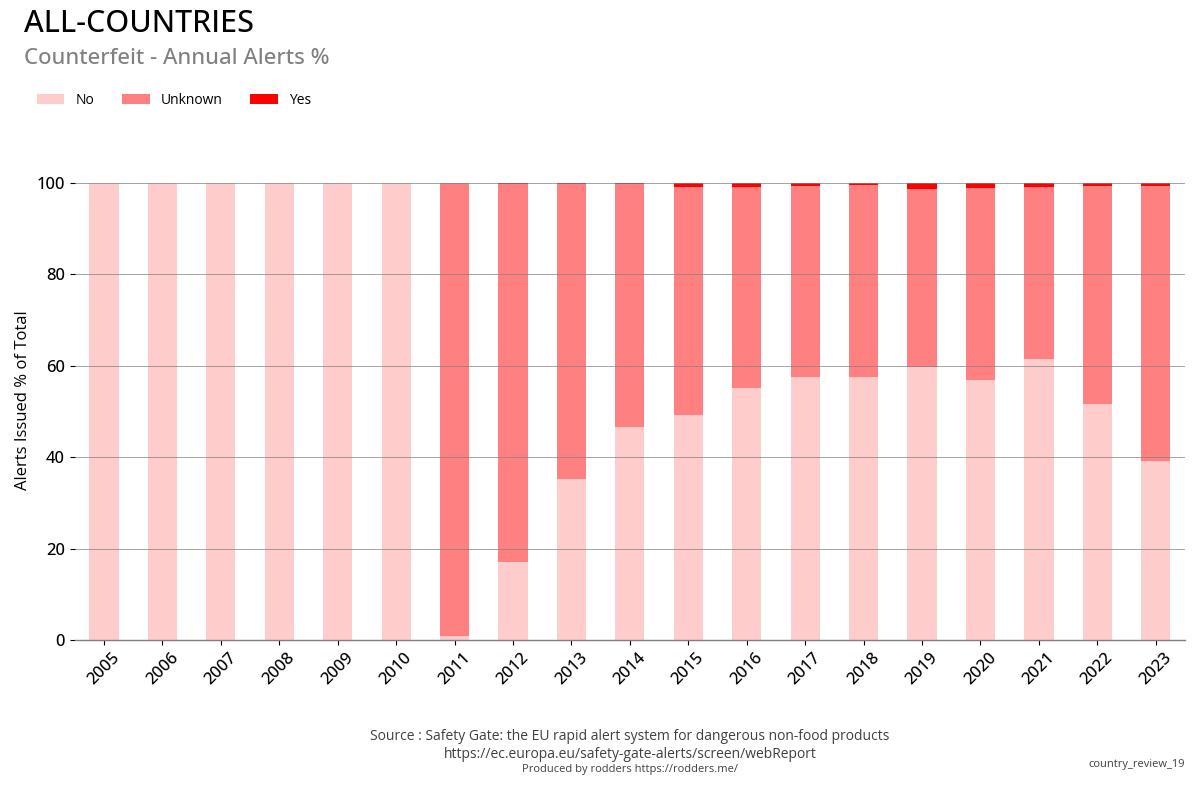
Counterfeit type
Previous Year Vs Current Year
Total & Annual Alerts
Annual Count
Annual Percent of Total
Go to Top
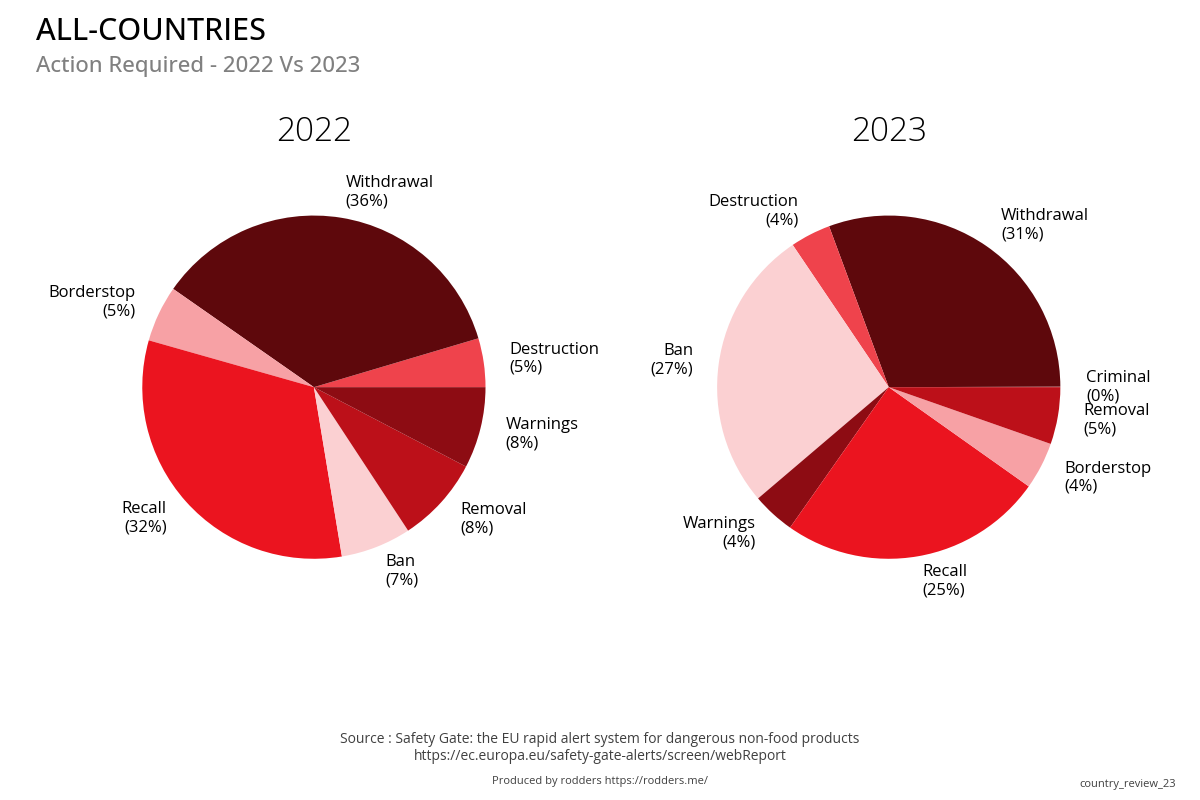
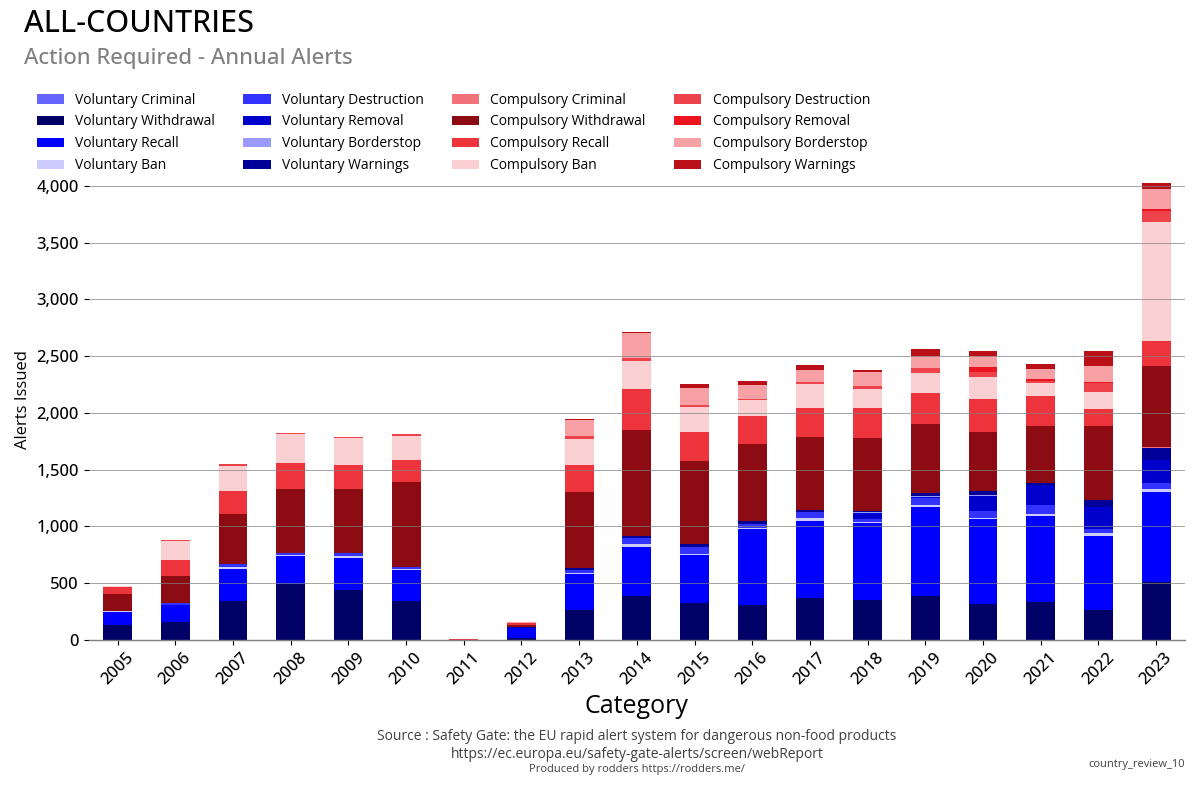
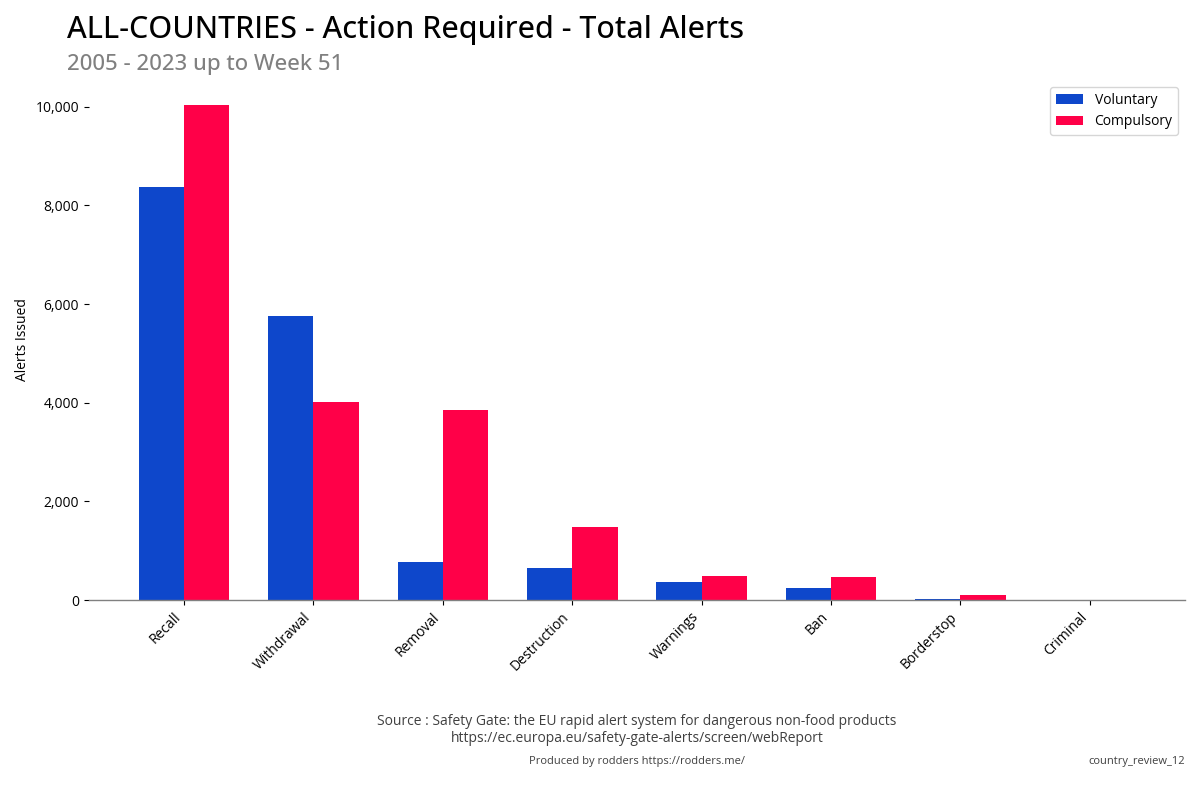
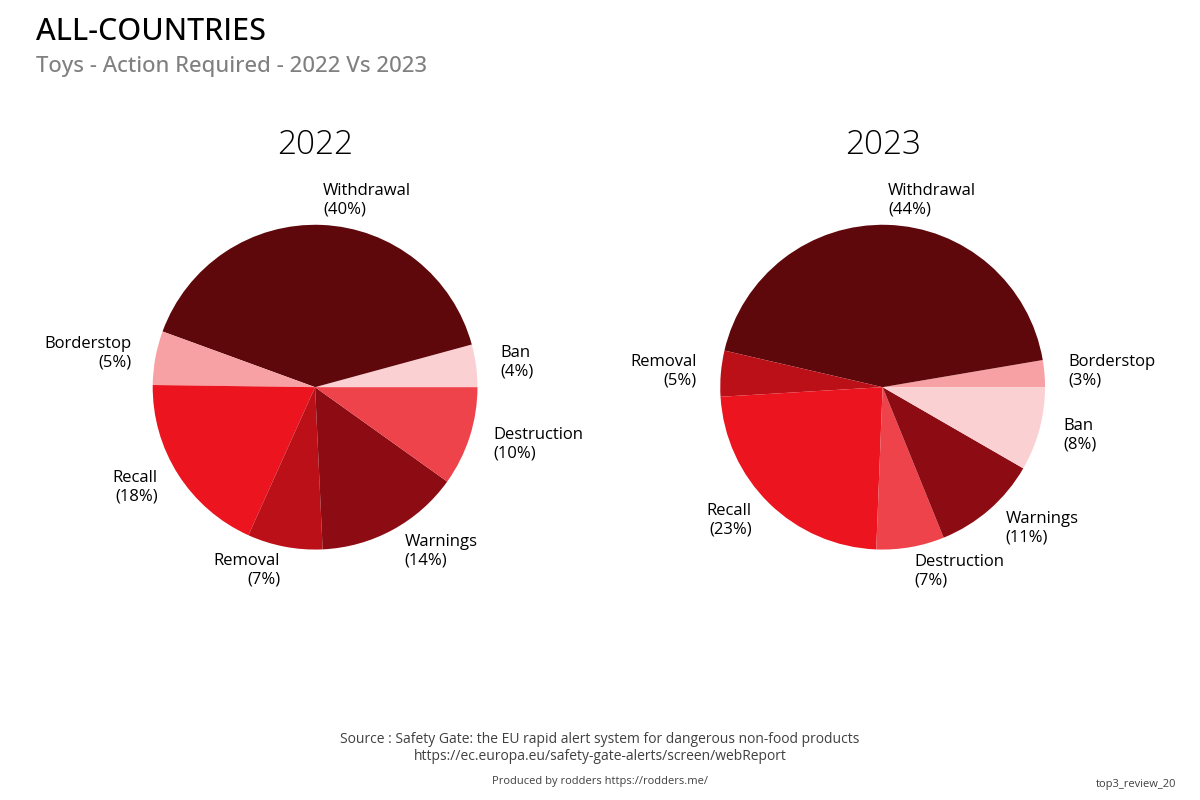
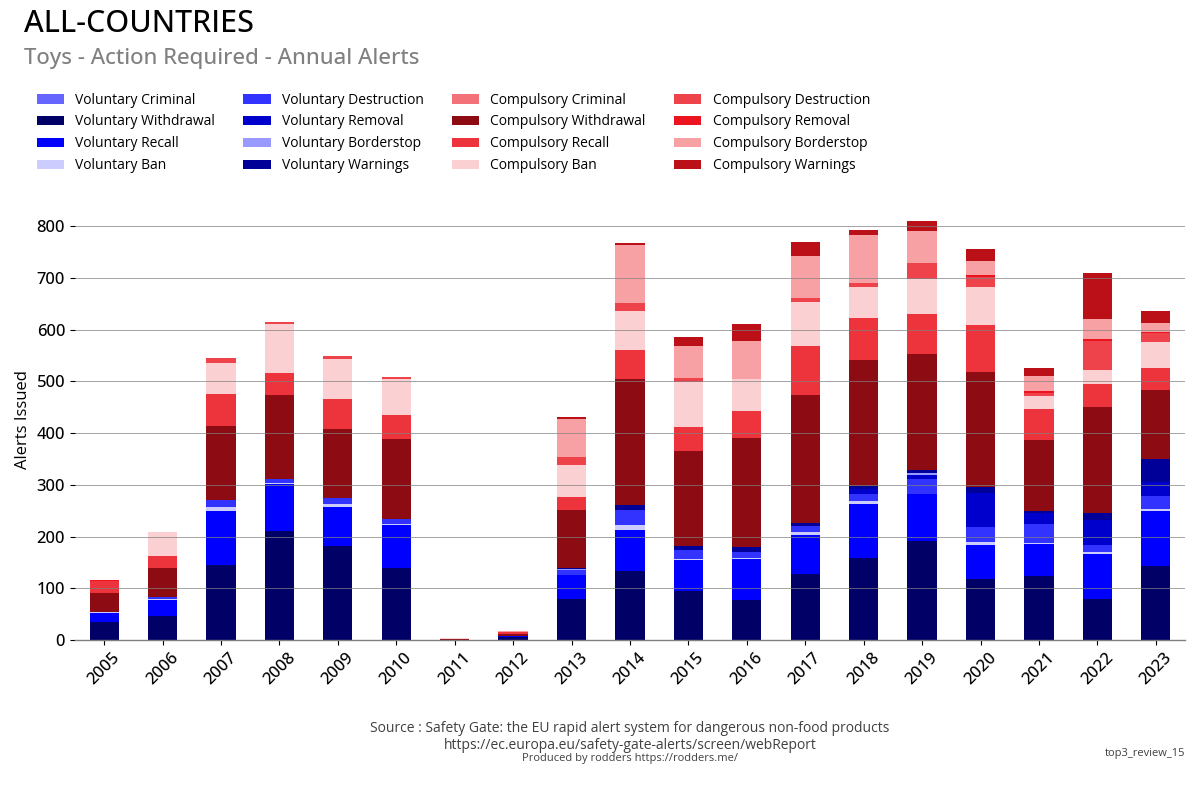
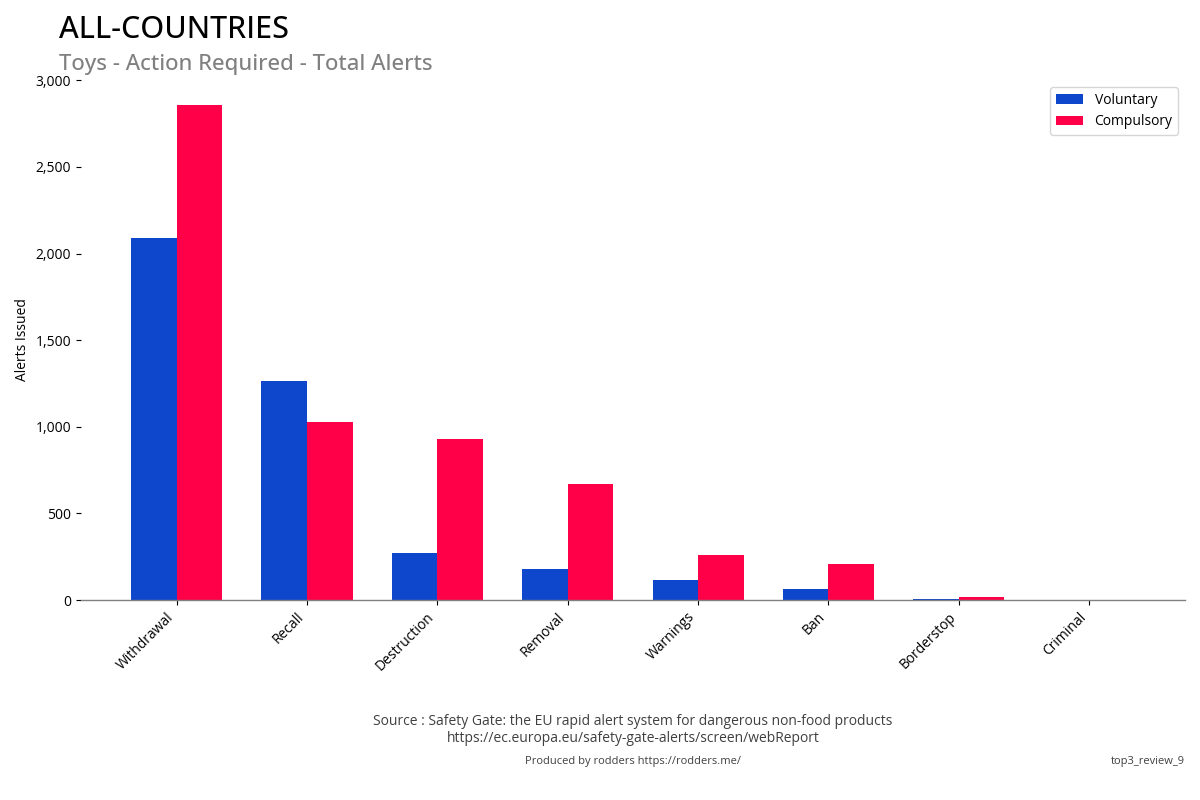
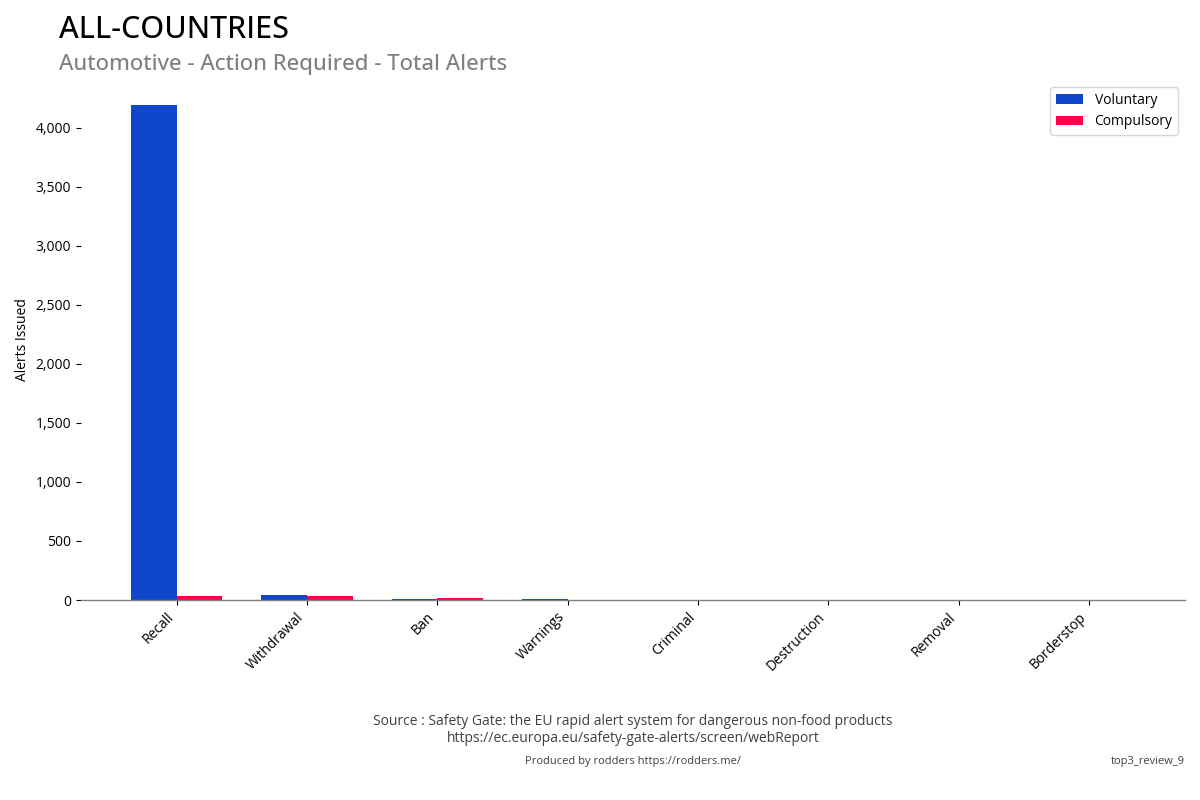
Action Required
The increase in the percentage of alerts requiring a ban from sale in 2023 is due to the ban of the chemical BMHCA in cosmetics.
Previous Year Vs Current Year
Total & Annual Alerts
Annual Action Required
Compulsory Vs Voluntary
Go to Top
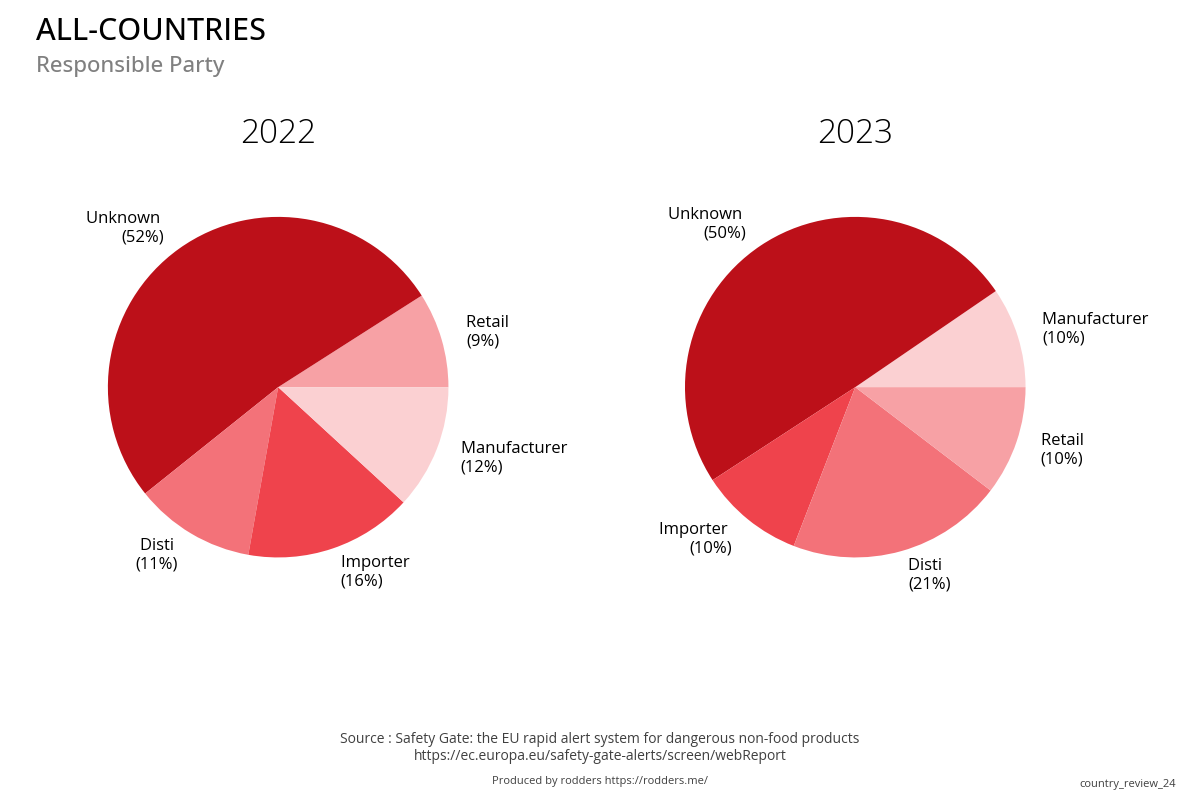
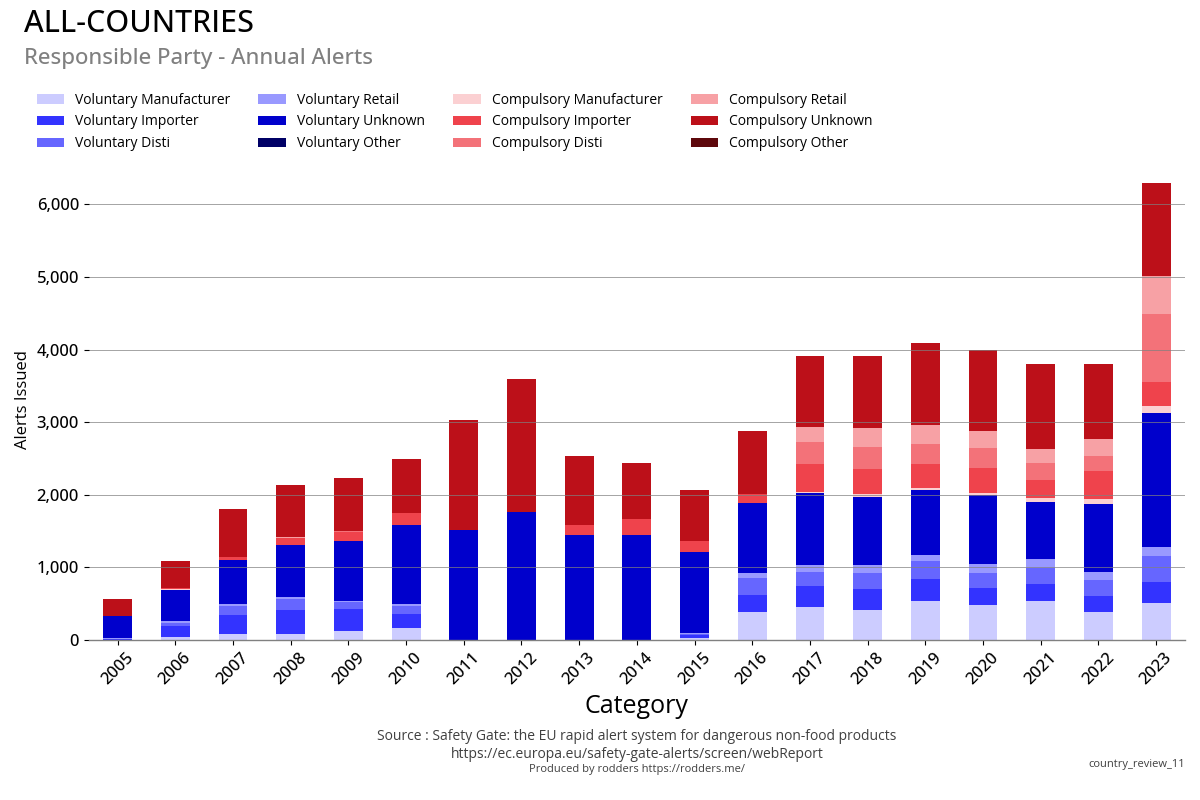
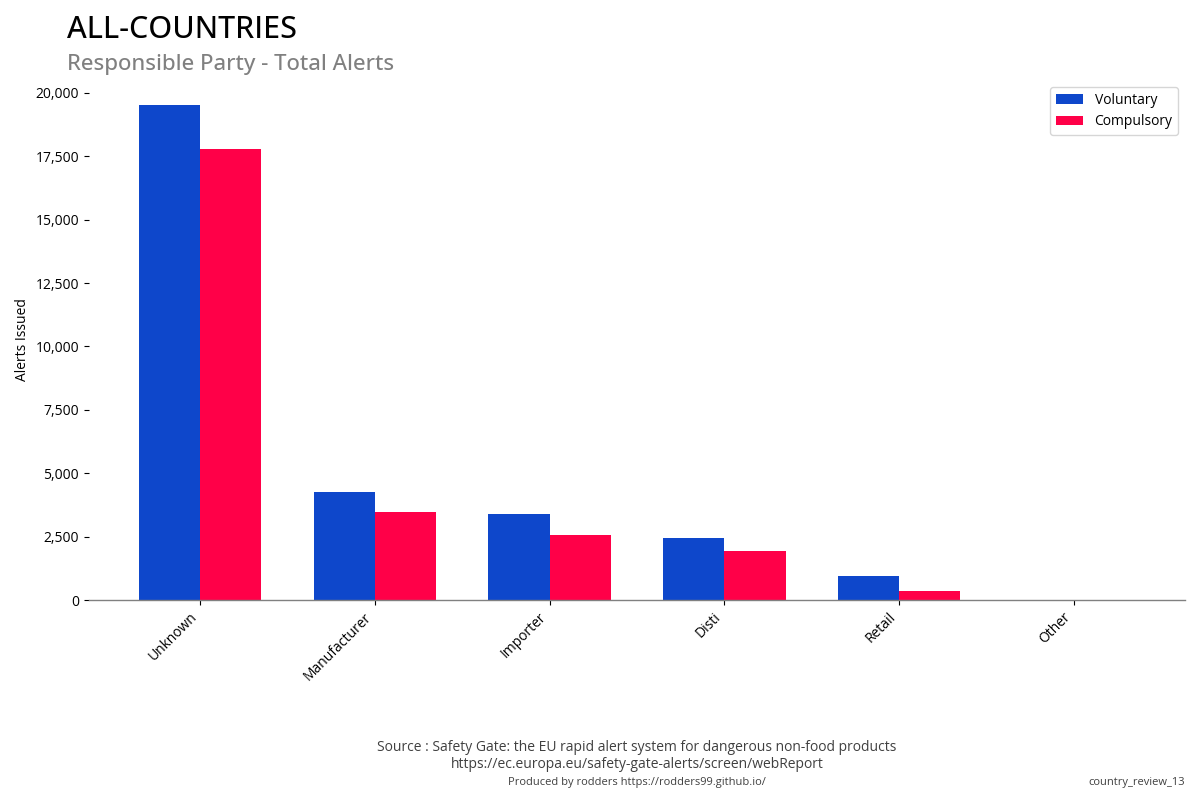
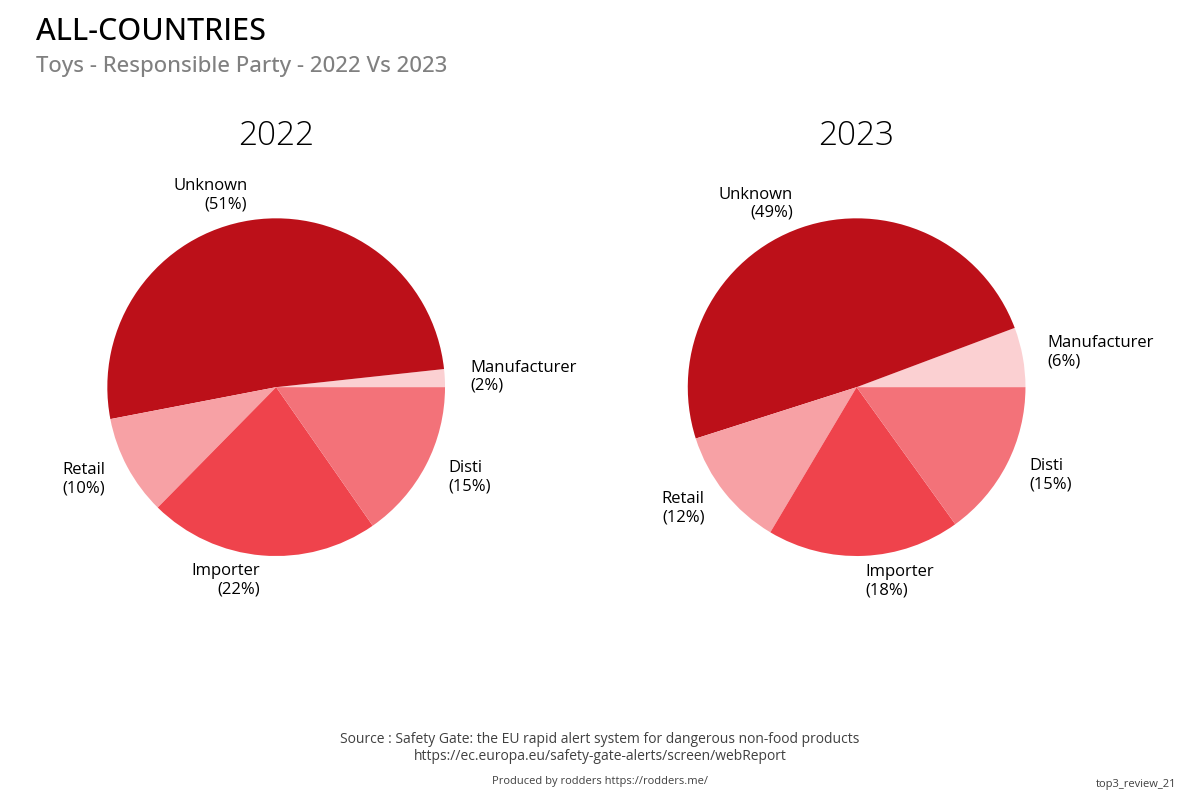
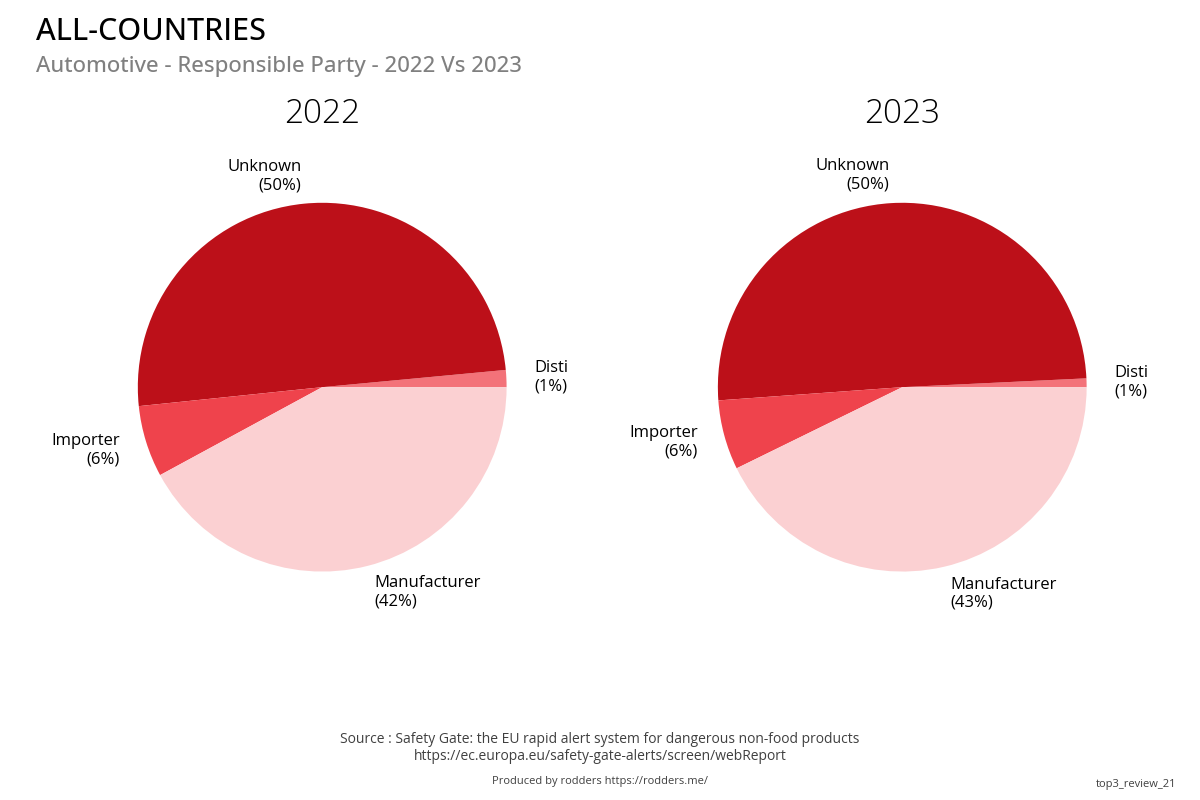
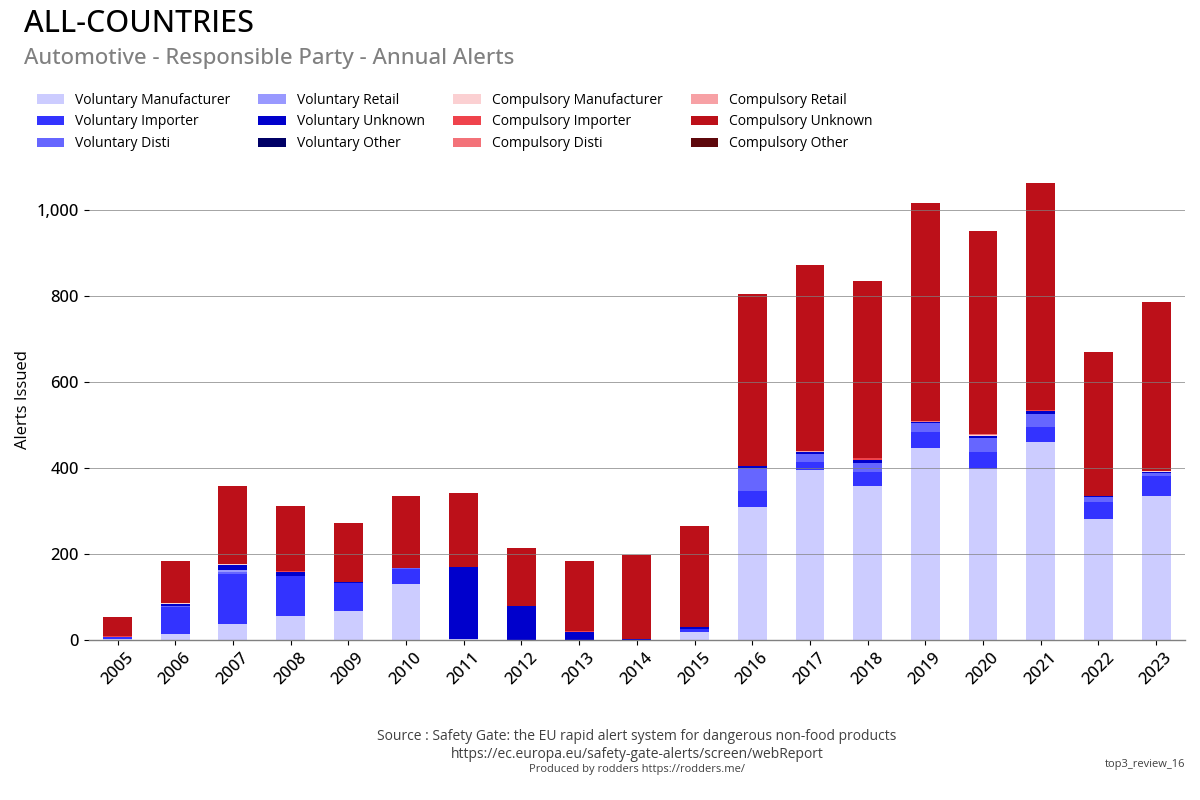
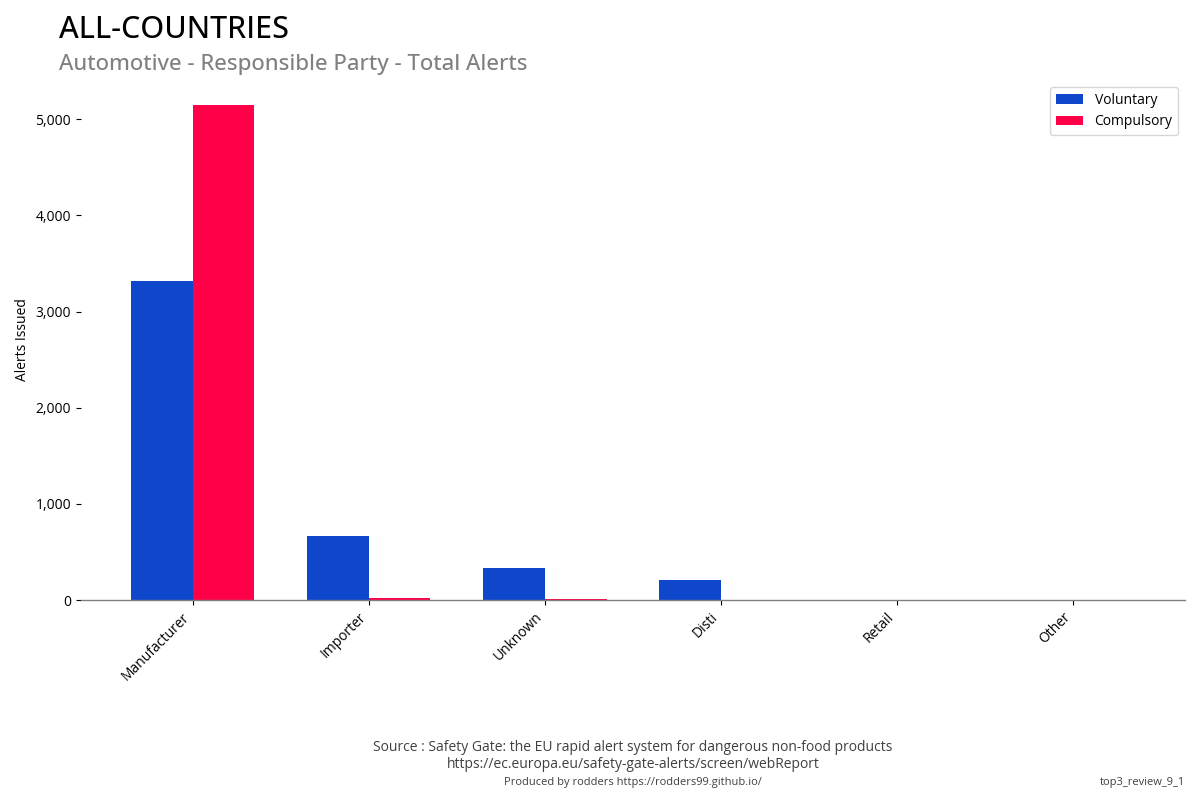
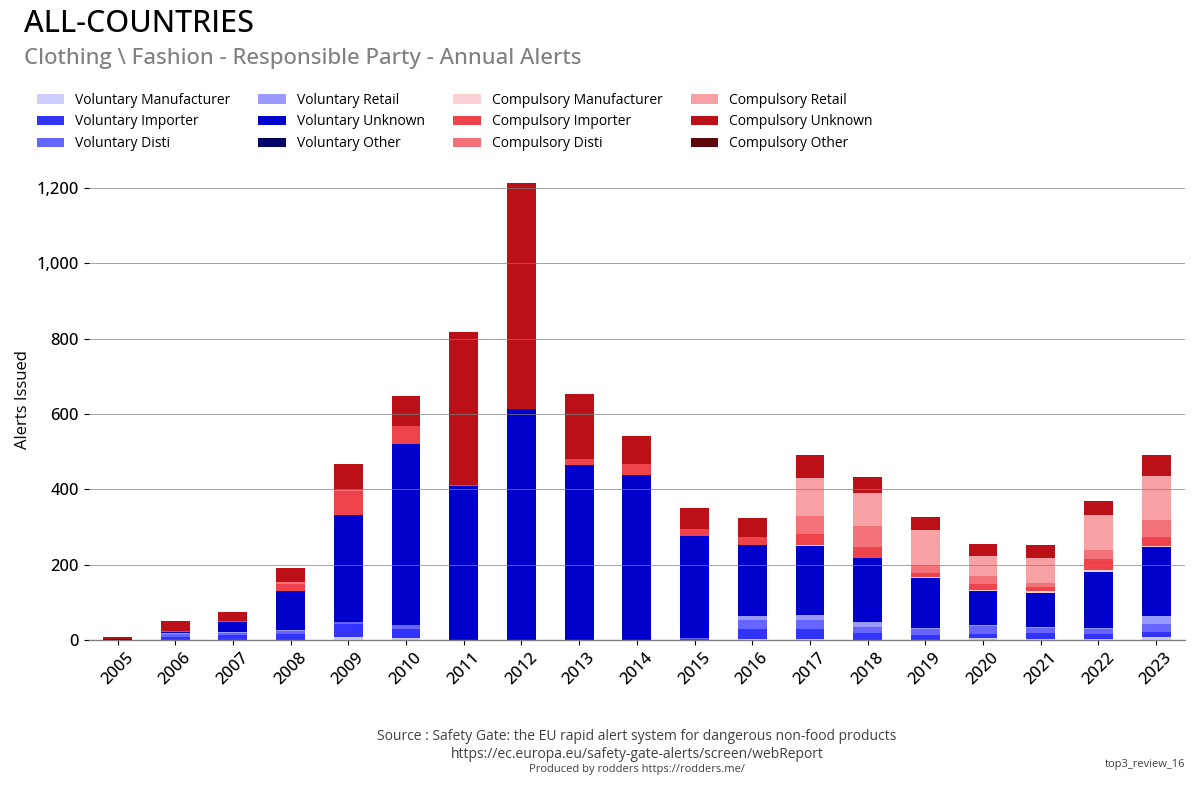
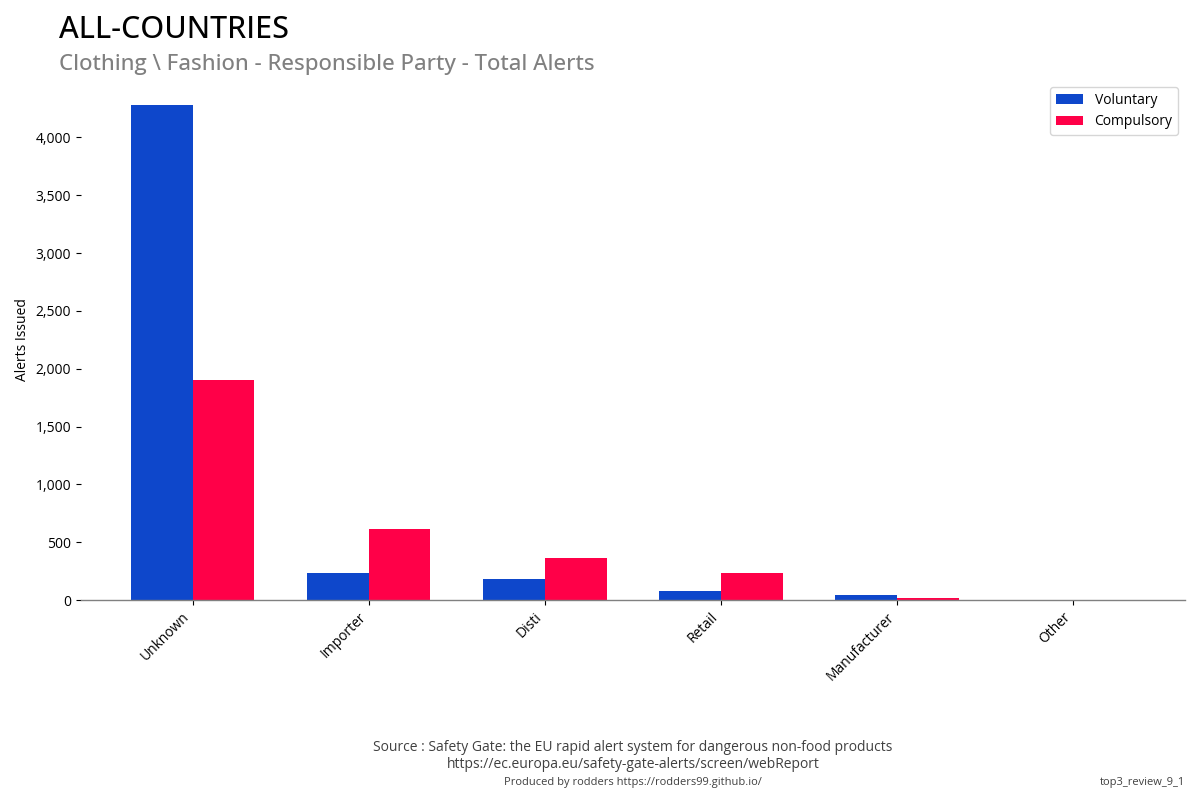
Responsible Party
Previous Year Vs Current Year
Annual Alerts
Annual Responsible Party
Compulsory Vs Voluntary
Go to Top
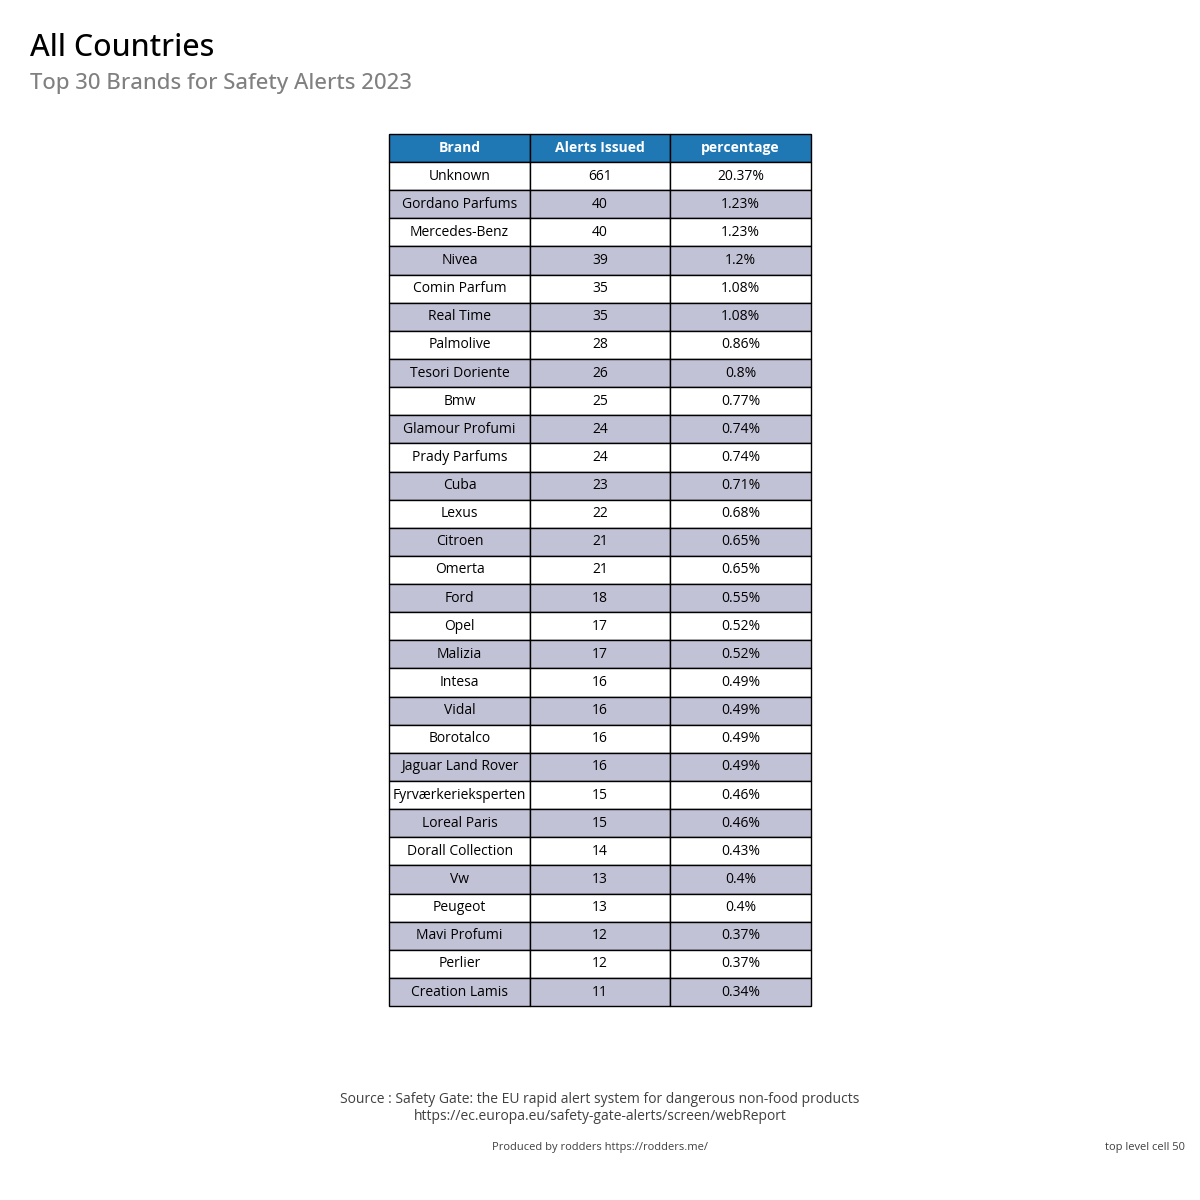
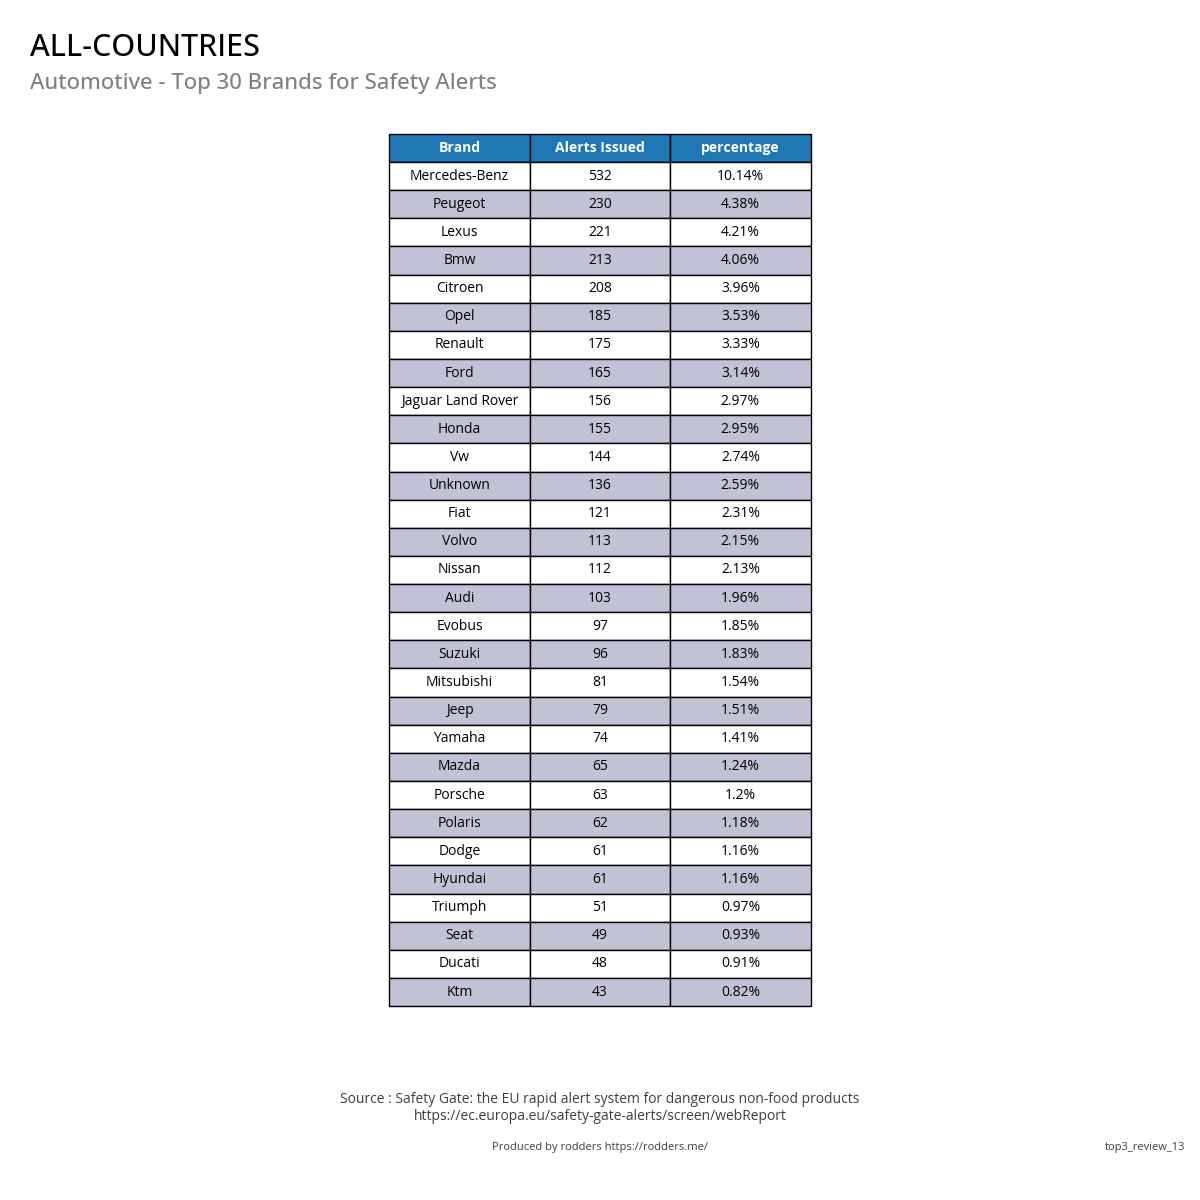
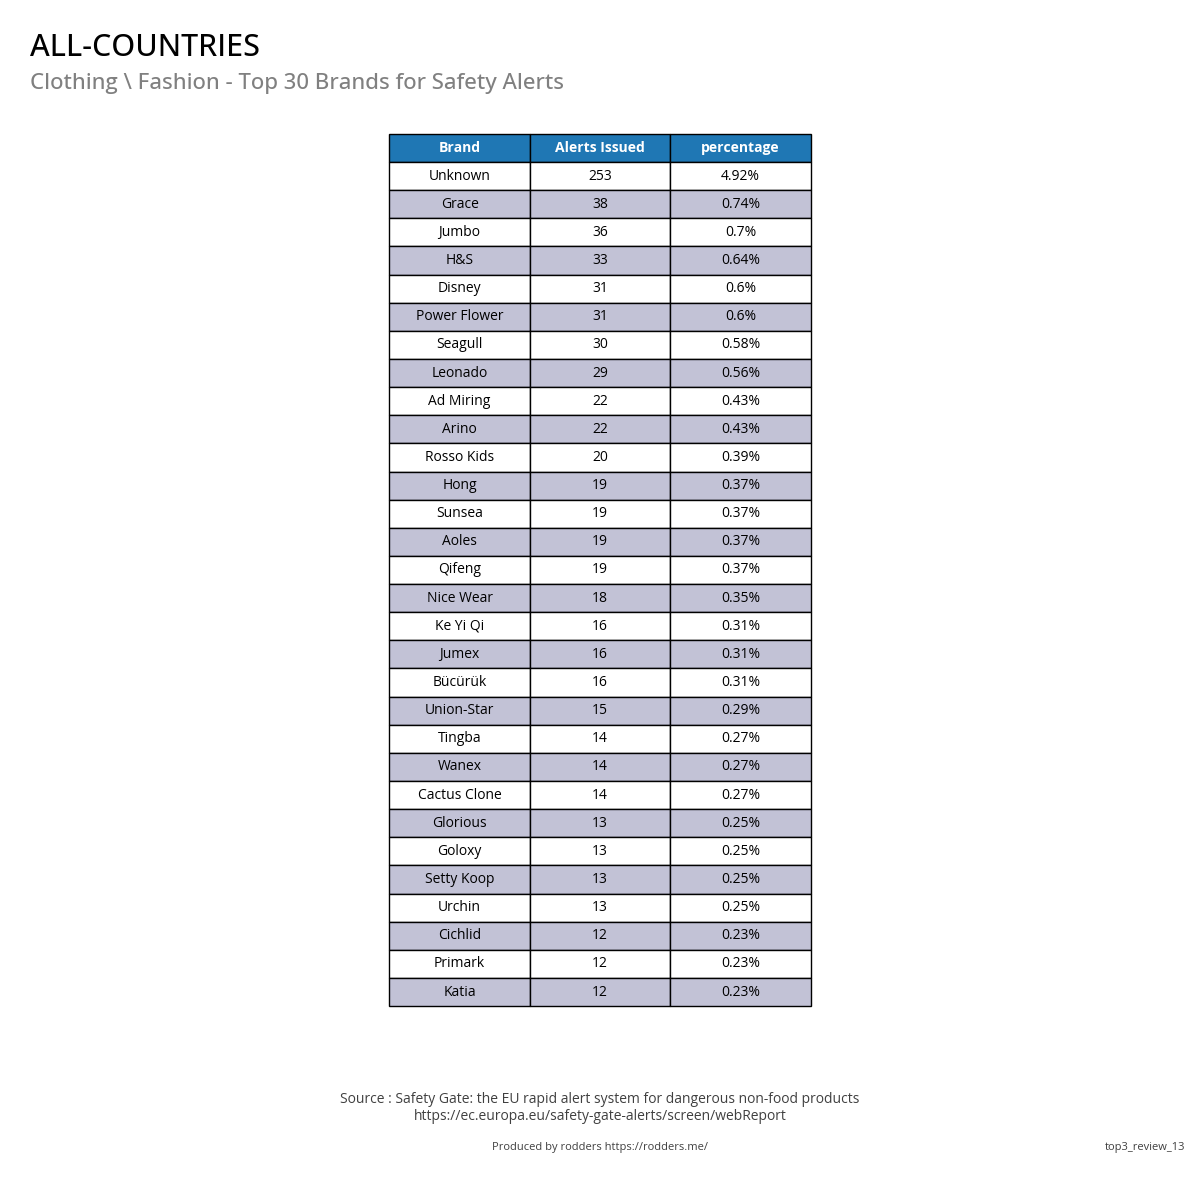
Top 30 Worldwide brands for Safety Alerts
Top 30 Brands
Top 15 Countries - Key Fact sheets
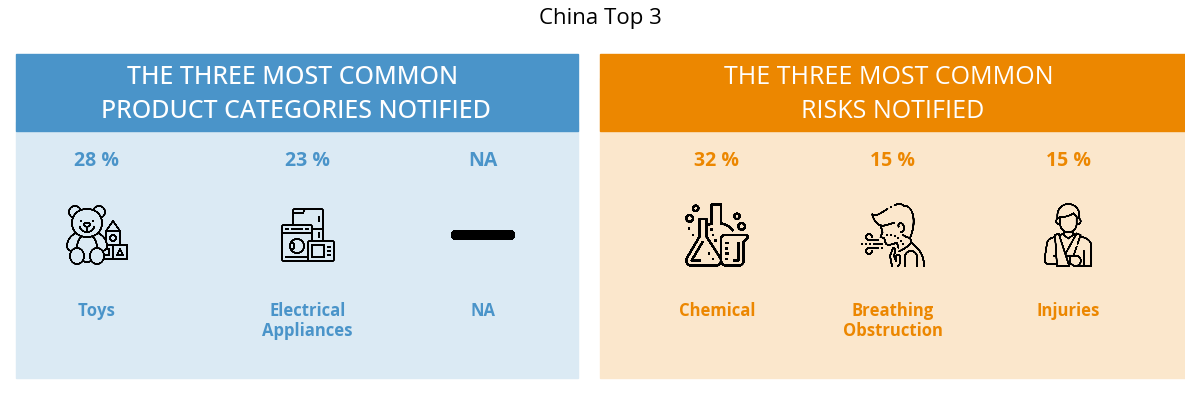
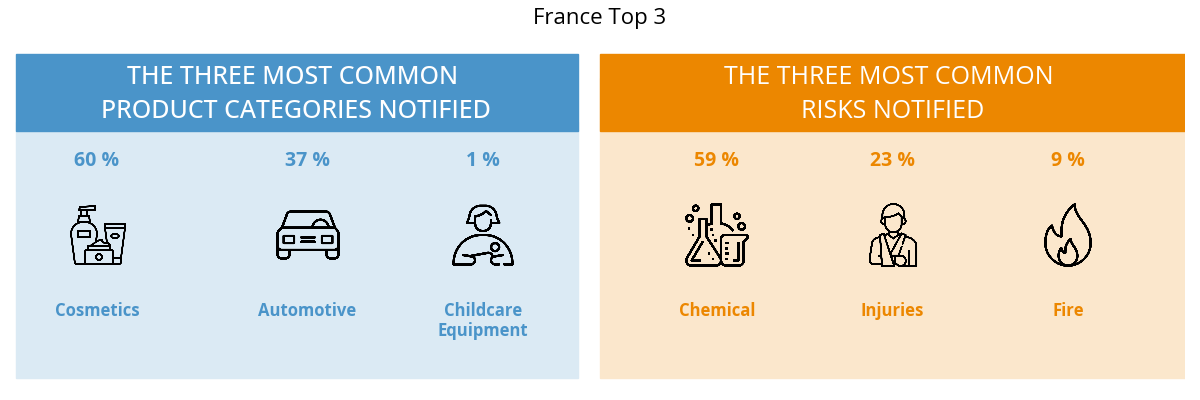
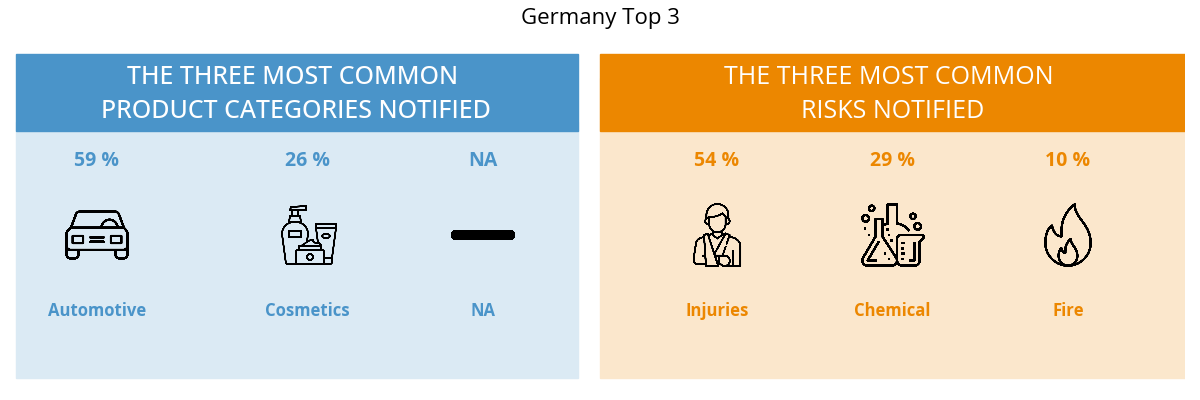
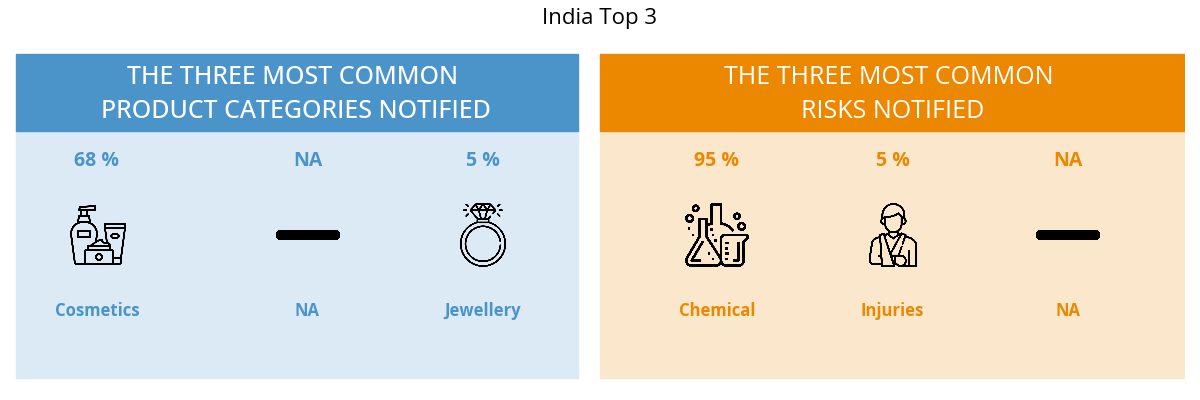
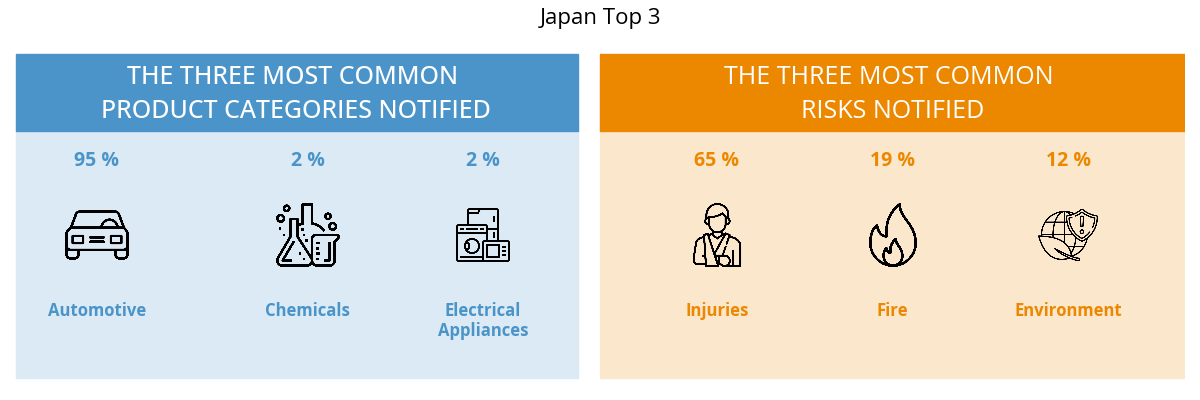
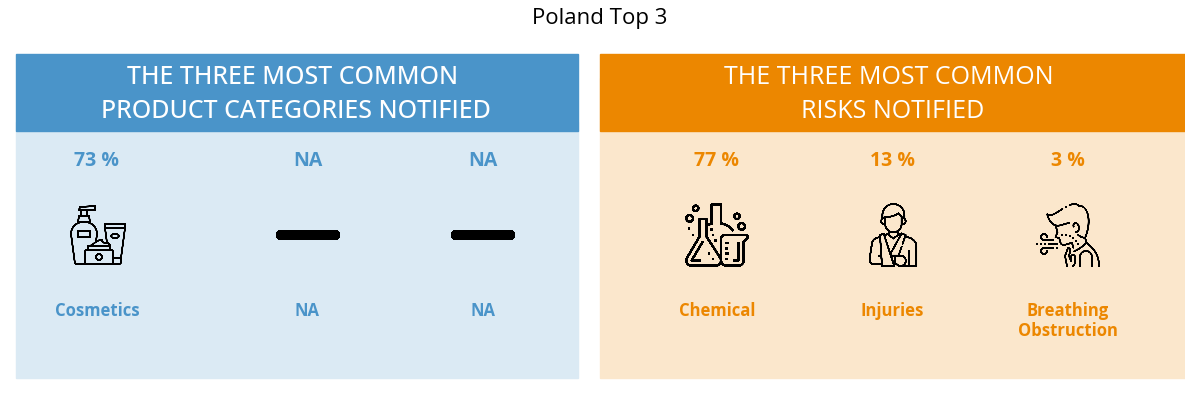
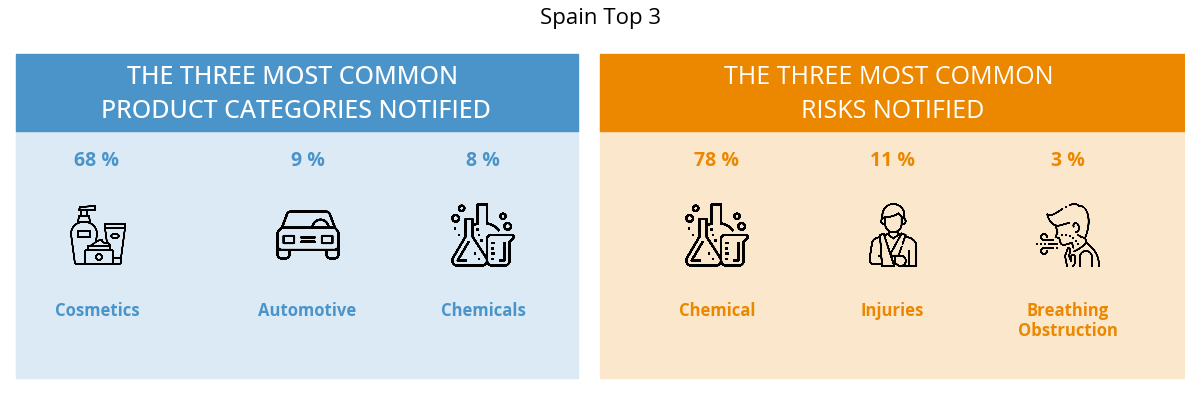
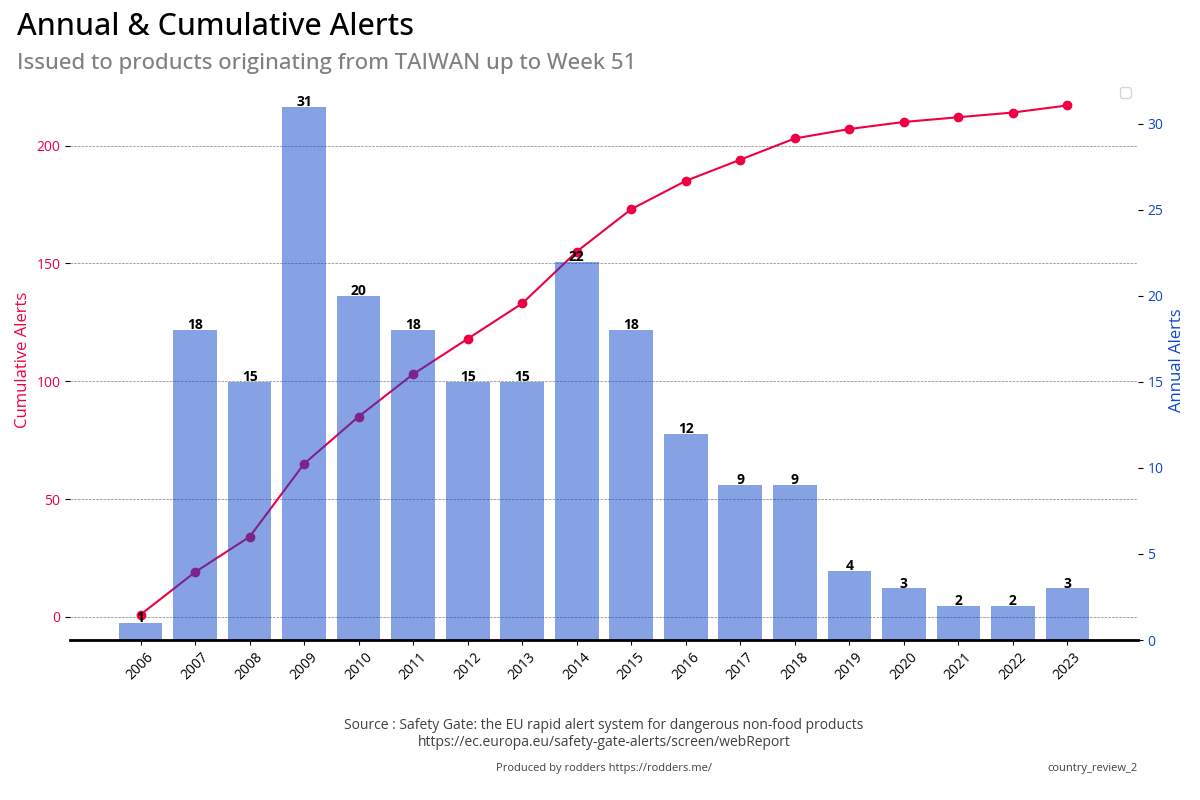
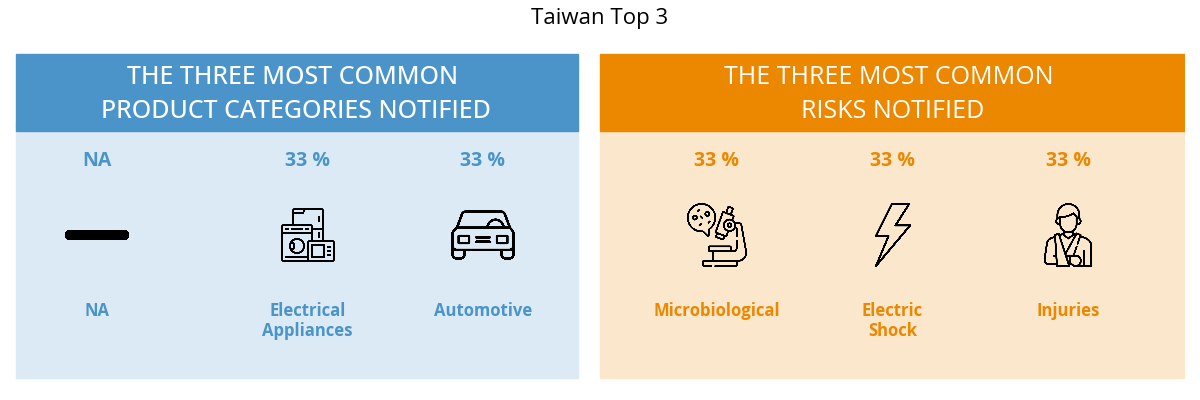
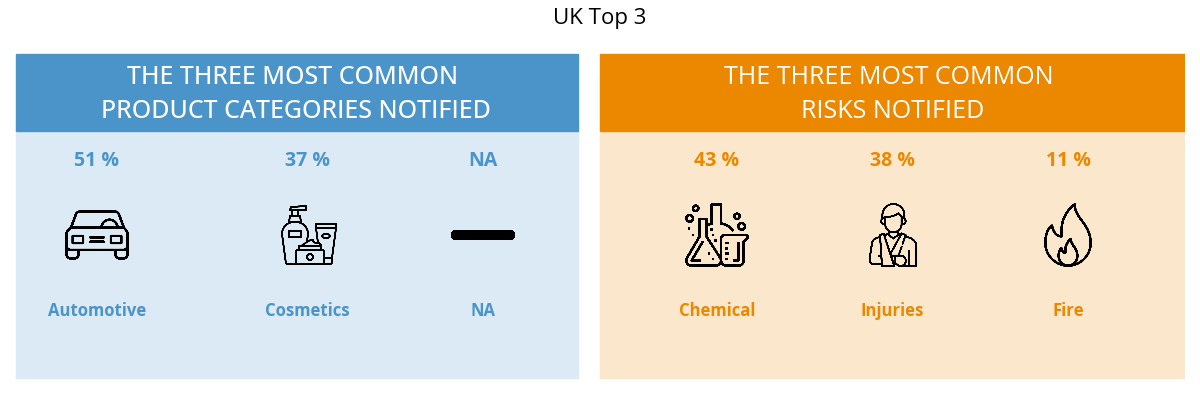
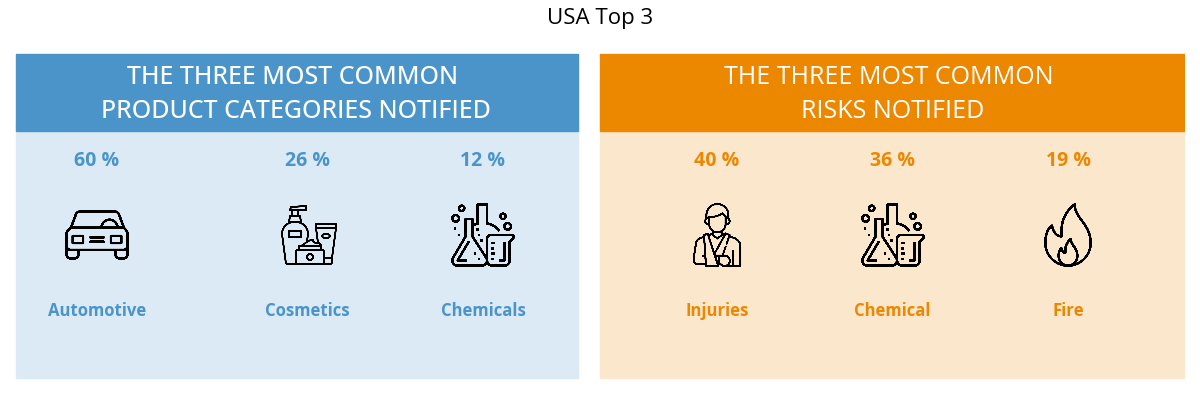
Programmatically created reproductions of the Top 3 Risk and Product categories by country visualisation in the official Fact sheet.
Safety_Gate_2023_Factsheet_EN.pdf
Cumulative, Annual and YoY change / Top3 Categories (Risk/Product)
Top 3 Worldwide Product Categories
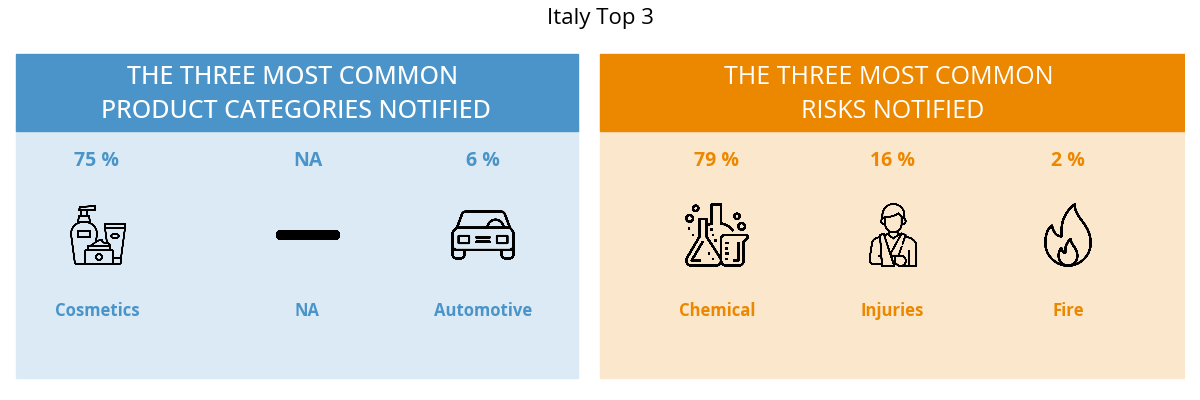
#1 - Top 3 Product Categories
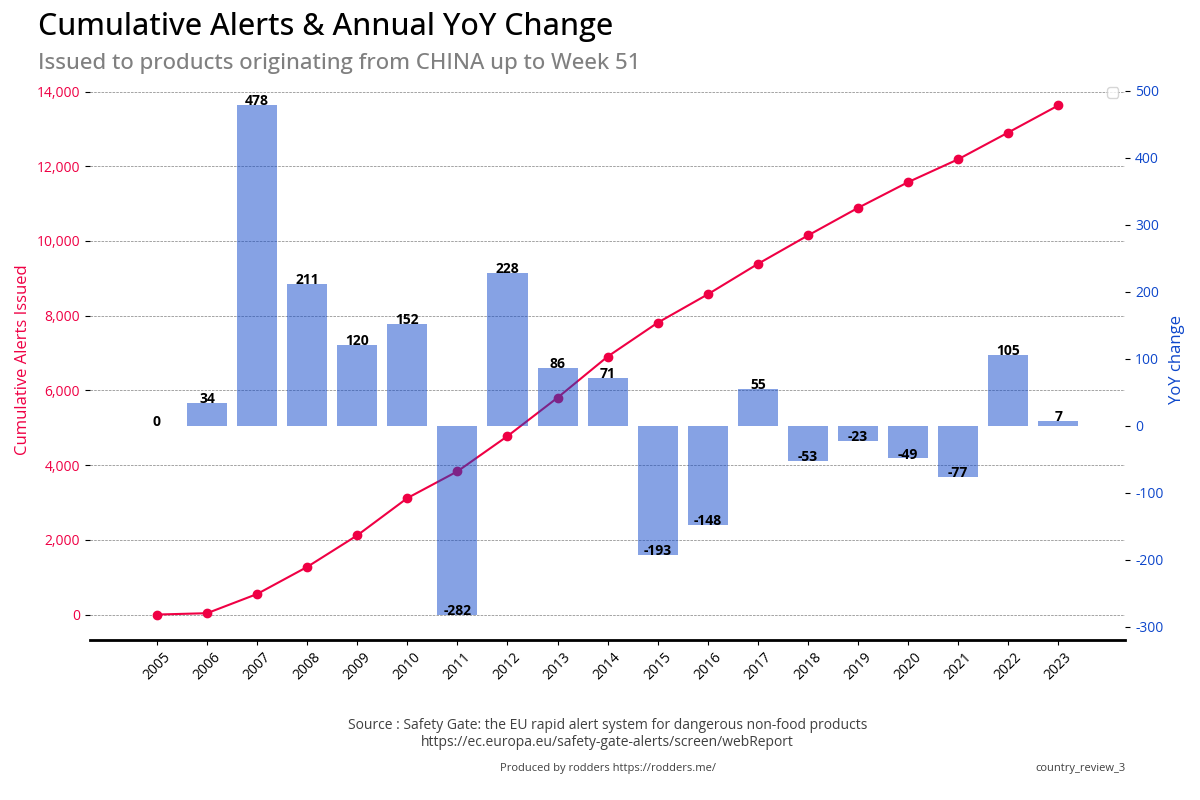
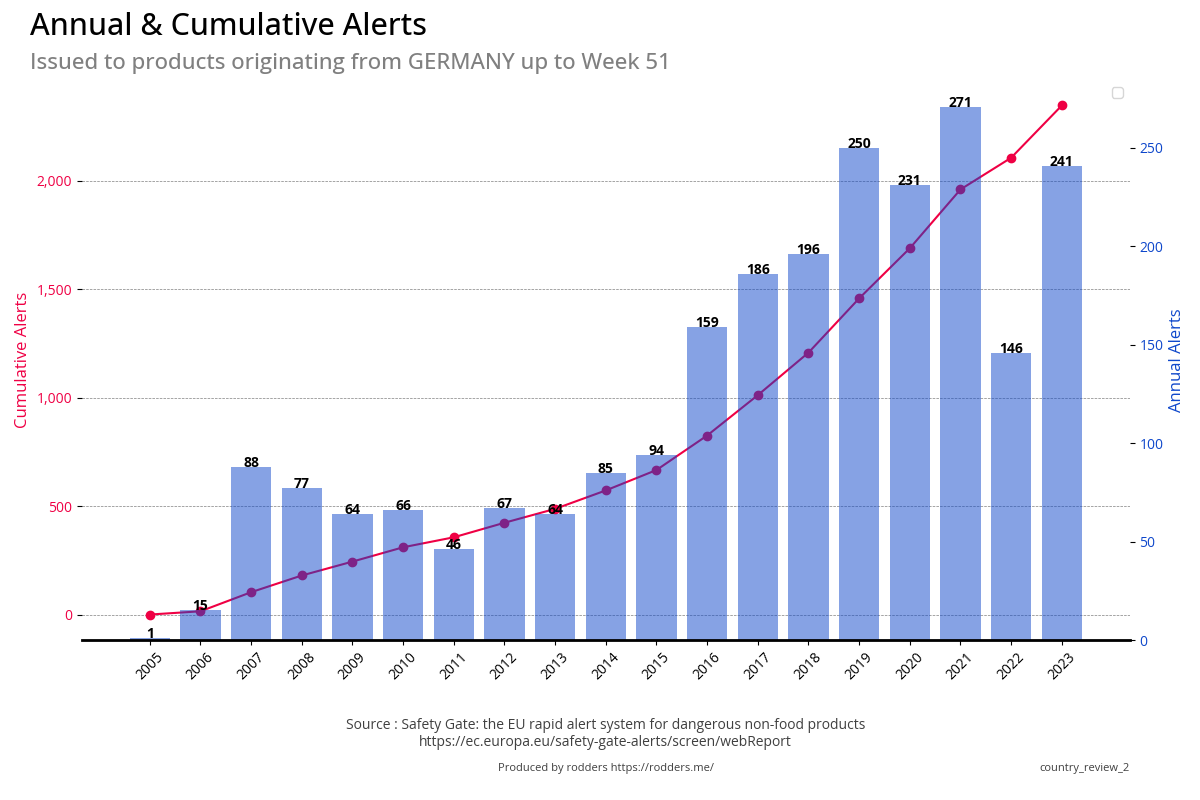
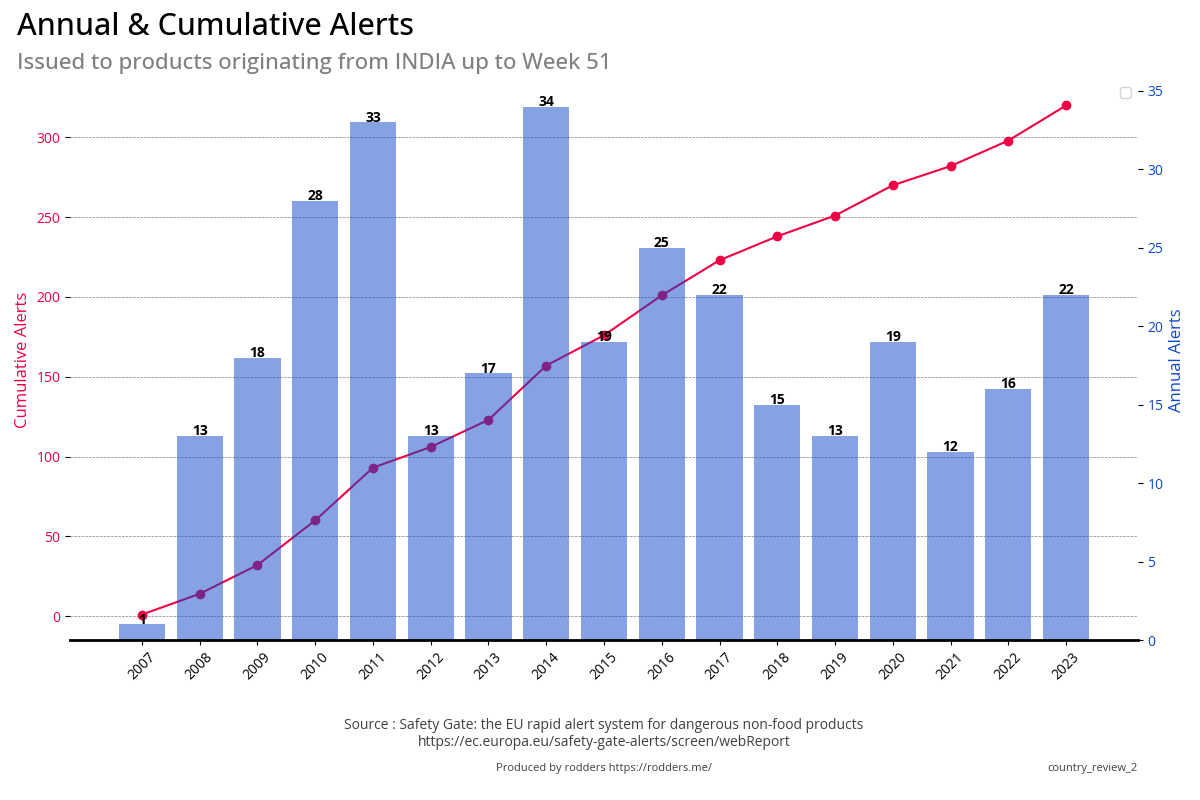
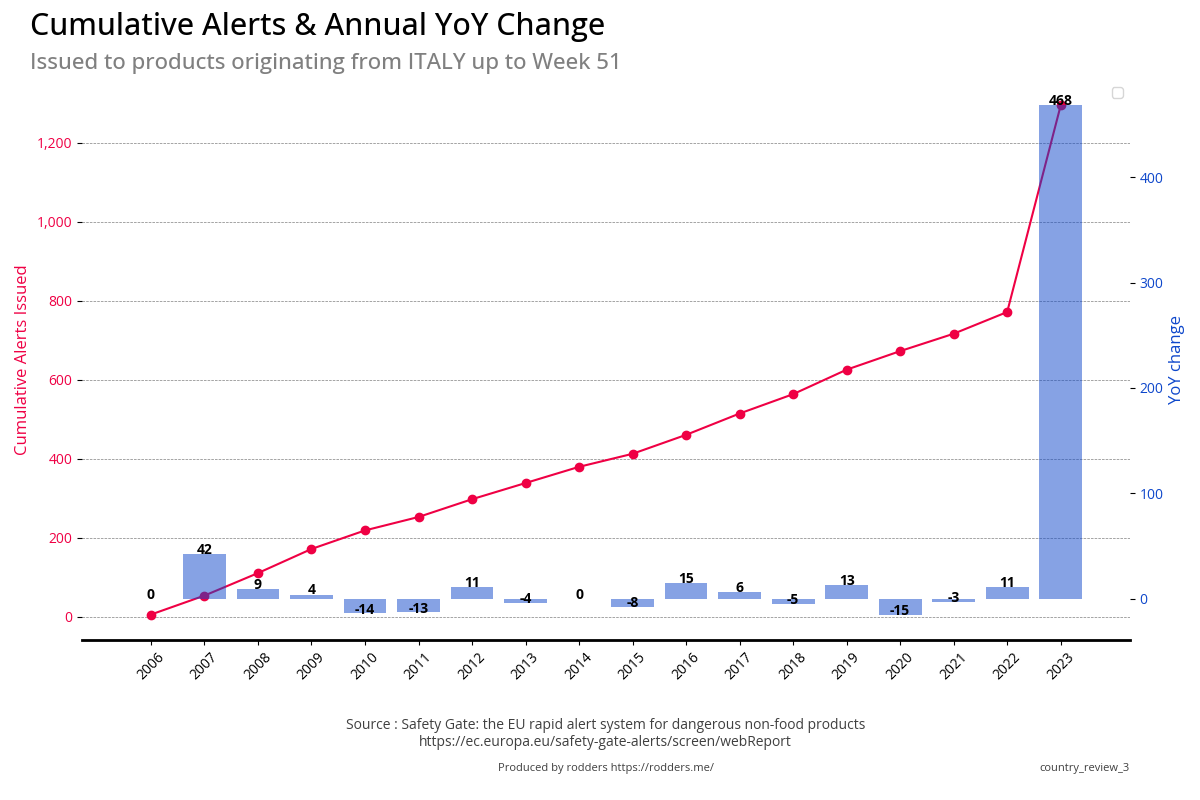
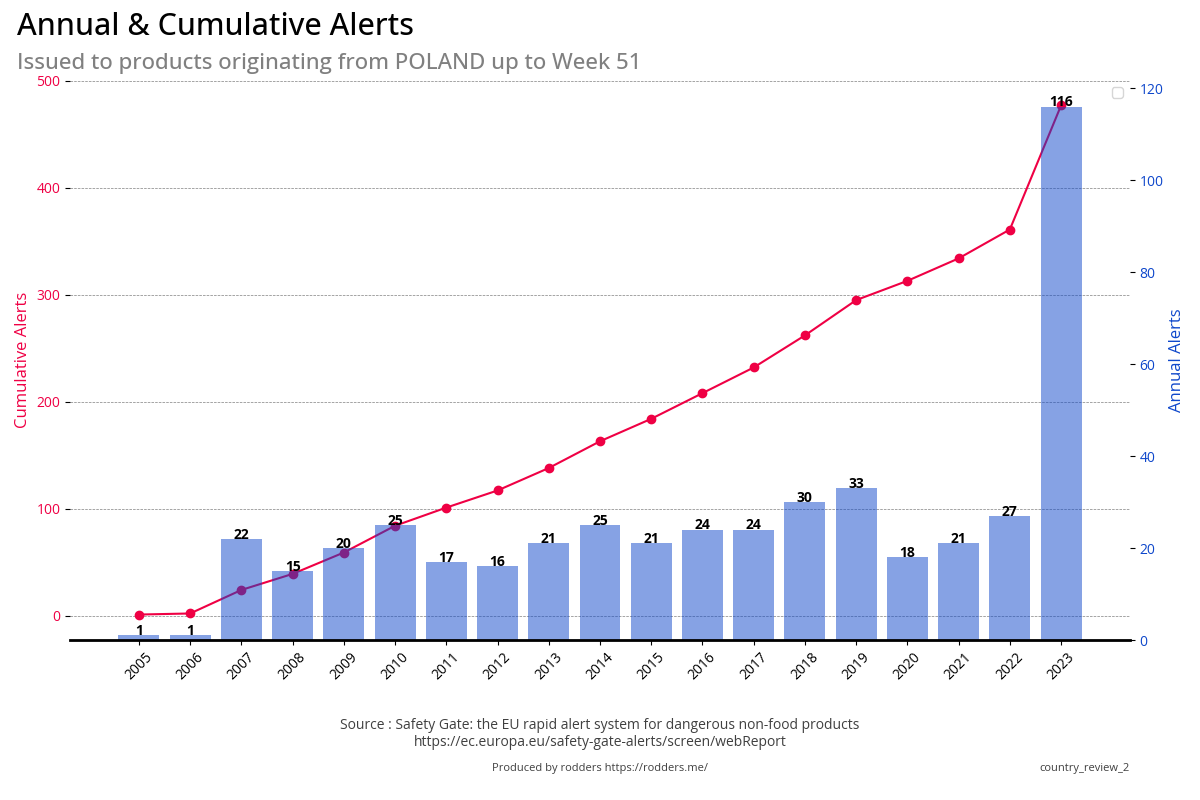
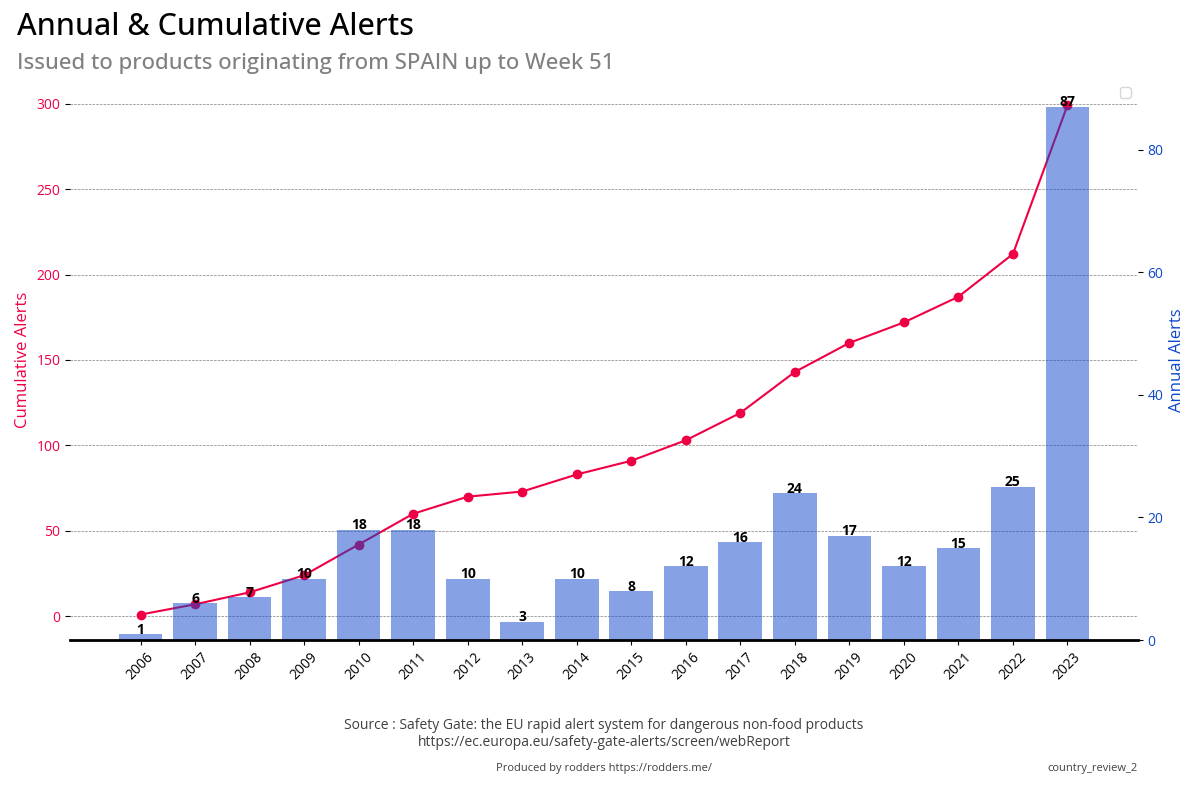
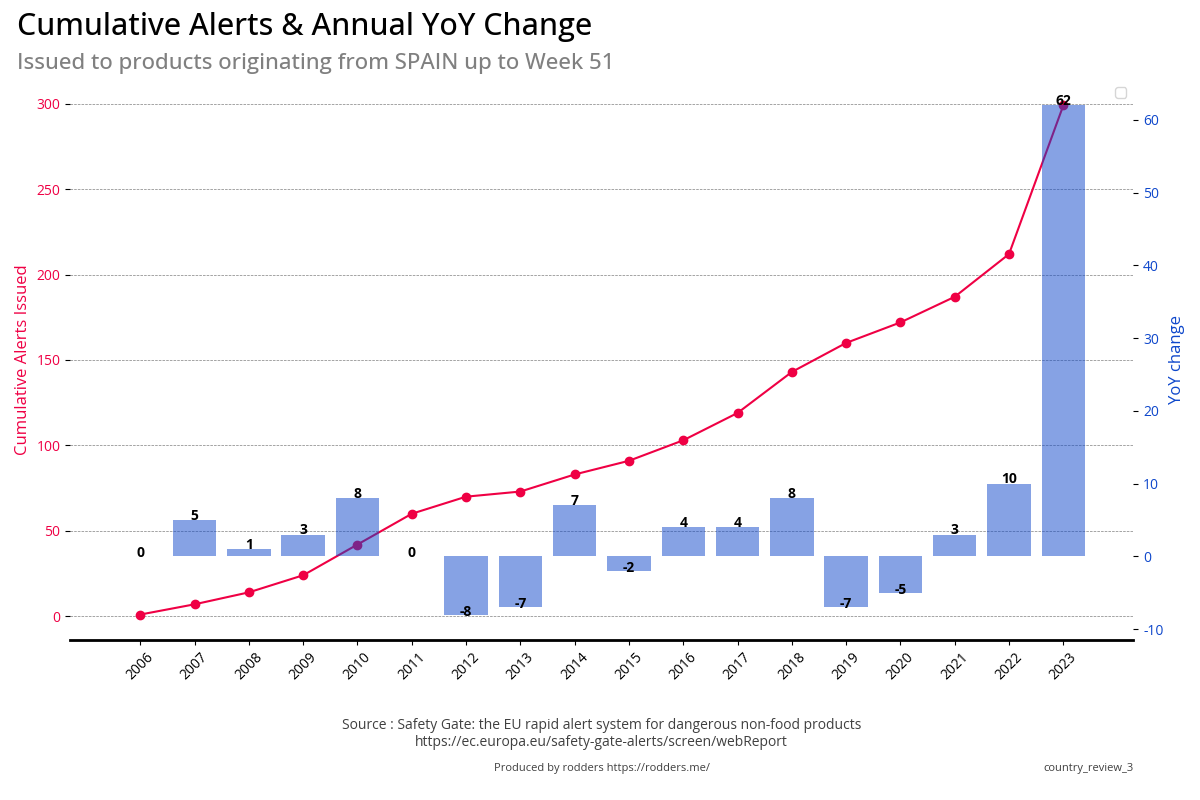
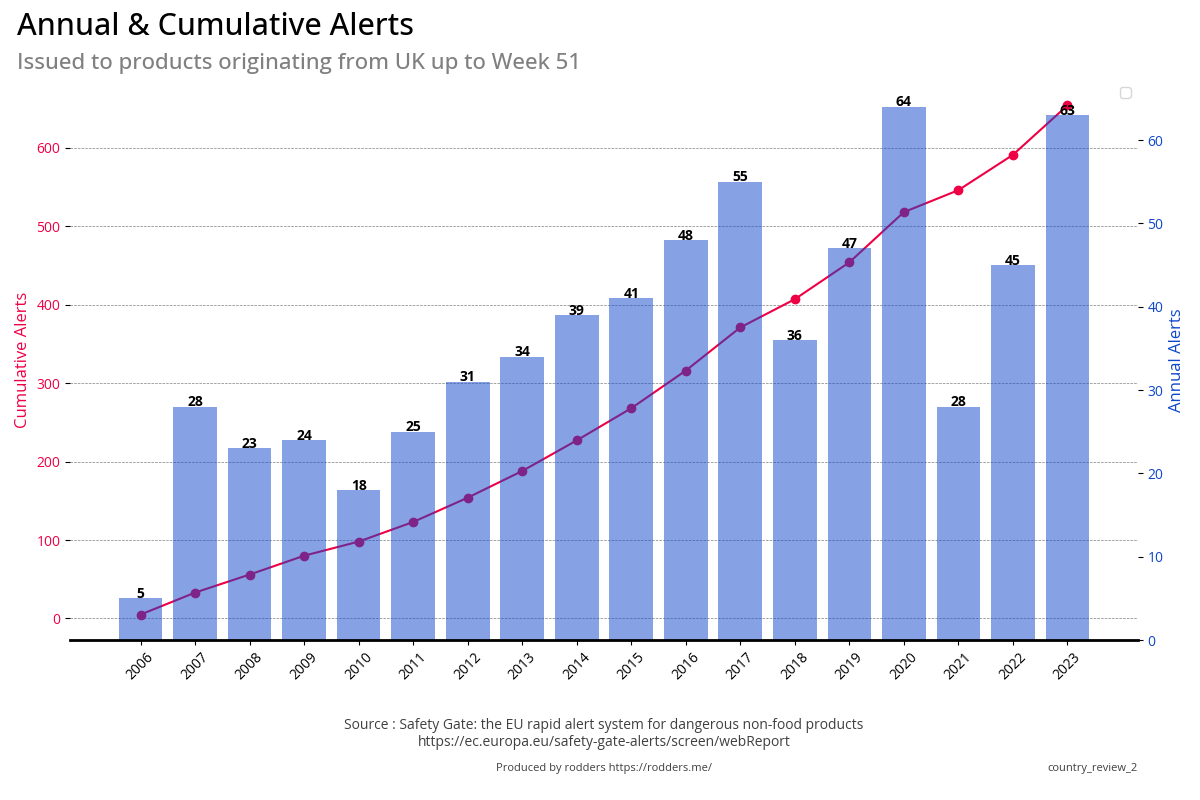
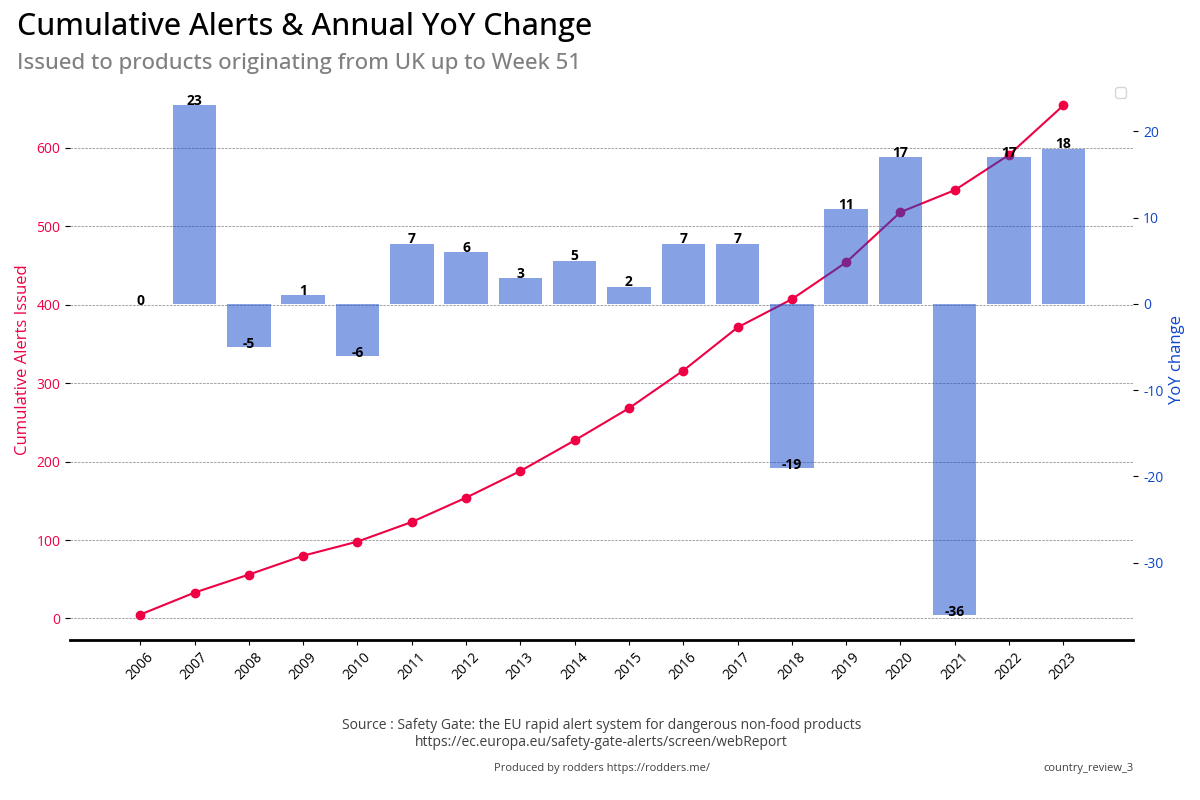
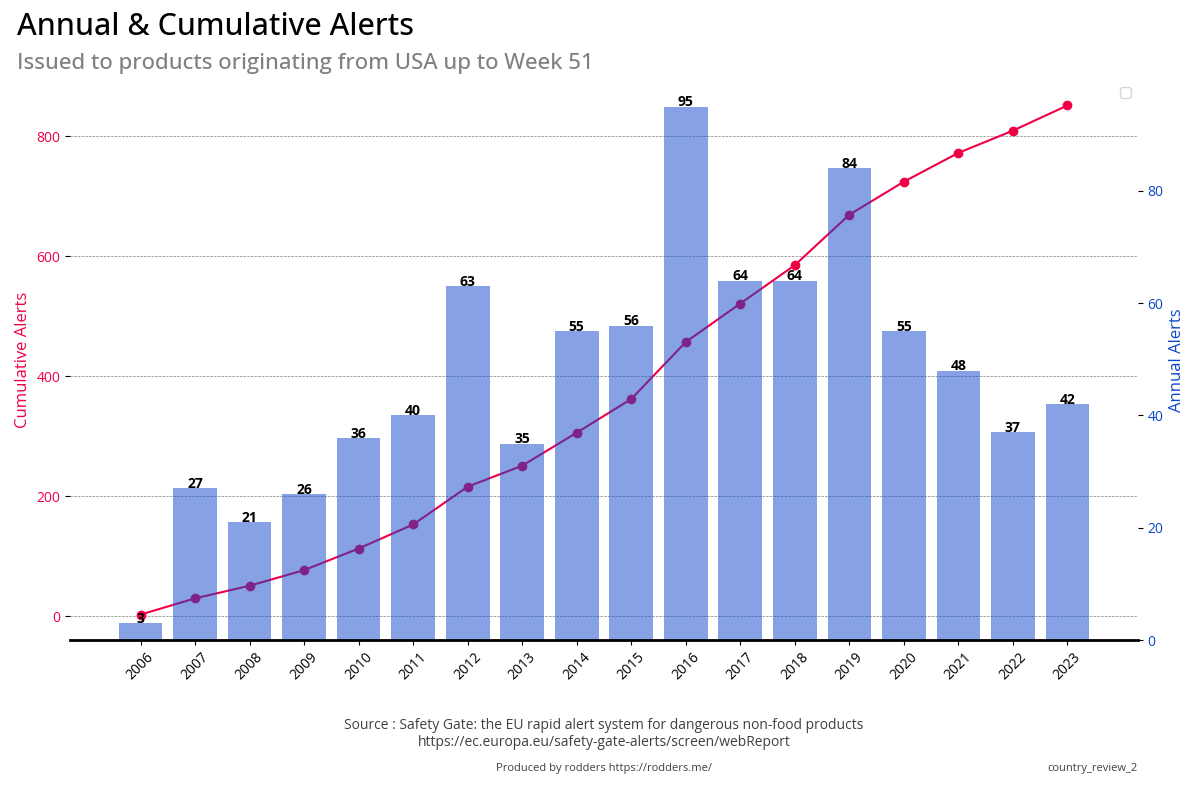
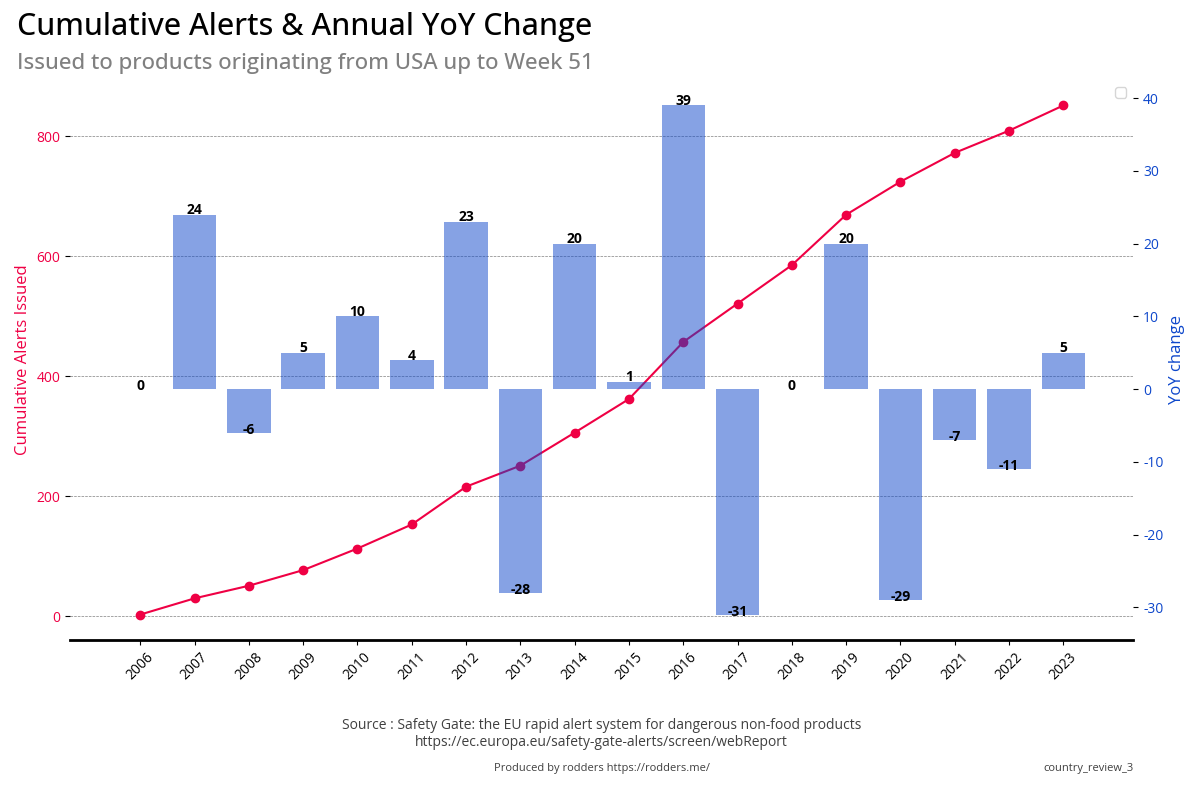
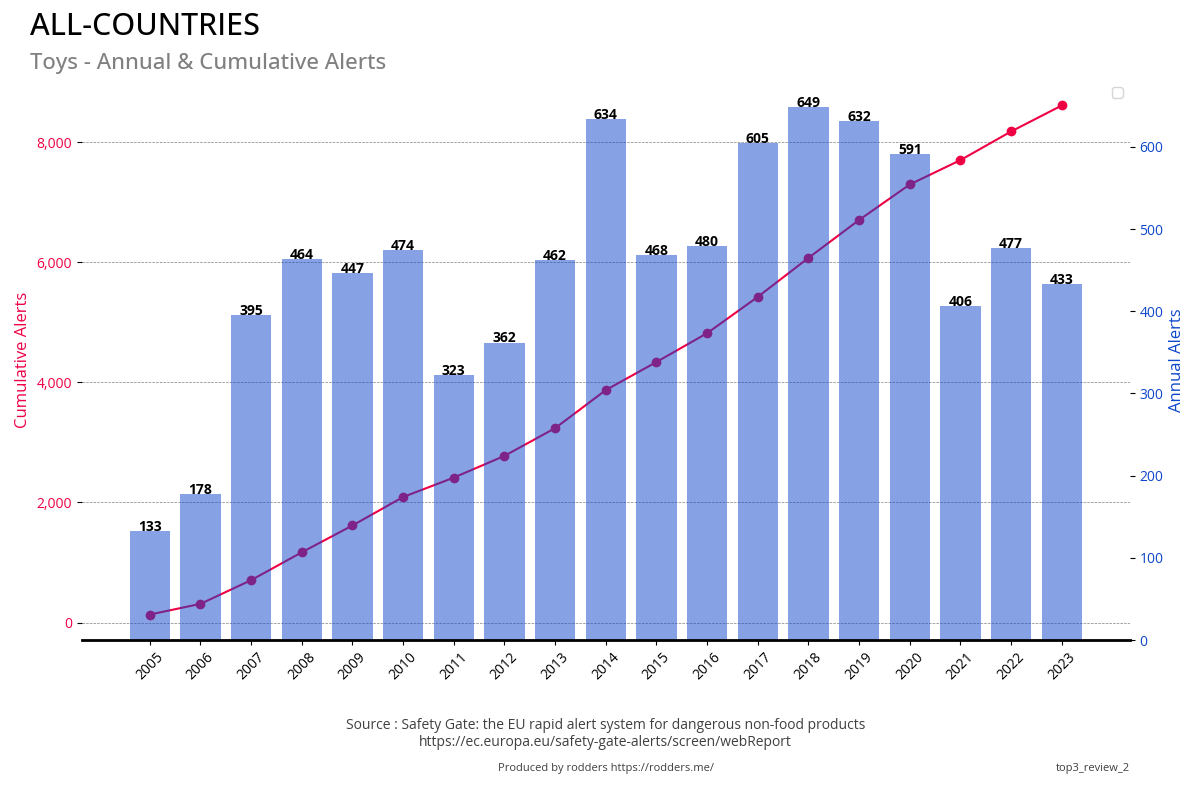
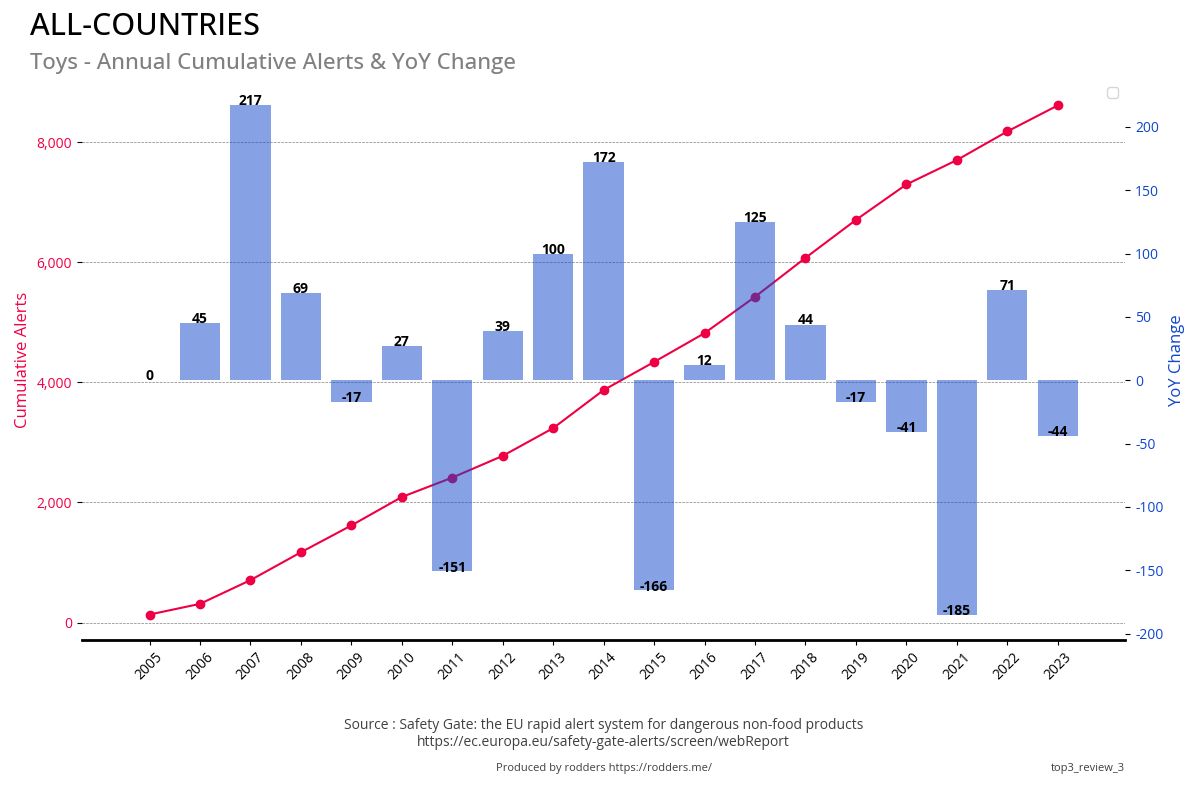
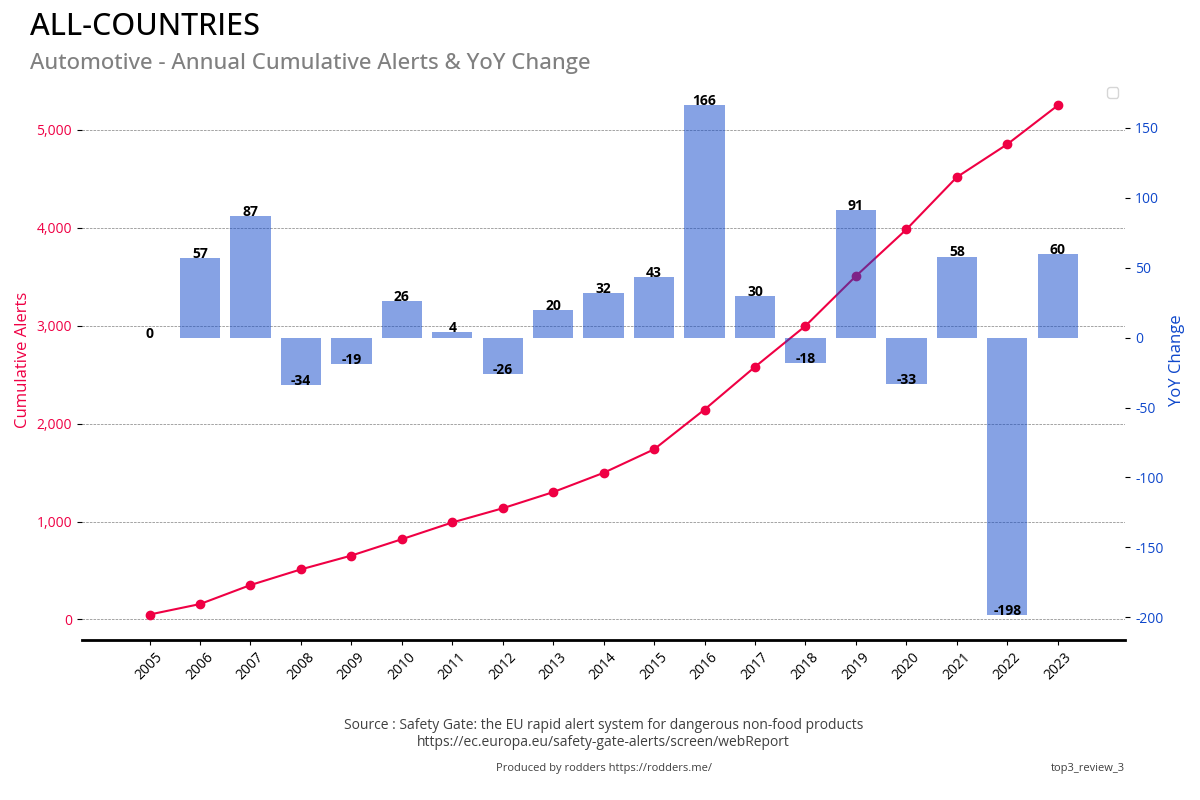
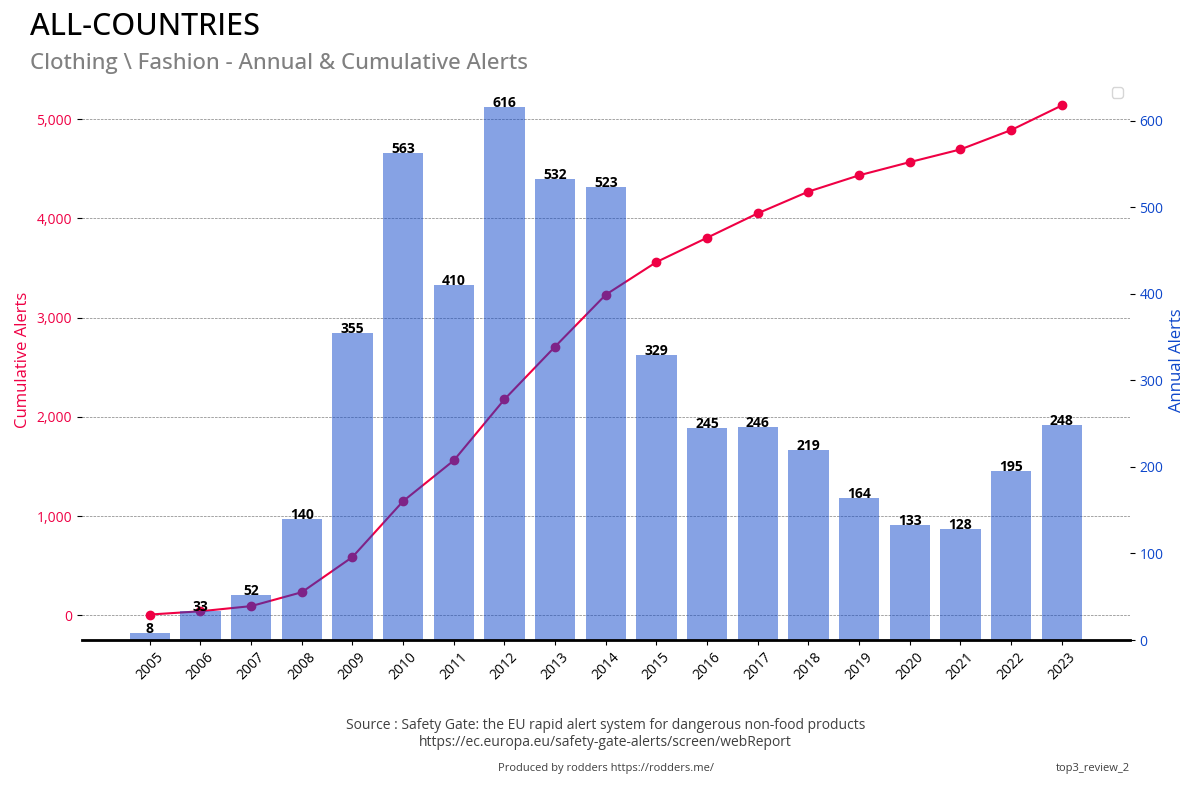
#1 - Total, Annual and Cumulative Alerts
Annual Alerts
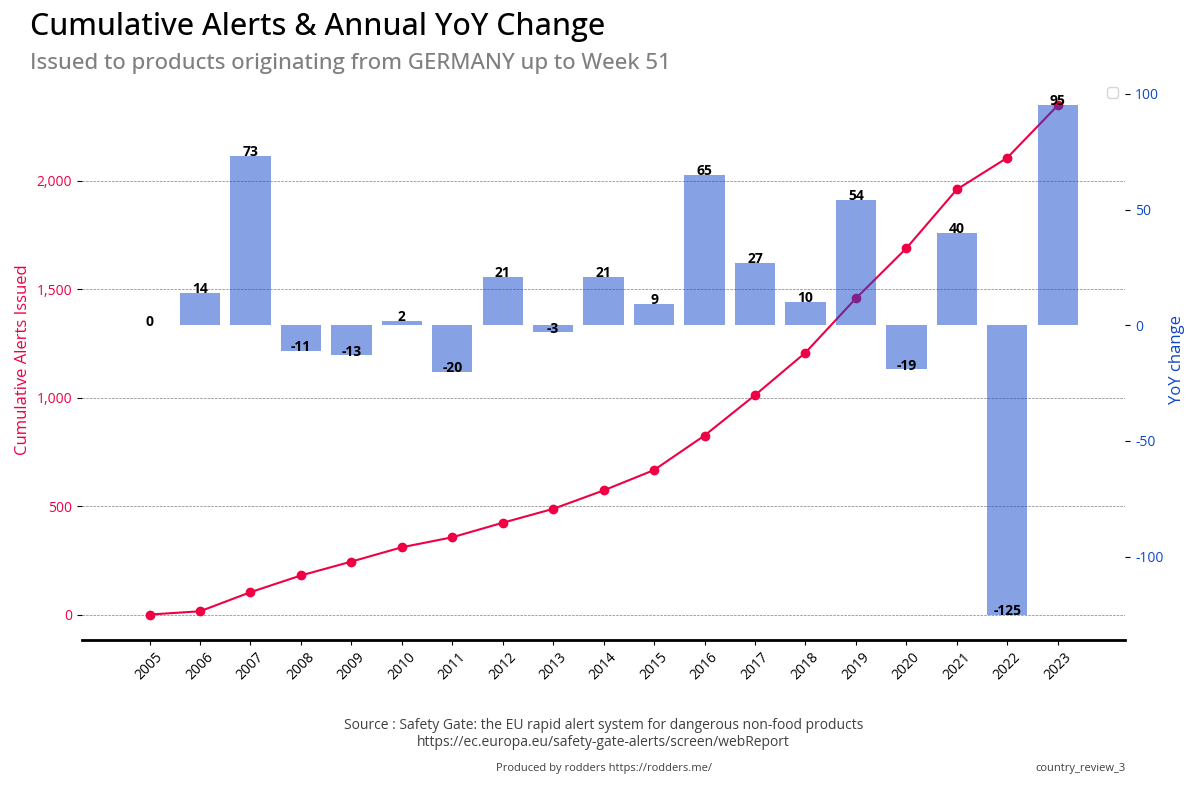
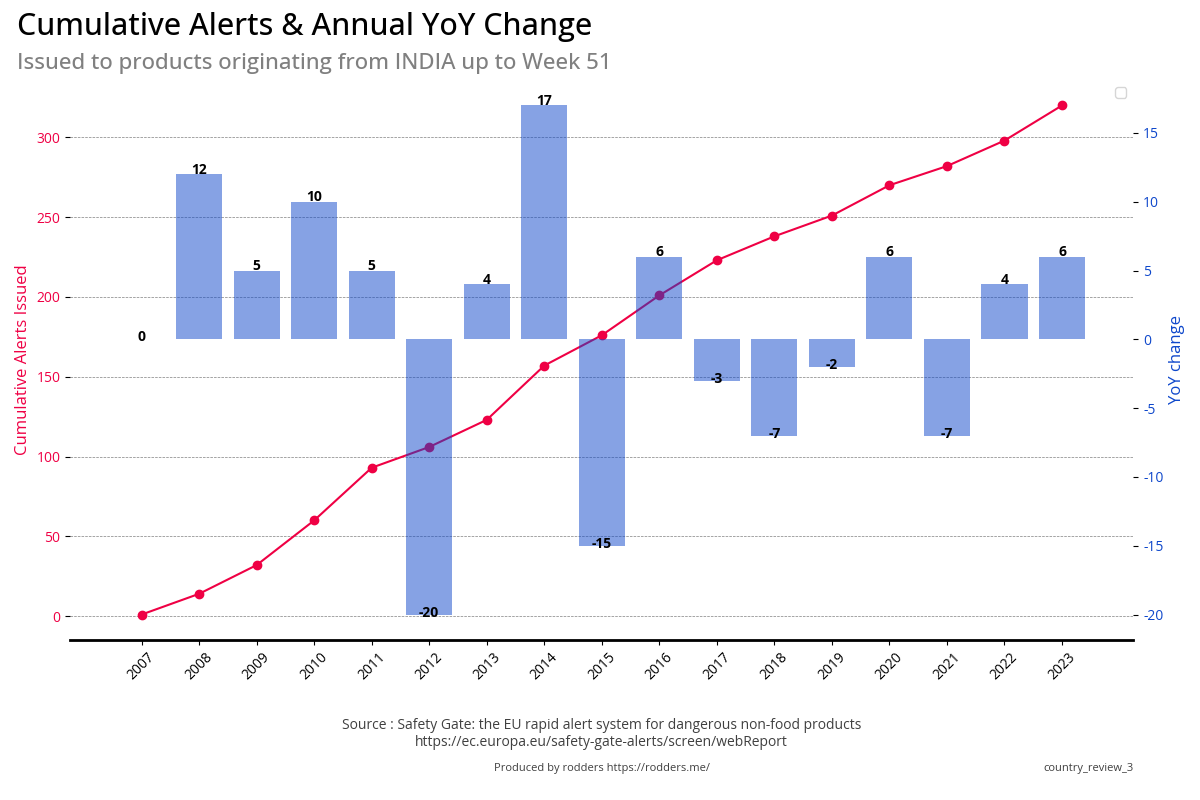
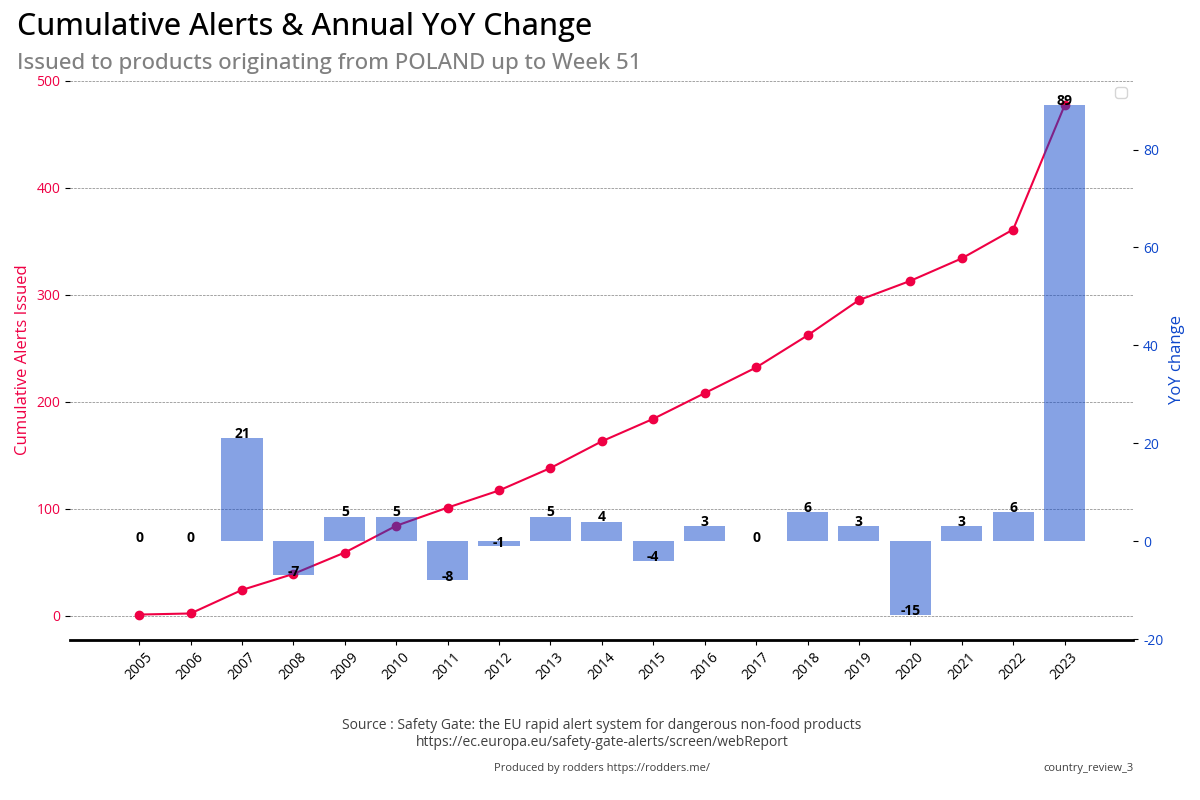
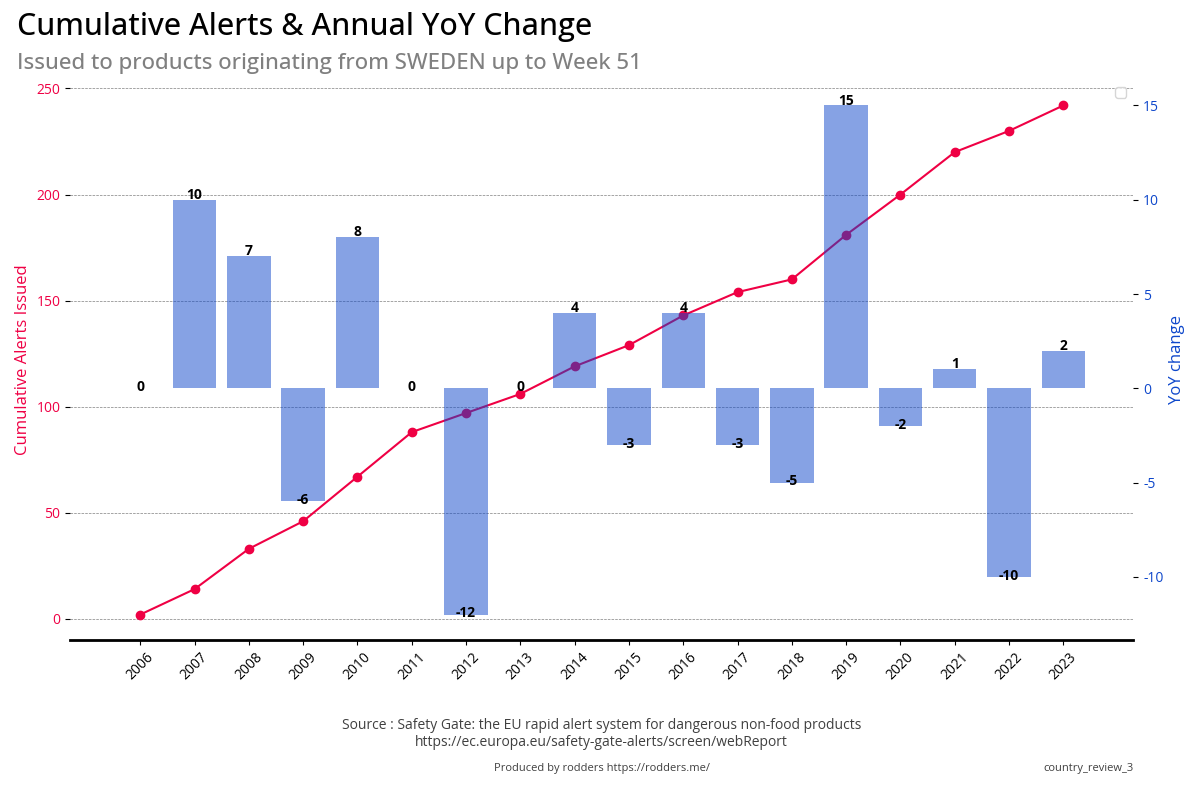
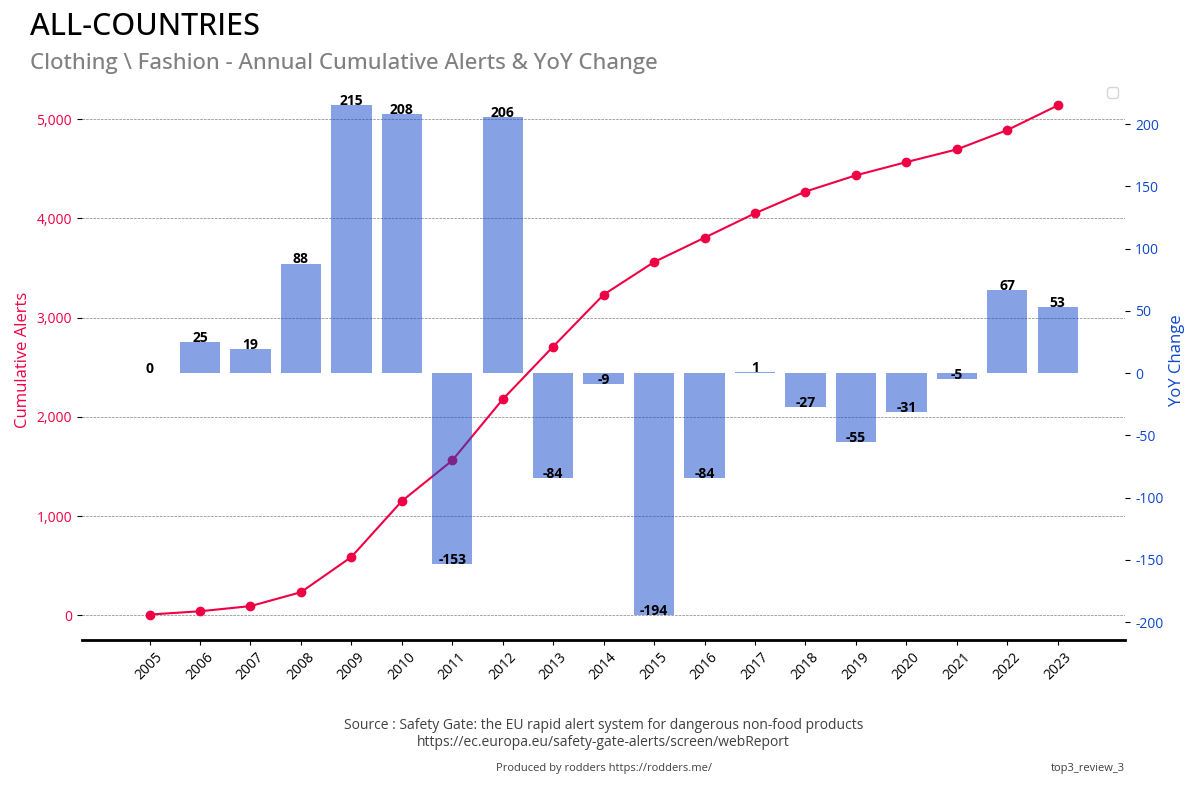
Cumulative Total and YoY Change
Go to Top
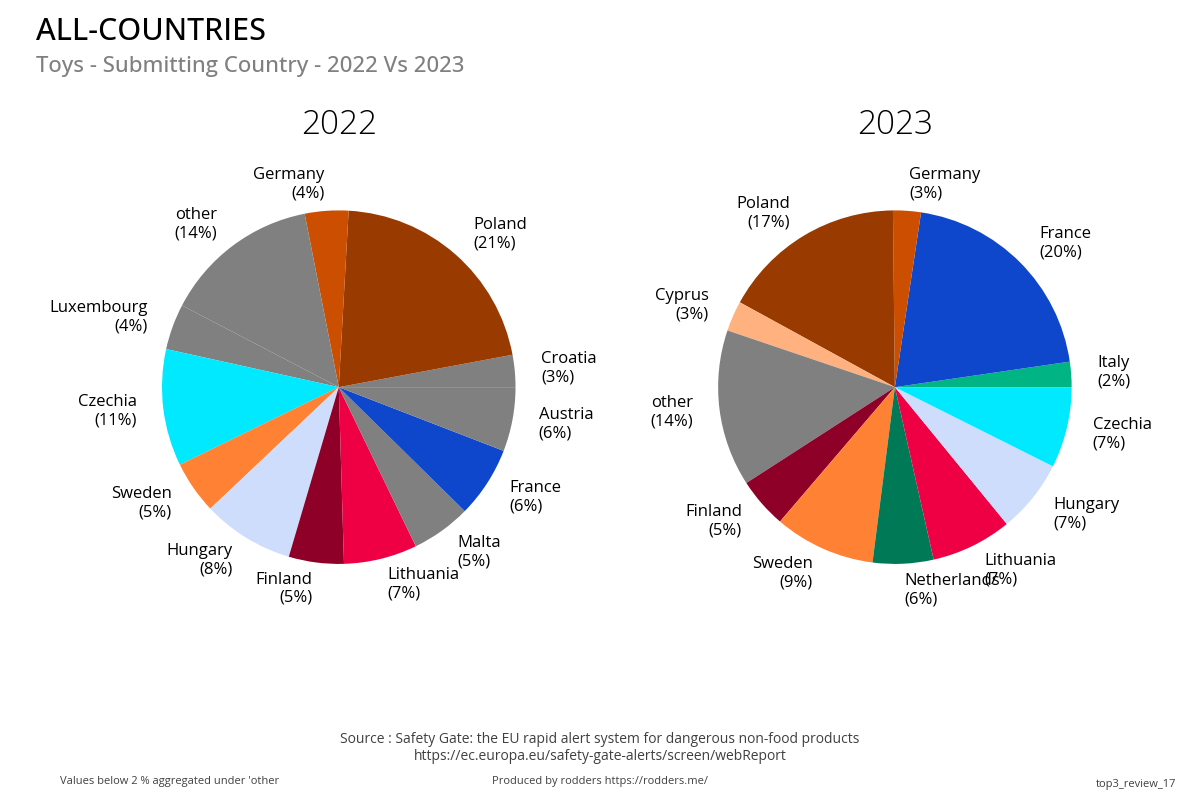
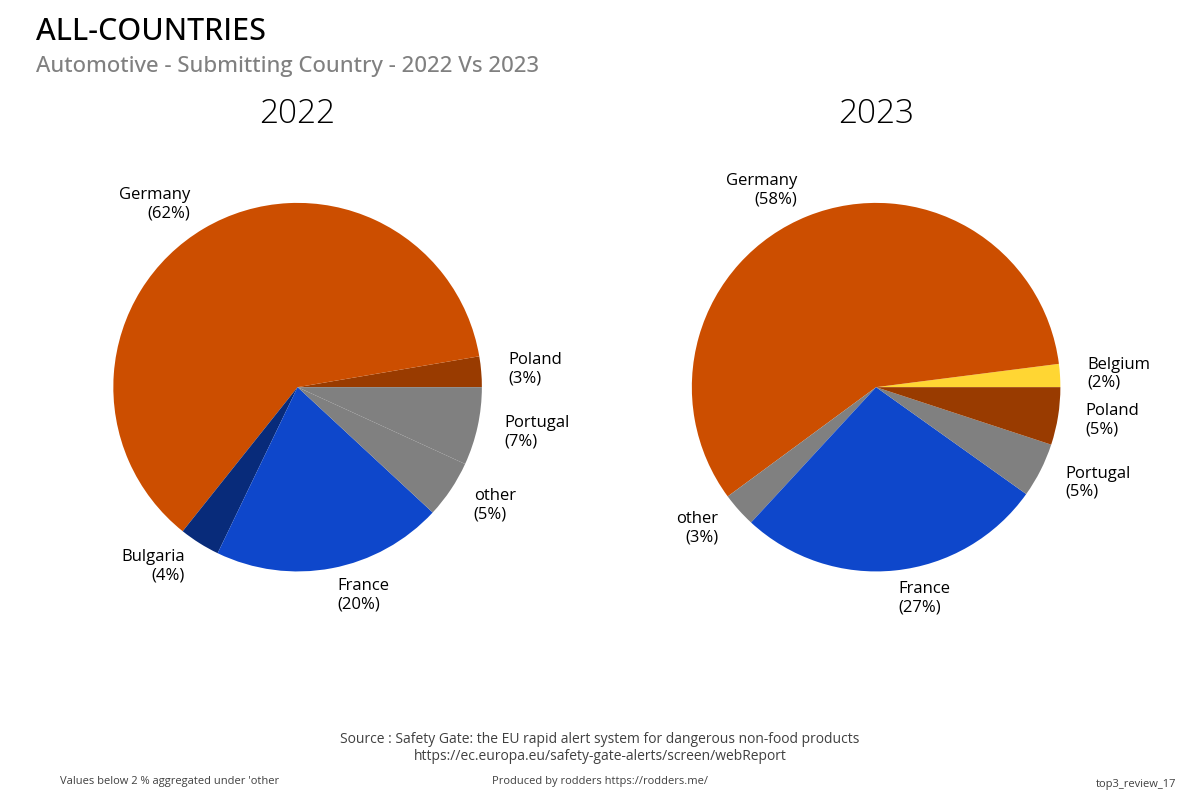
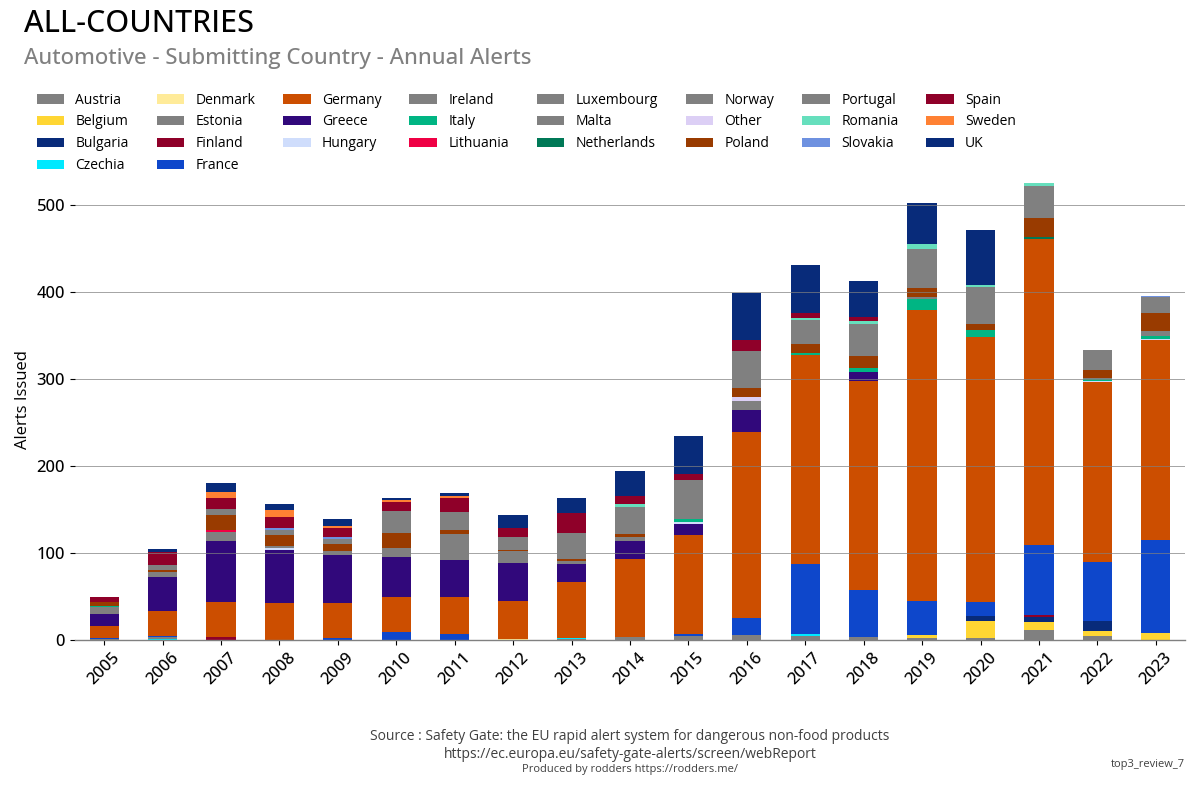
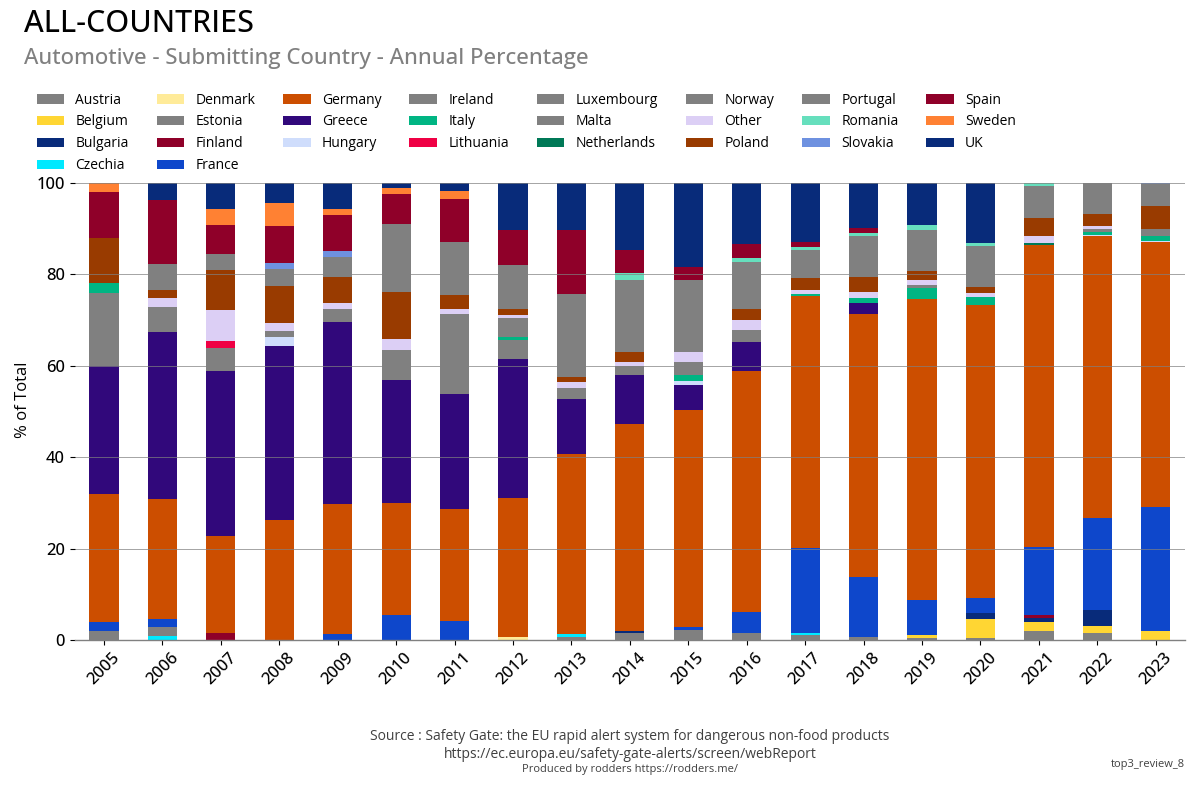
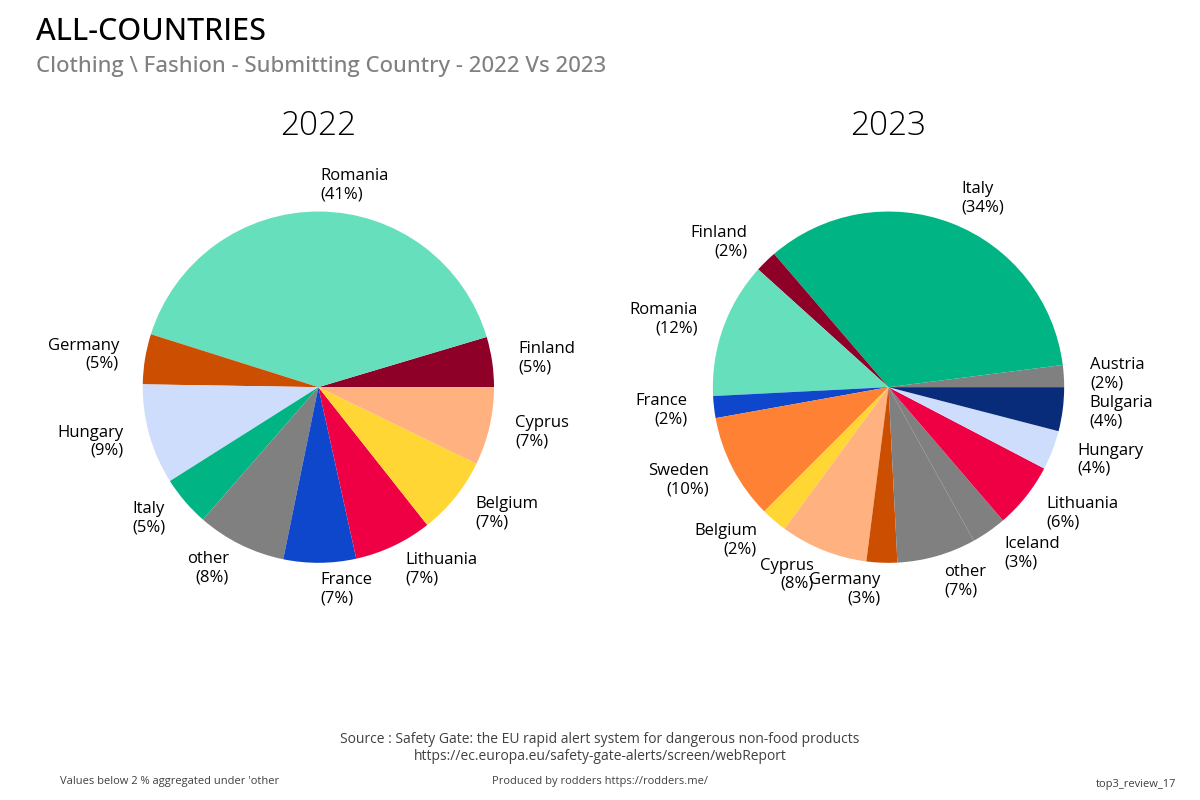
#1 - Submitting Country
Previous Year Vs Current Year
Annual Total and Annual Percentage of Total
#1 - Risk Category
Previous Year Vs Current Year
Annual Total and Annual Percentage of Total
#1 - Counterfeit
Previous Year Vs Current Year
Annual Total and Annual Percentage of Total
#1 - Compulsory / Voluntary Action Required /Responsible Party
#1 - Compulsory / Voluntary Action Required
Previous Year Vs Current Year
Annual Total / Compulsory Vs Voluntary
Annual Total
Compulsory Vs Voluntary
Go to Top
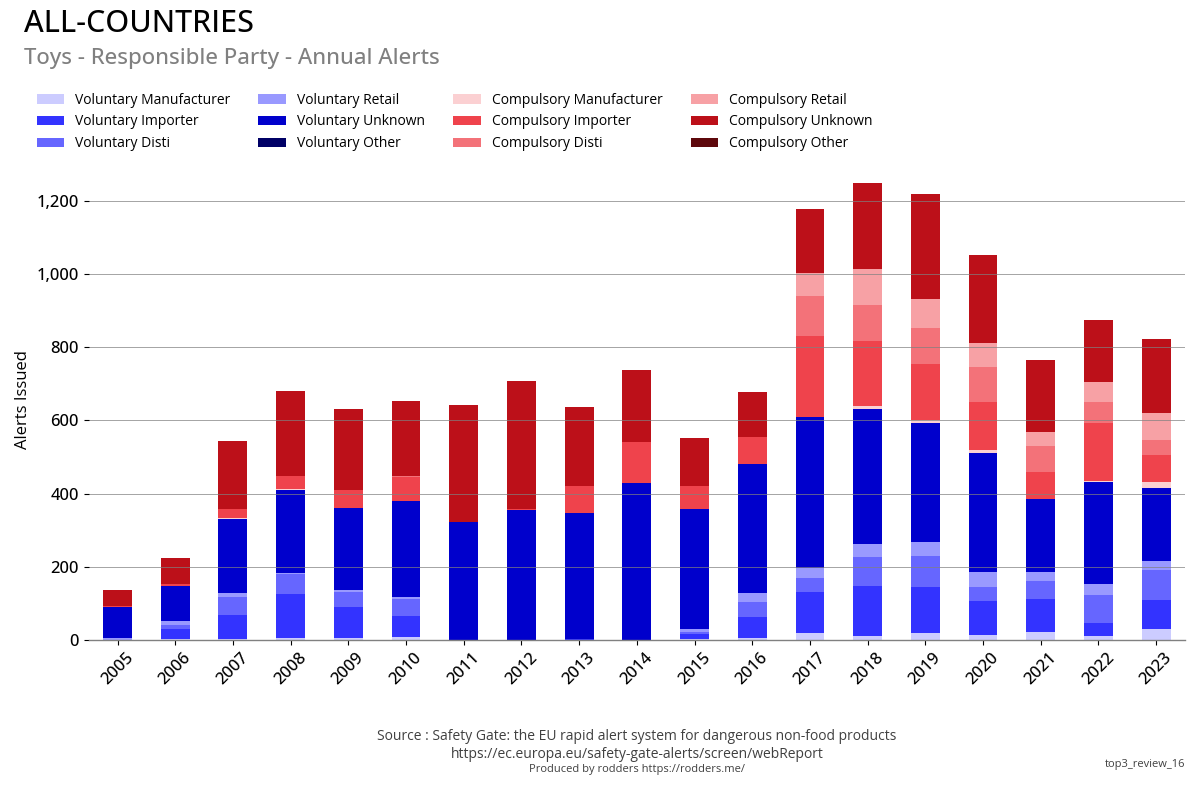
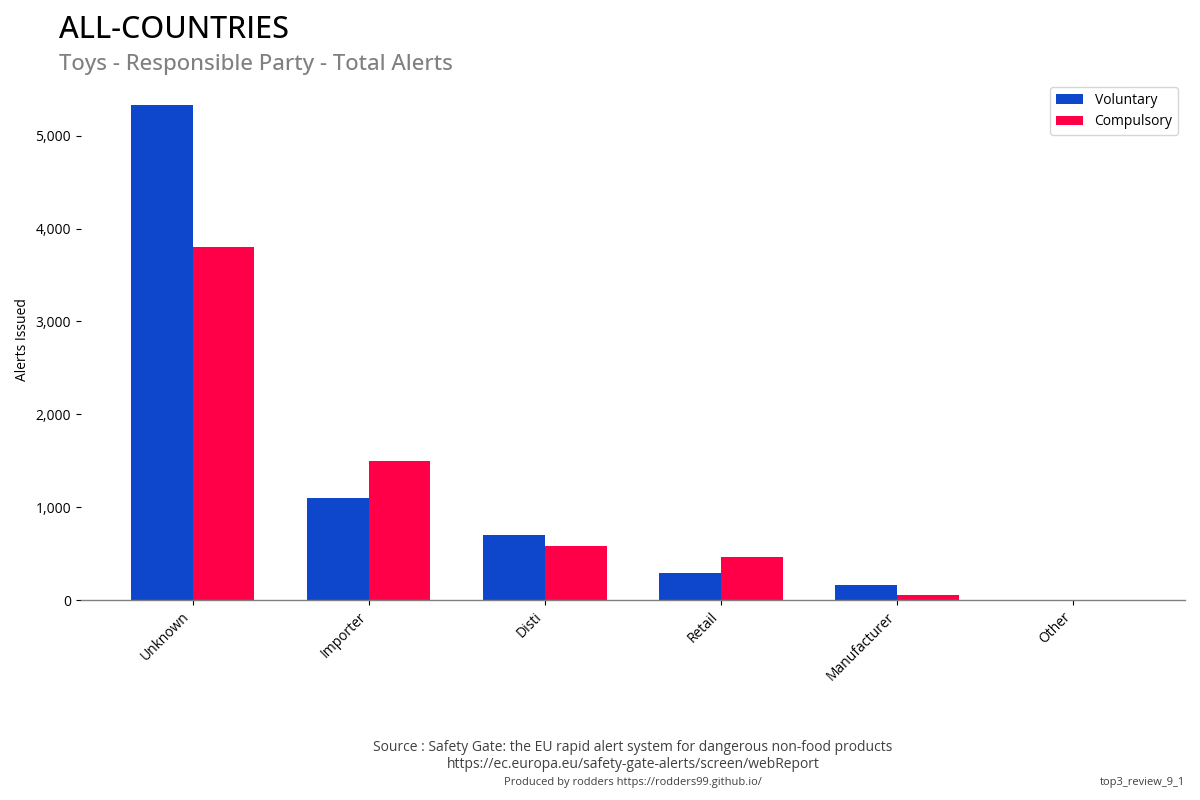
#1 - Compulsory / Voluntary Responsible Party
Previous Year Vs Current Year
Annual Total / Compulsory Vs Voluntary
Annual Total
Compulsory Vs Voluntary
Go to Top
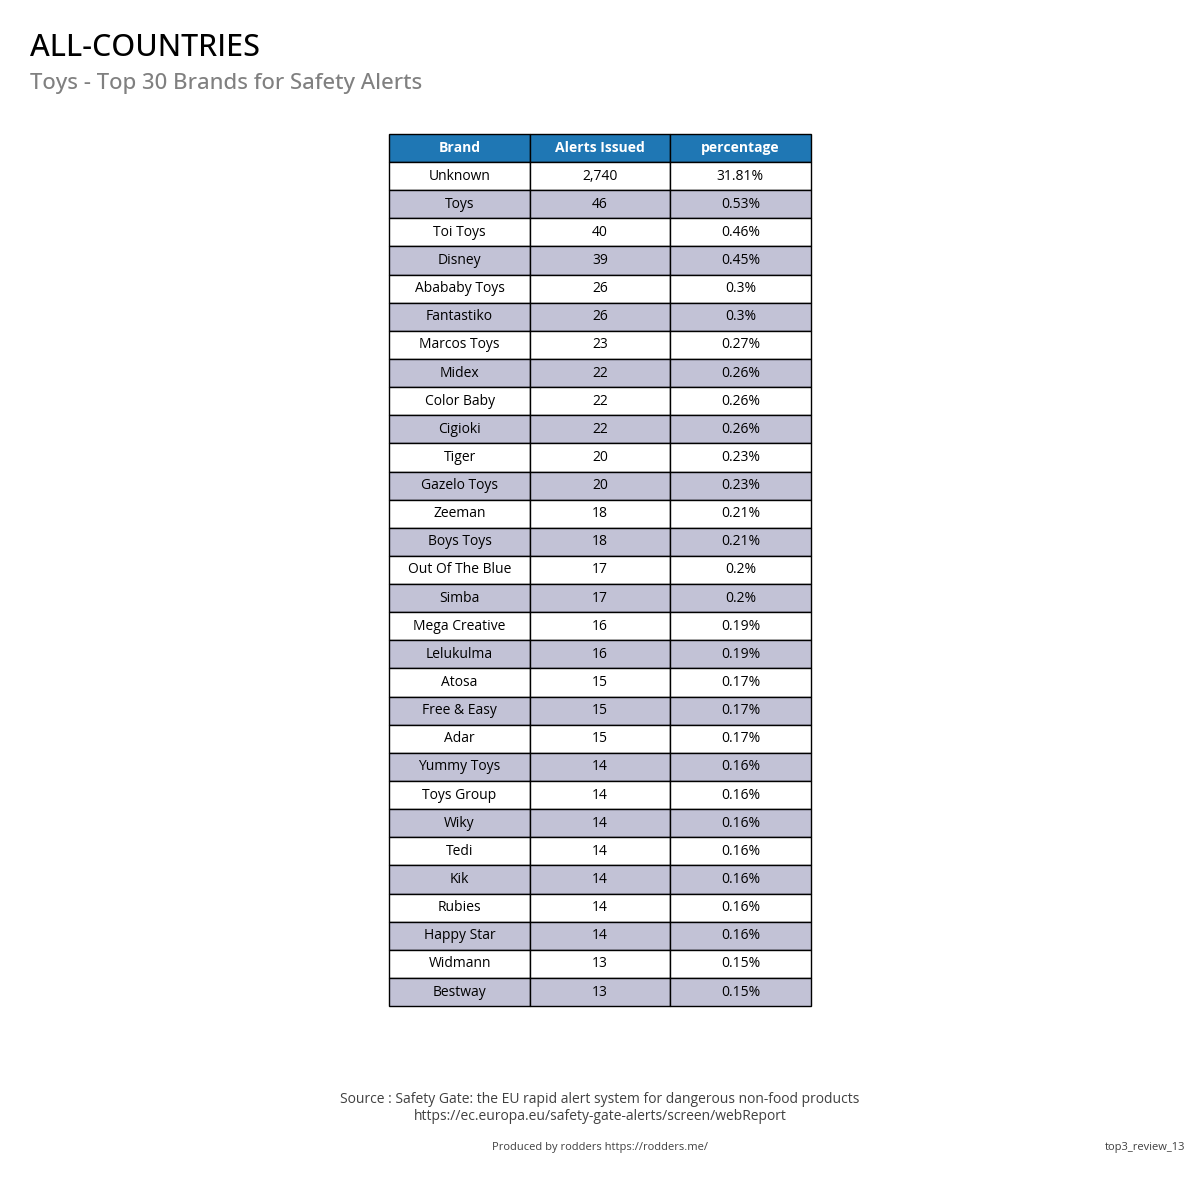
#1 - Top 30 Brands for Safety Alerts
#2 - Top 3 Product Categories
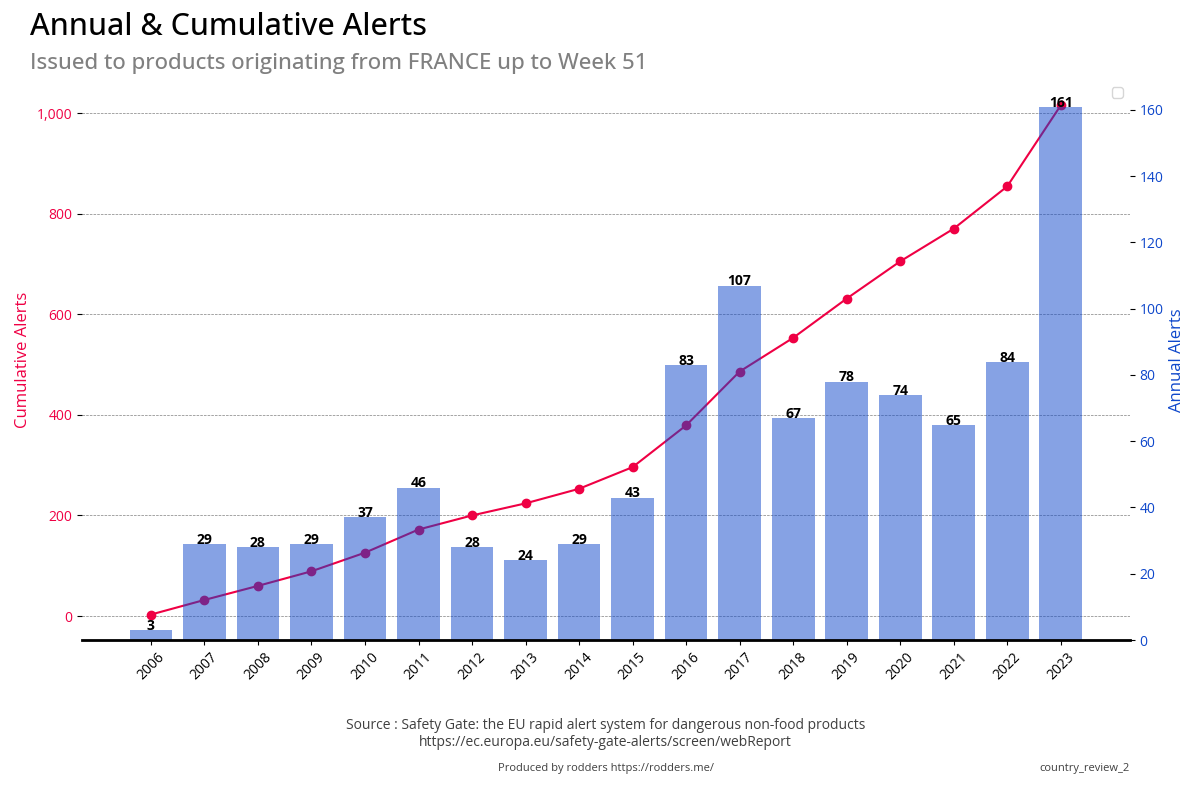
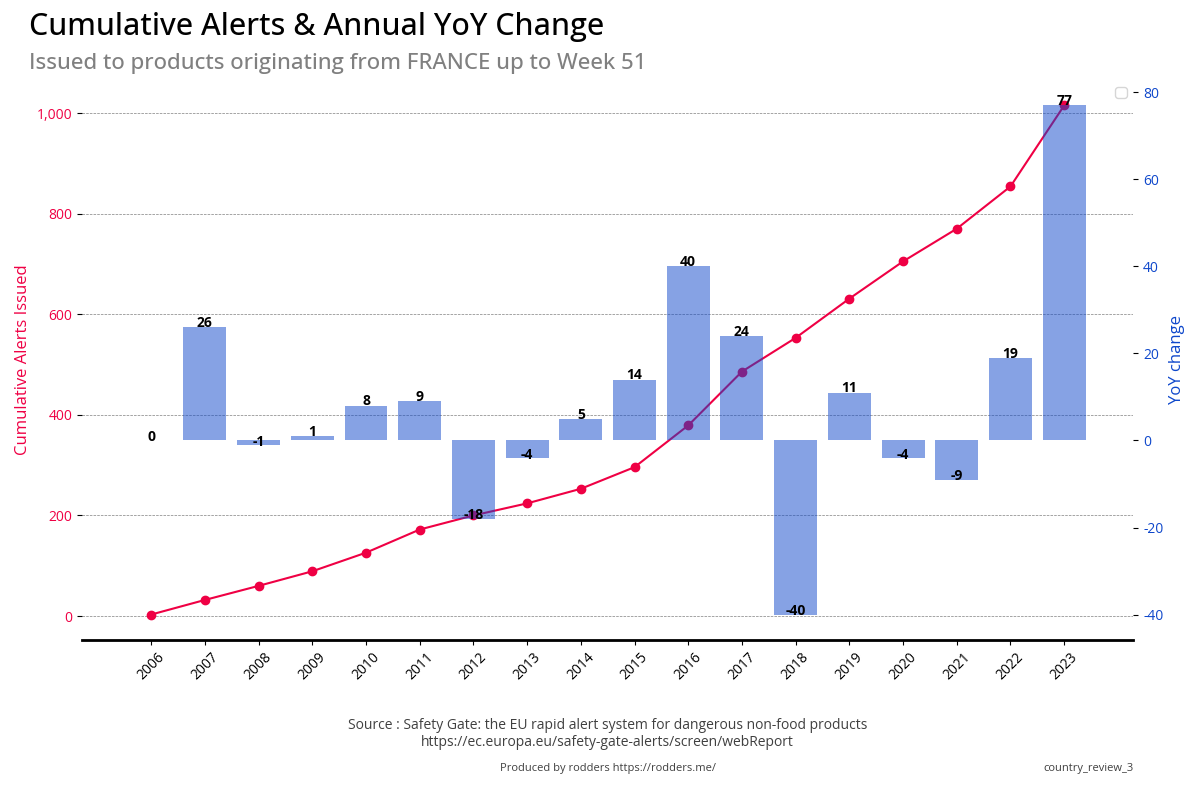
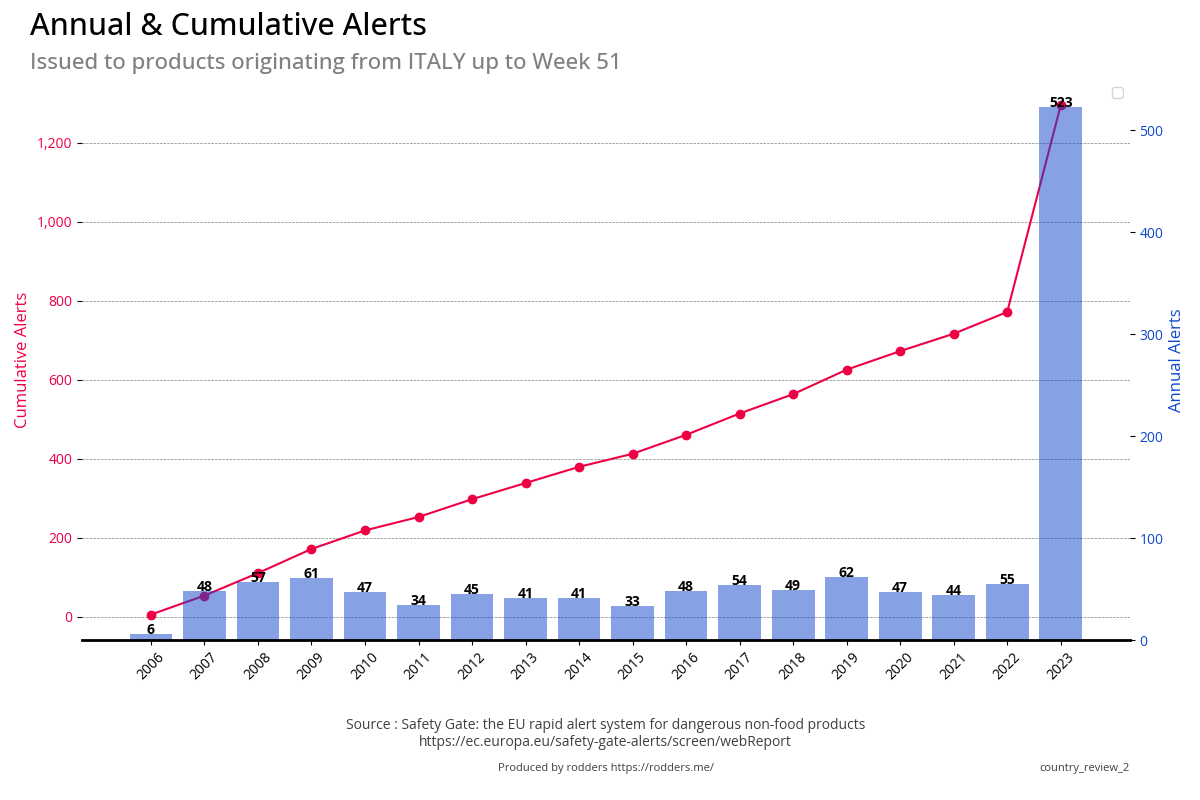
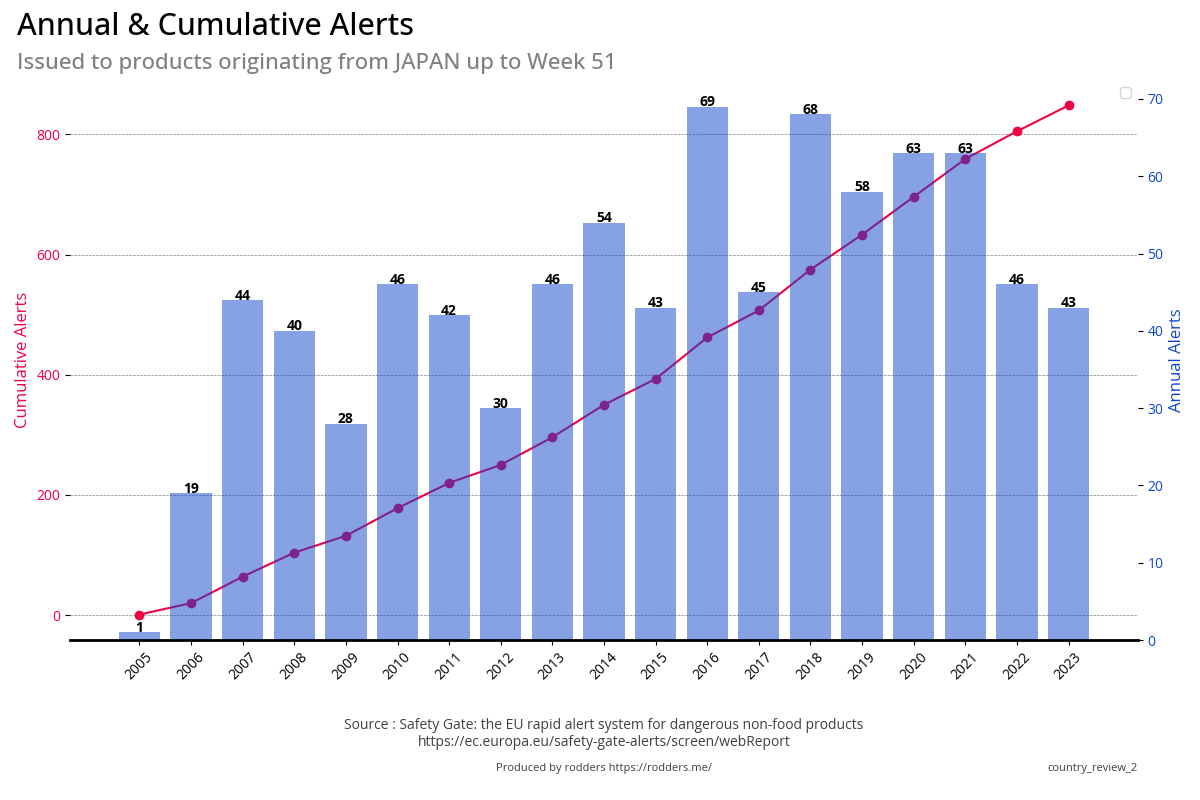
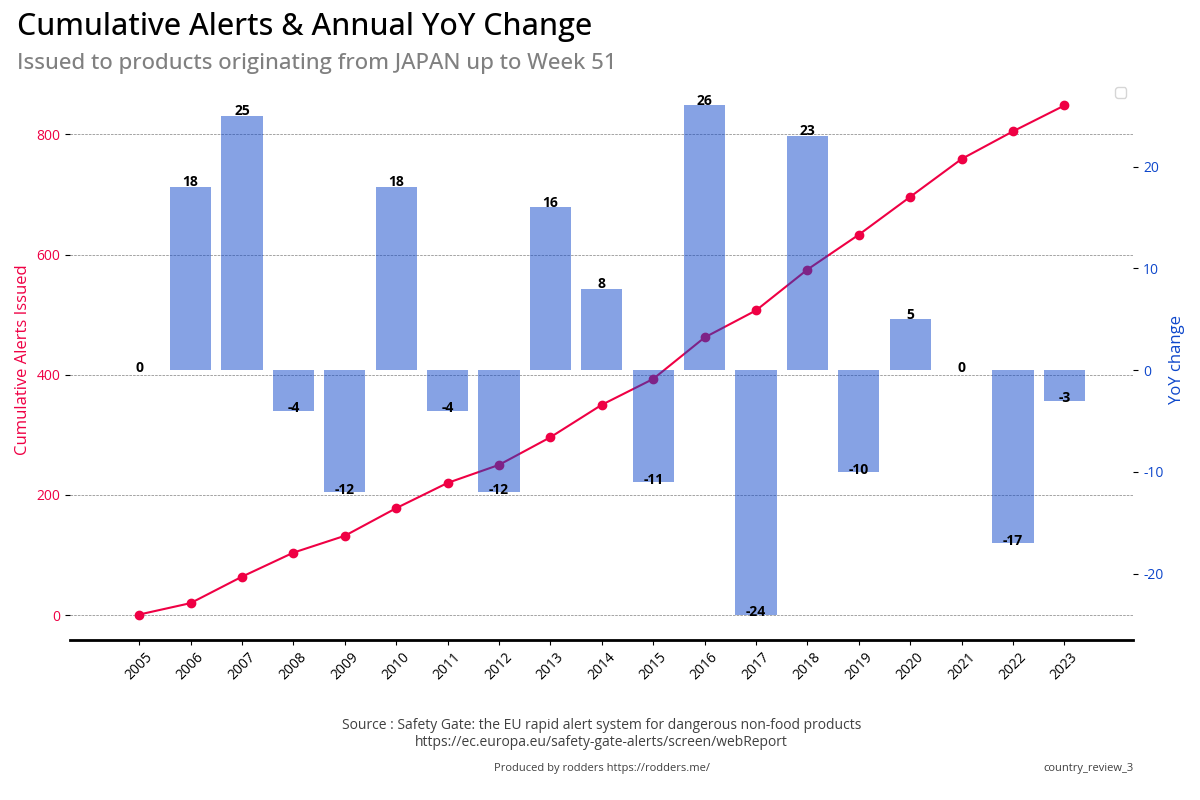
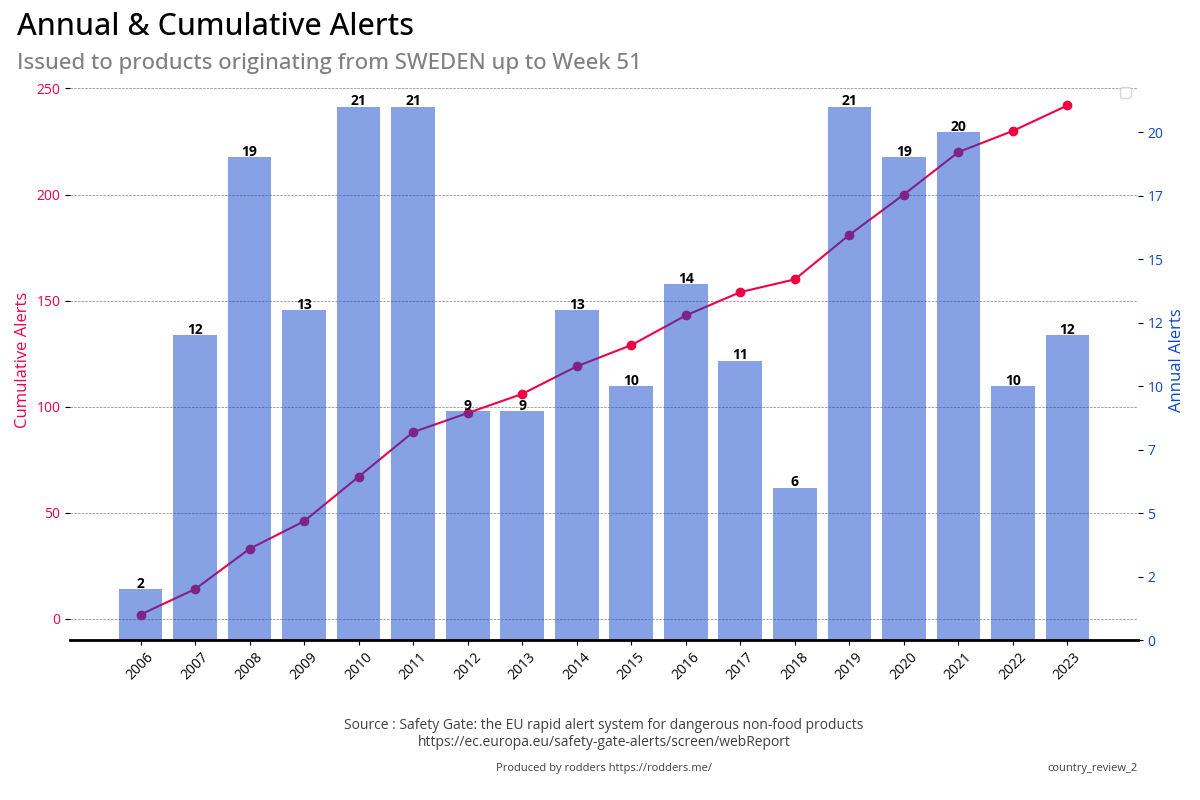
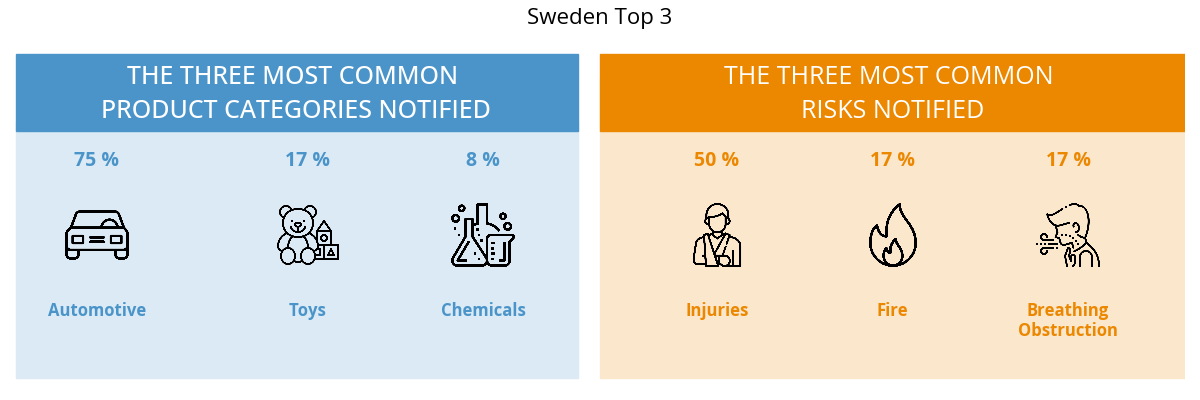
#2 - Total, Annual and Cumulative Alerts
Annual Alerts
Cumulative Total and YoY Change
Go to Top
Previous Year Vs Current Year
#2 - Submitting Country
Annual Total
Cumulative Total and YoY Change
Go to Top
#2 - Risk Category
Previous Year Vs Current Year
Annual Total / Annual Percentage of Total
Annual Total
Cumulative Total and YoY Change
Go to Top
#2 - Counterfeit
Previous Year Vs Current Year
Annual Total and Annual Percentage of Total
Annual Total
Cumulative Total and YoY Change
Go to Top
#2 - Compulsory / Voluntary Action Required
Previous Year Vs Current Year
Annual Total / Compulsory Vs Voluntary Total
Annual Total
Compulsory Vs Voluntary Total
Go to Top
#2 - Compulsory / Voluntary Responsible Party
Previous Year Vs Current Year
Annual Total / Compulsory Vs Voluntary Total
Annual Total
Compulsory Vs Voluntary Total
Go to Top
#2 - Top Brands for Safety Alerts
#3 - Top 3 Product Categories
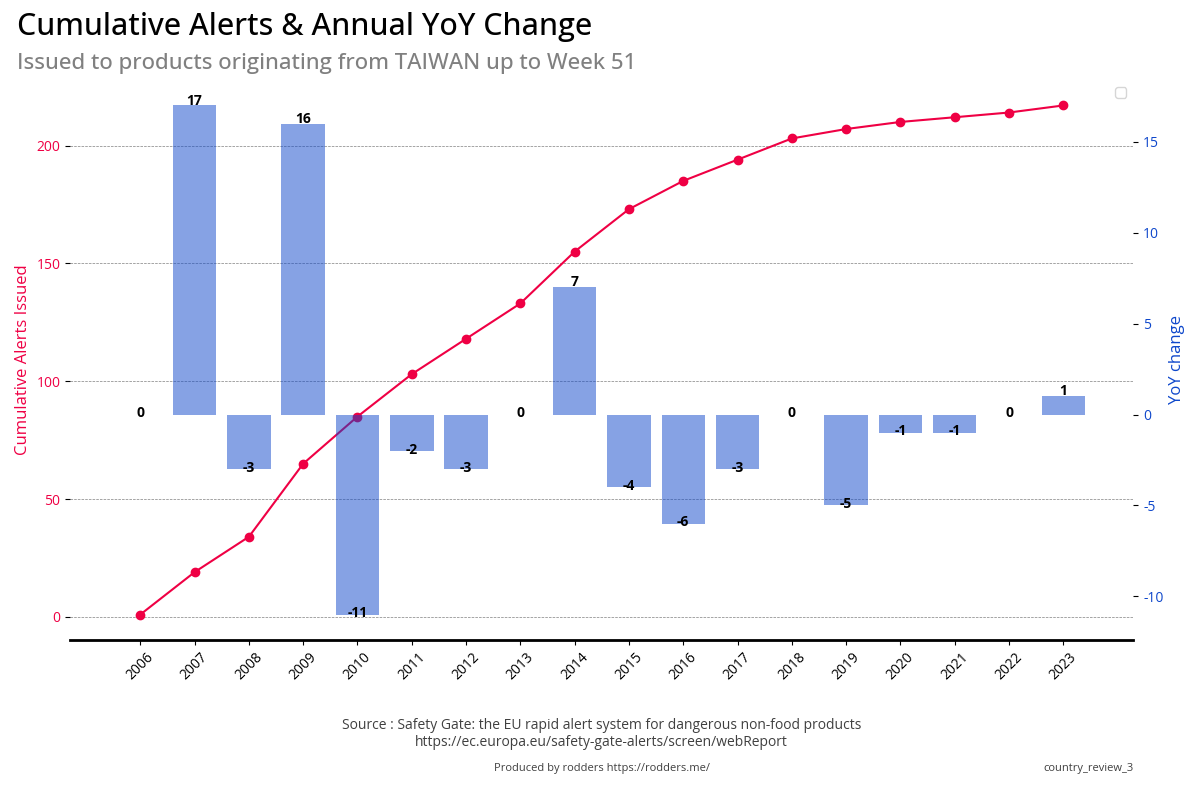
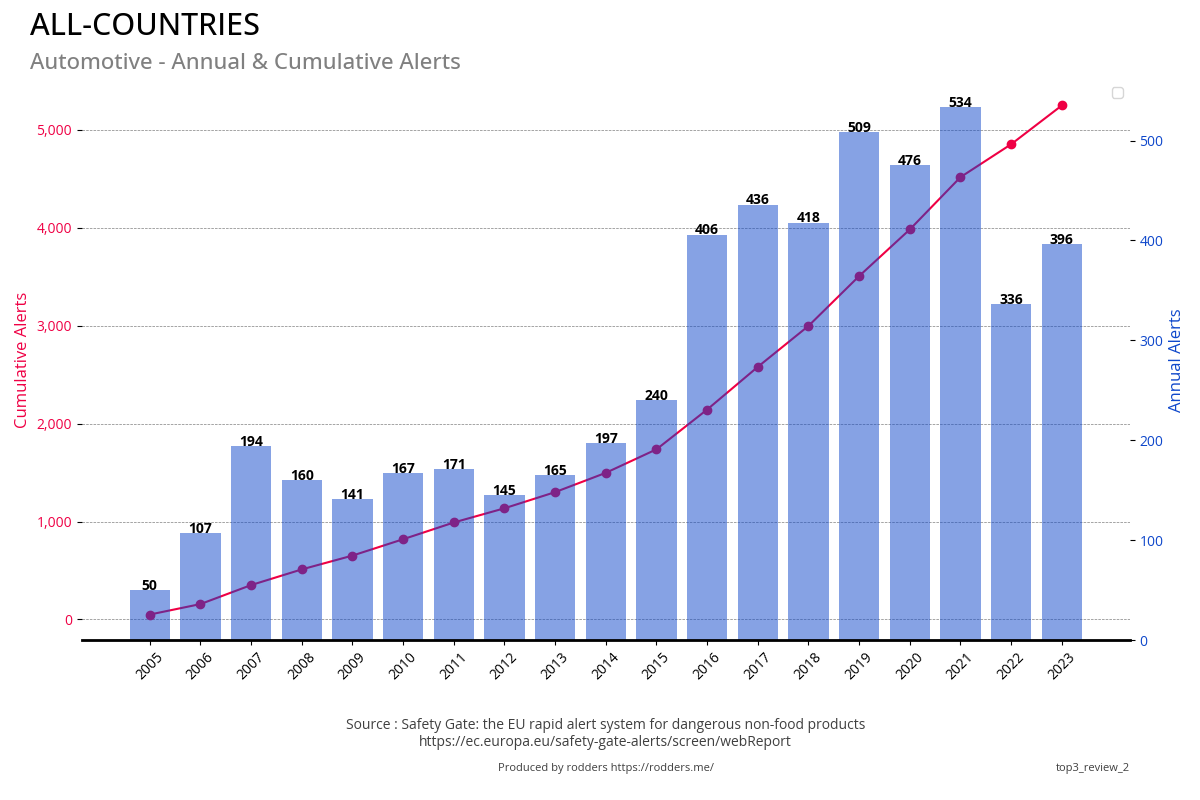
#3 - Total, Annual and Cumulative Alerts
Annual Alerts
Cumulative Total and YoY Change
Go to Top
#3 - Submitting Country
Previous Year Vs Current Year
Annual Total and Annual Percentage of Total
Annual Total
Cumulative Total and YoY Change
Go to Top
#3 - Risk Category
Previous Year Vs Current Year
Annual Total and Annual Percentage of Total
Annual Total
Annual Percentage of Total
Go to Top
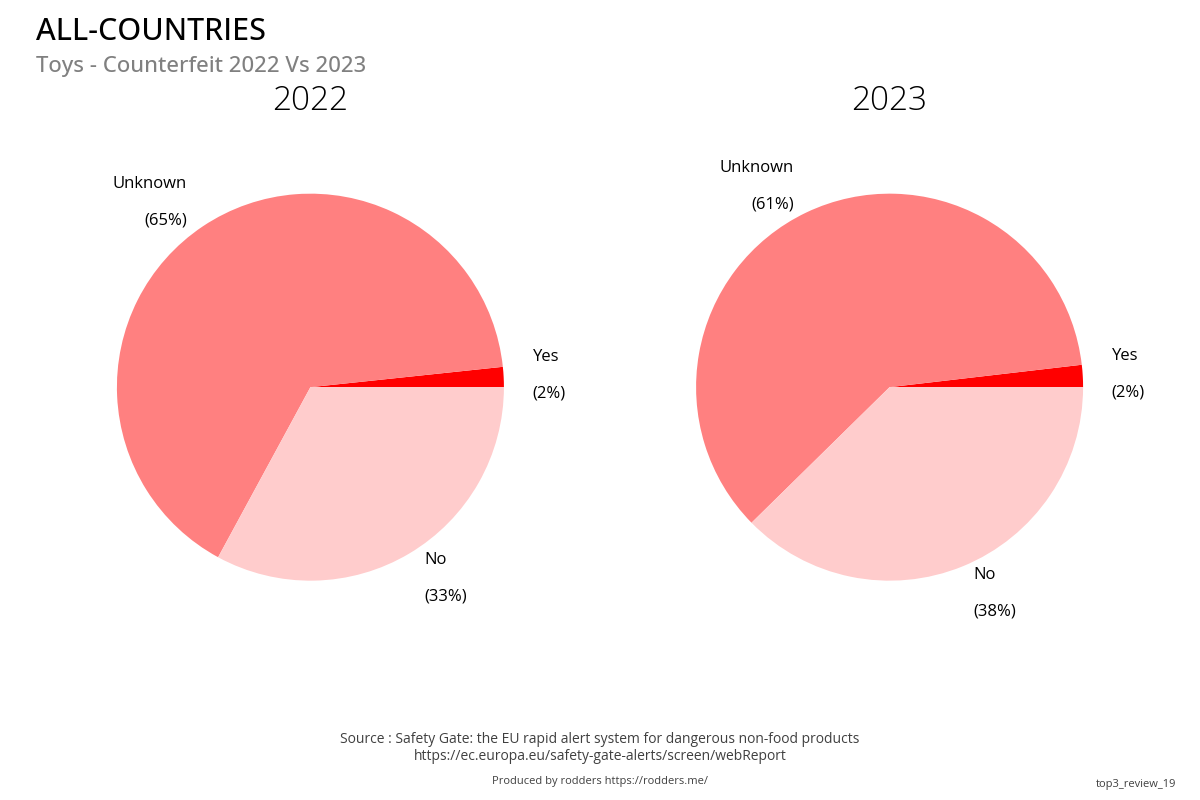
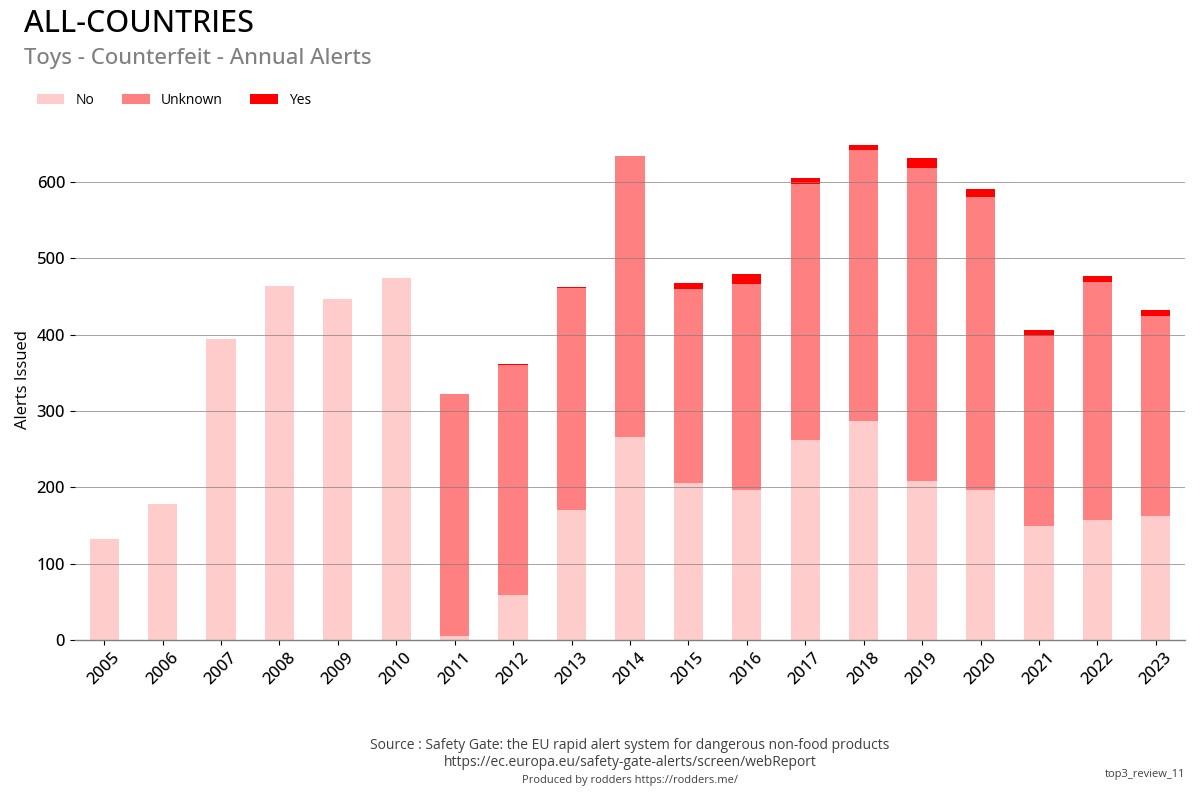
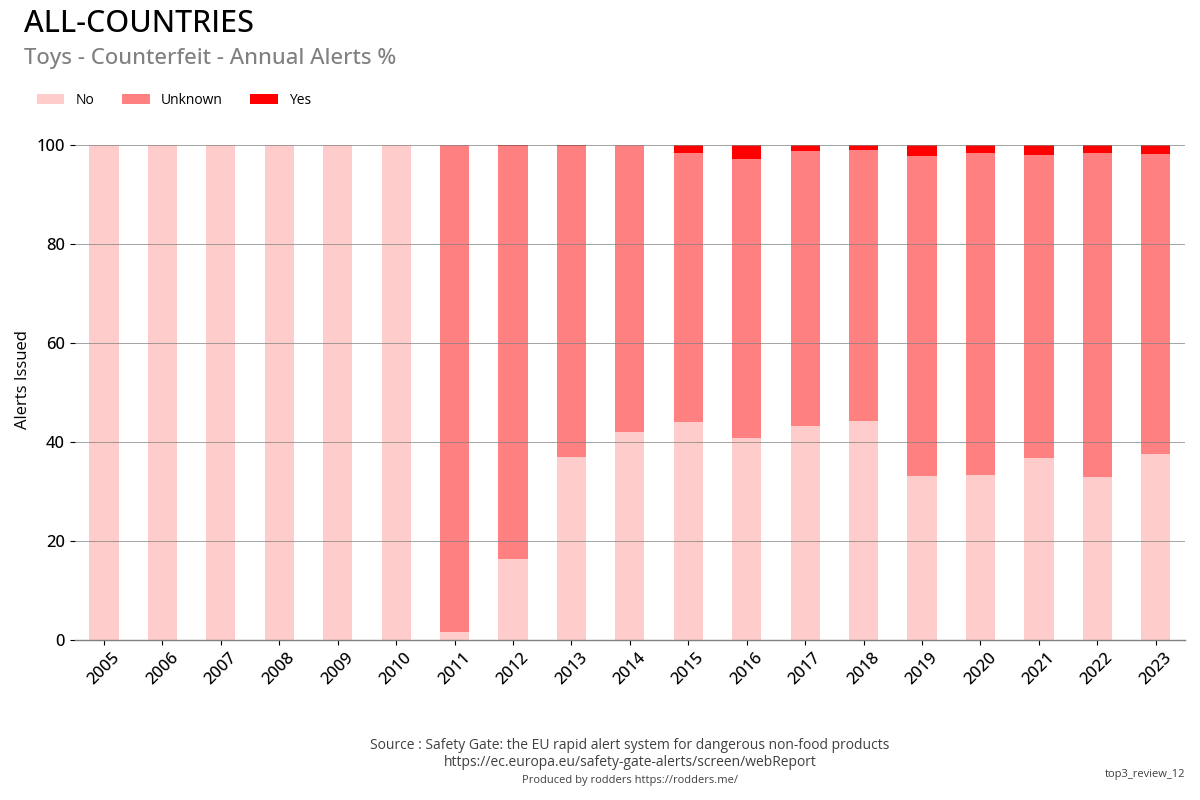
#3 - Counterfeit
Previous Year Vs Current Year
Annual Total and Annual Percentage of Total
Annual Total
Annual Percentage of Total
Go to Top
#3 - Compulsory / Voluntary Action Required
Previous Year Vs Current Year
Annual Total and Compulsory Vs Voluntary Total
Annual Total
Compulsory Vs Voluntary Total
Go to Top
#3 - Compulsory / Voluntary Responsible Party
Previous Year Vs Current Year
Annual Total Compulsory Vs Voluntary Total
Annual Total
Compulsory Vs Voluntary Total
Go to Top
#3 - Top Brands for Safety Alerts