EU Safety Gate Report 2024 - Detailed Visualisations
Jump to section
EU Safety Gate Visualisations report
Last Updated: Tuesday, September 17, 2024 12:55 PM - Data up to Week 37 - 2024
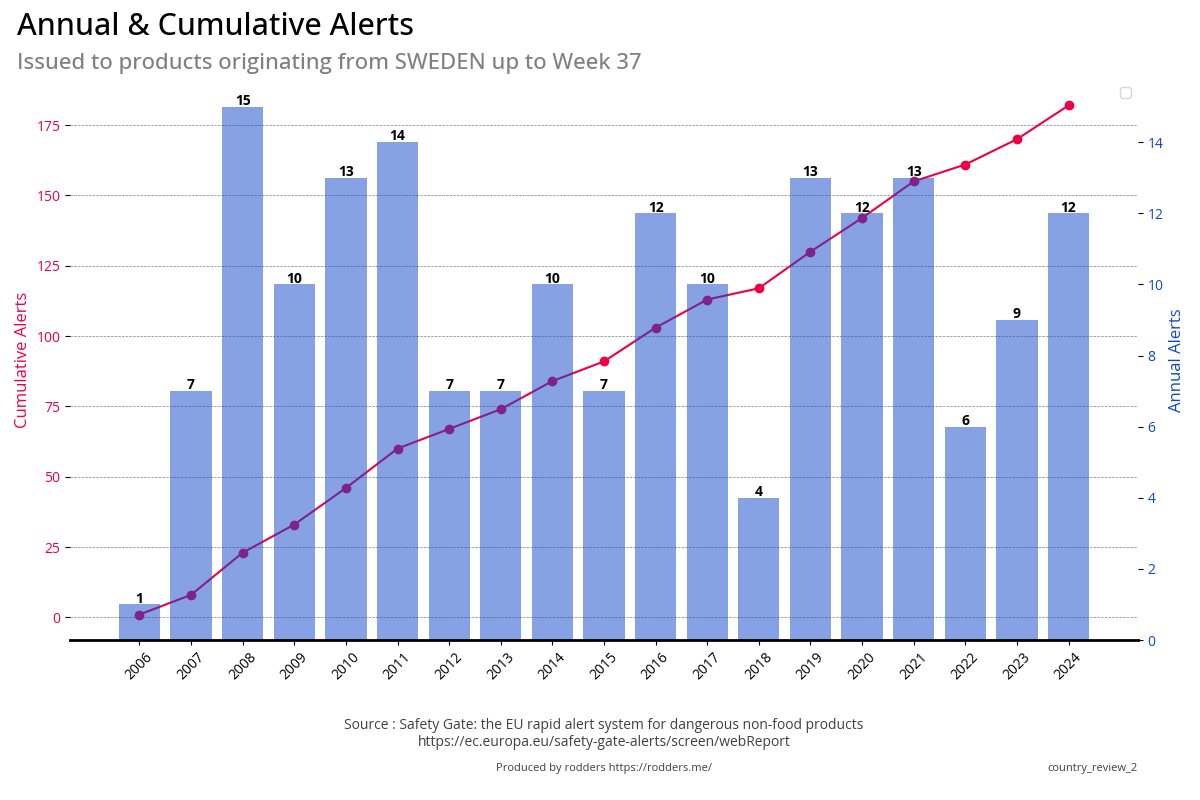
This report series compiles a detailed collection of visualisations depicting the safety alerts issued for non-food products by the
European Union. Featuring around 1,100 meticulously crafted matplotlib plots, this report offers an in-depth visual analysis of the total alerts,
allowing readers to easily interpret complex data trends, hazard types, and affected product categories. It serves as a valuable resource for those
seeking to understand the broader patterns and specifics of safety alerts through a graphical representation.
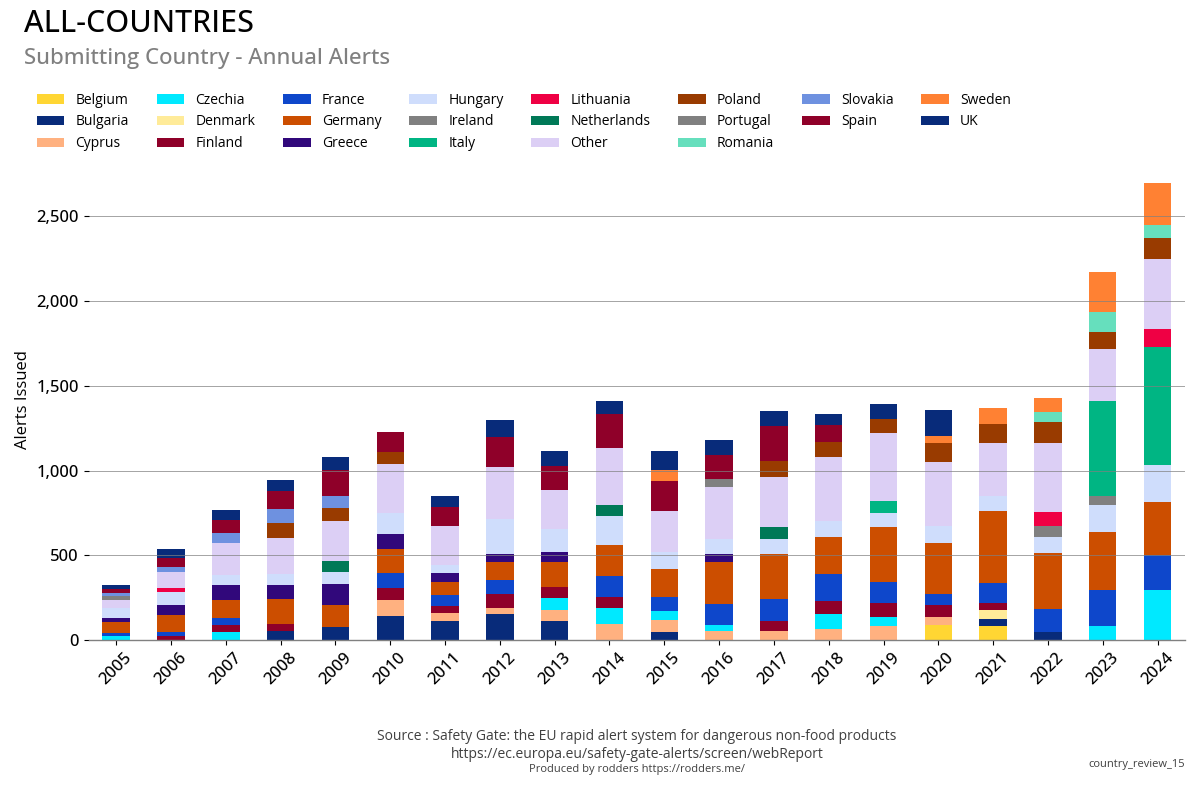
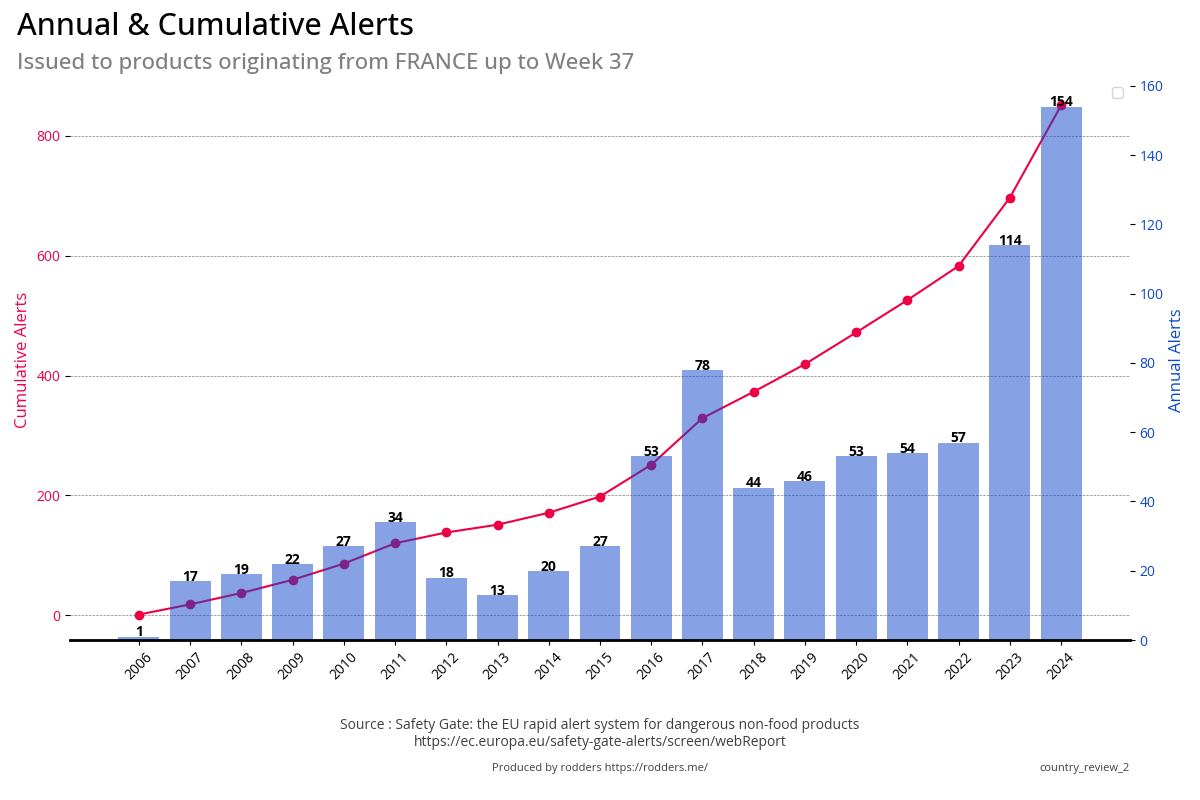
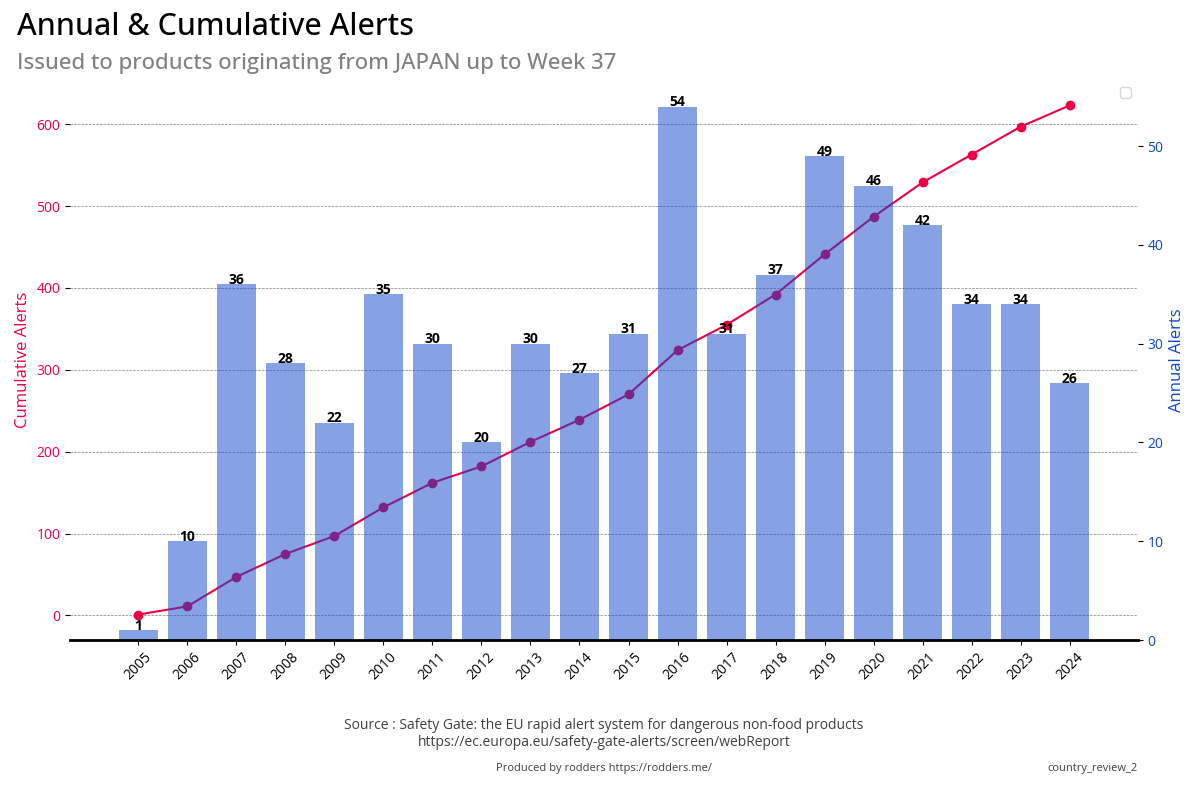
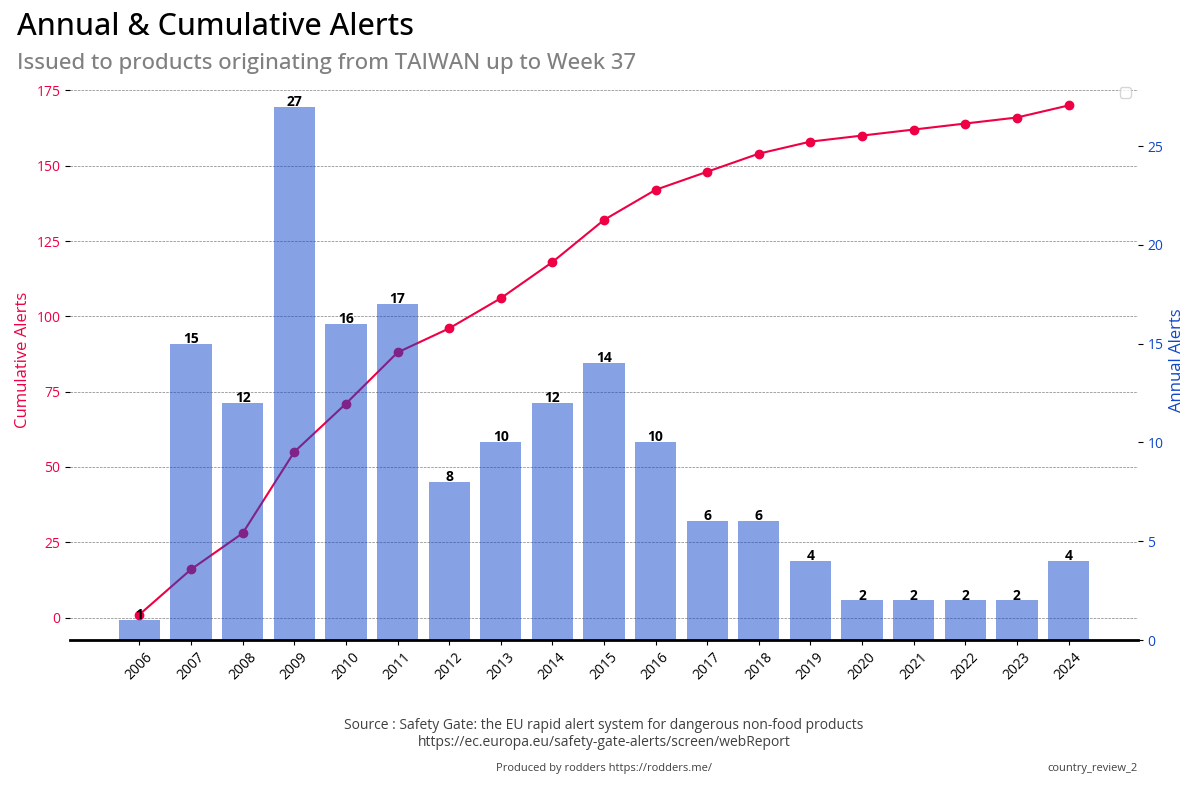
Covering the top 15 countries of product origin, this report details 94 visualisation for each country, covering the main topics
of the Safety Gate data.
This report compares two countries, covering the top 15 countries of product origin, this report visualisations
cover the main topics of the Safety Gate data for each country.
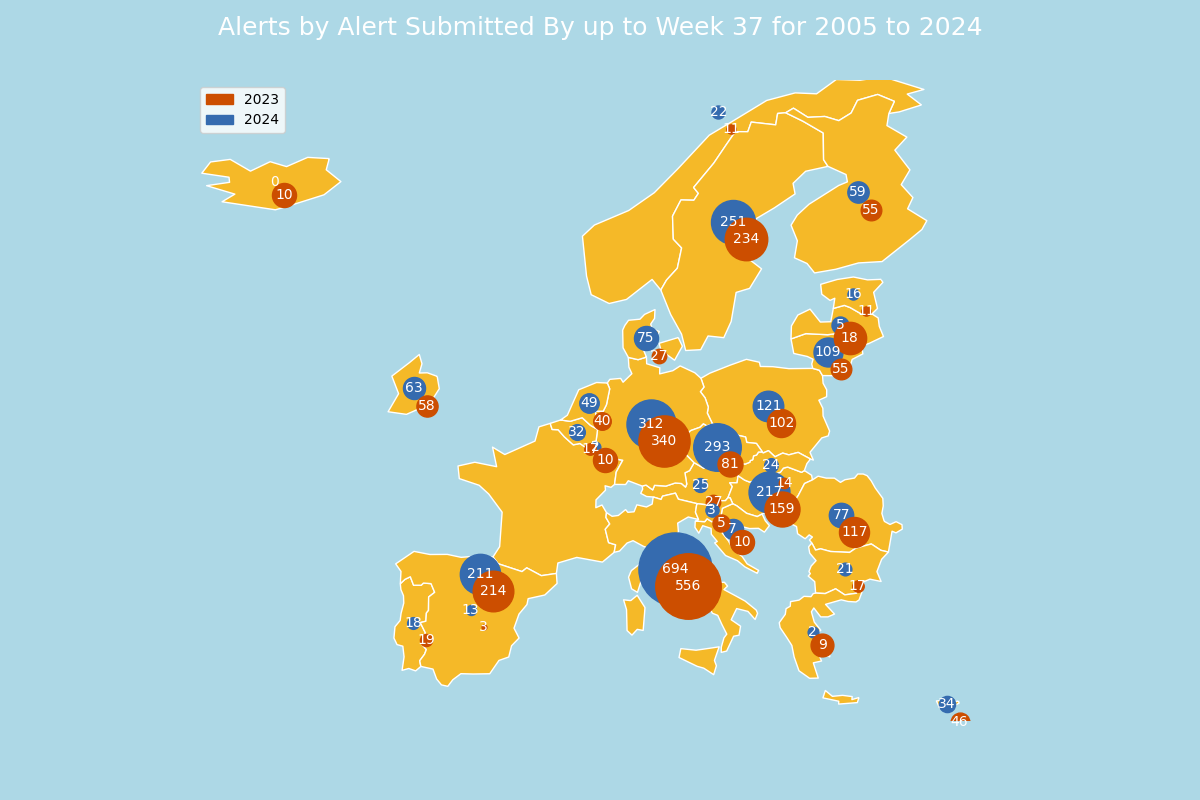
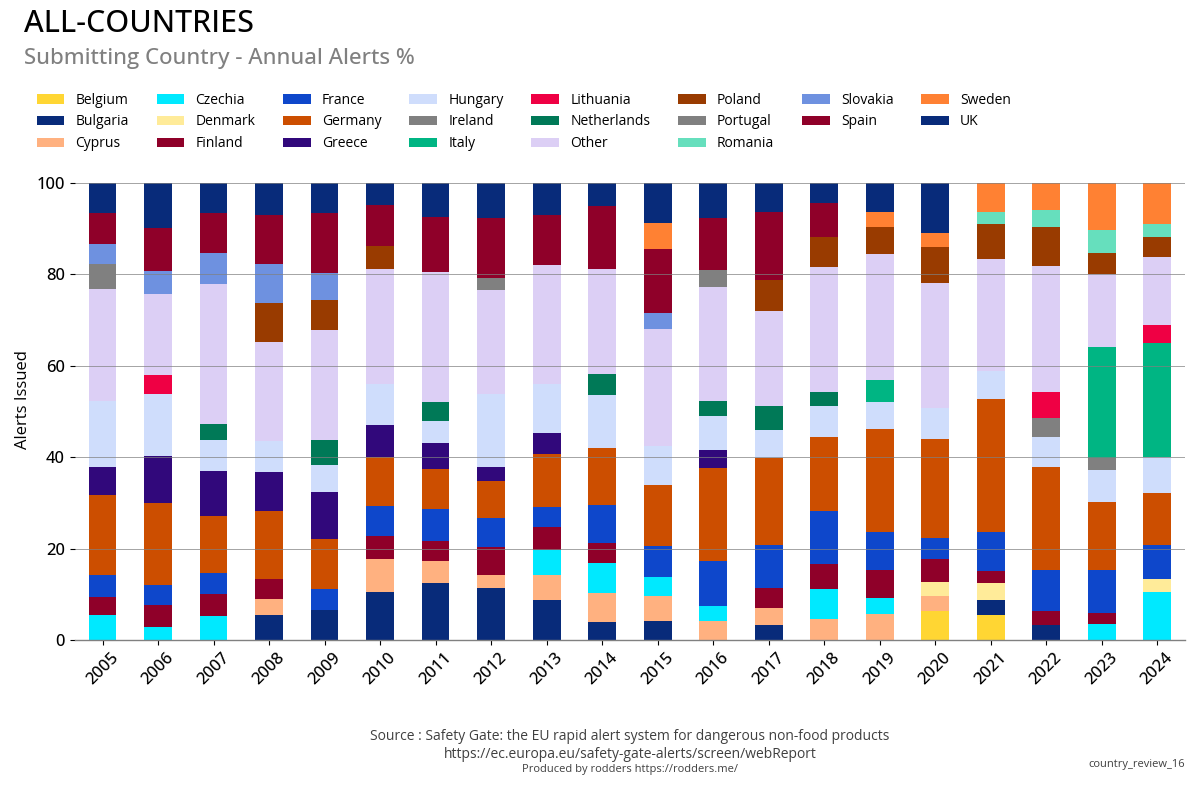
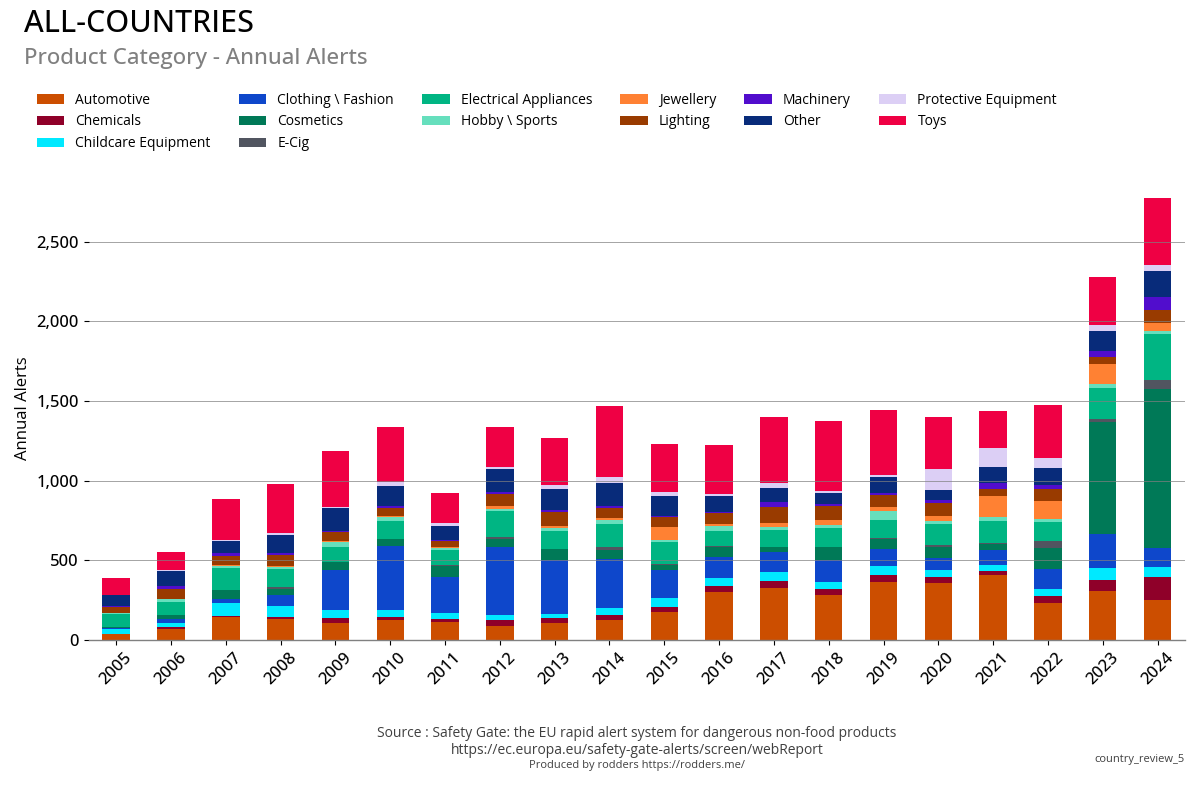
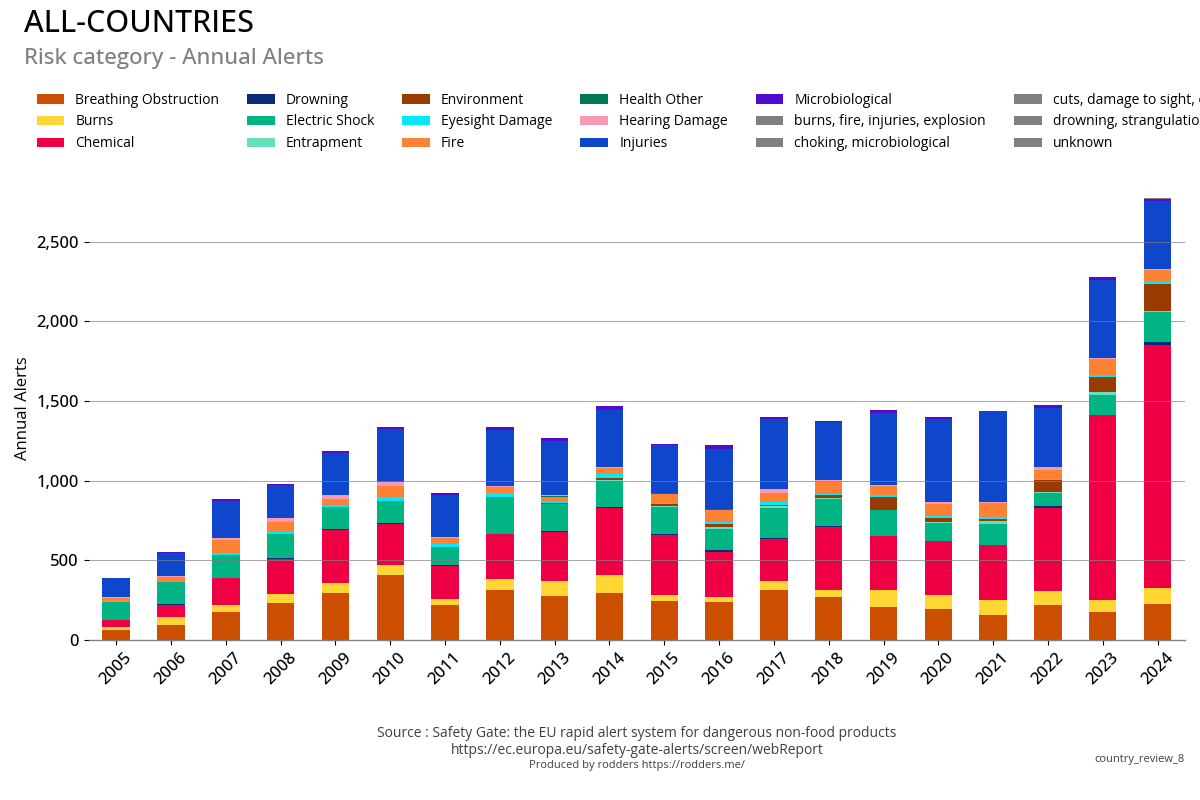
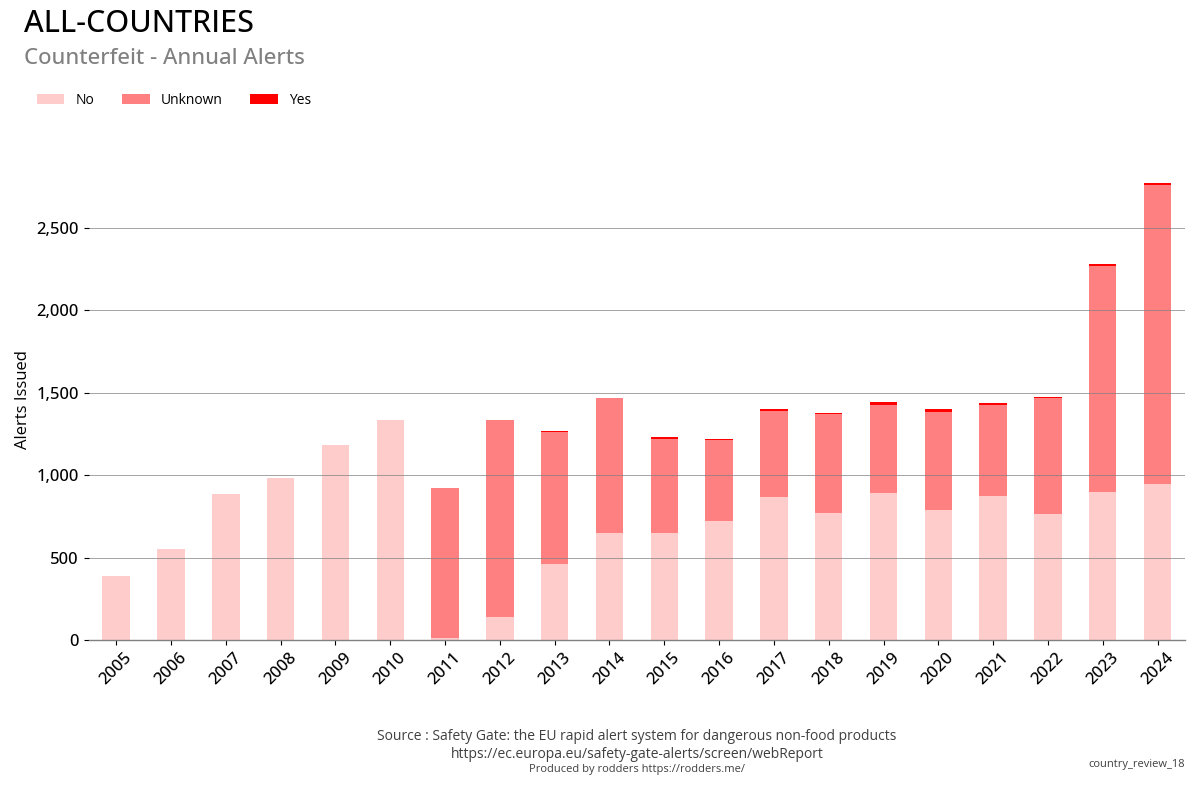
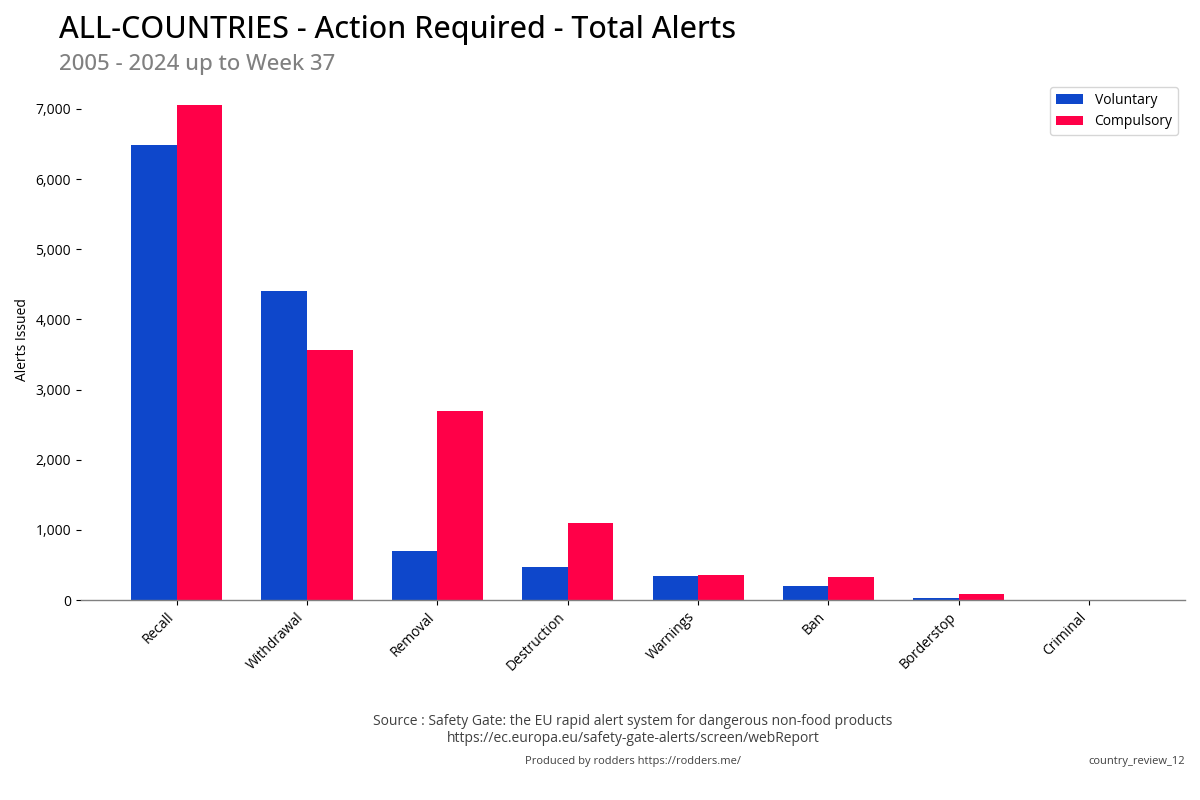
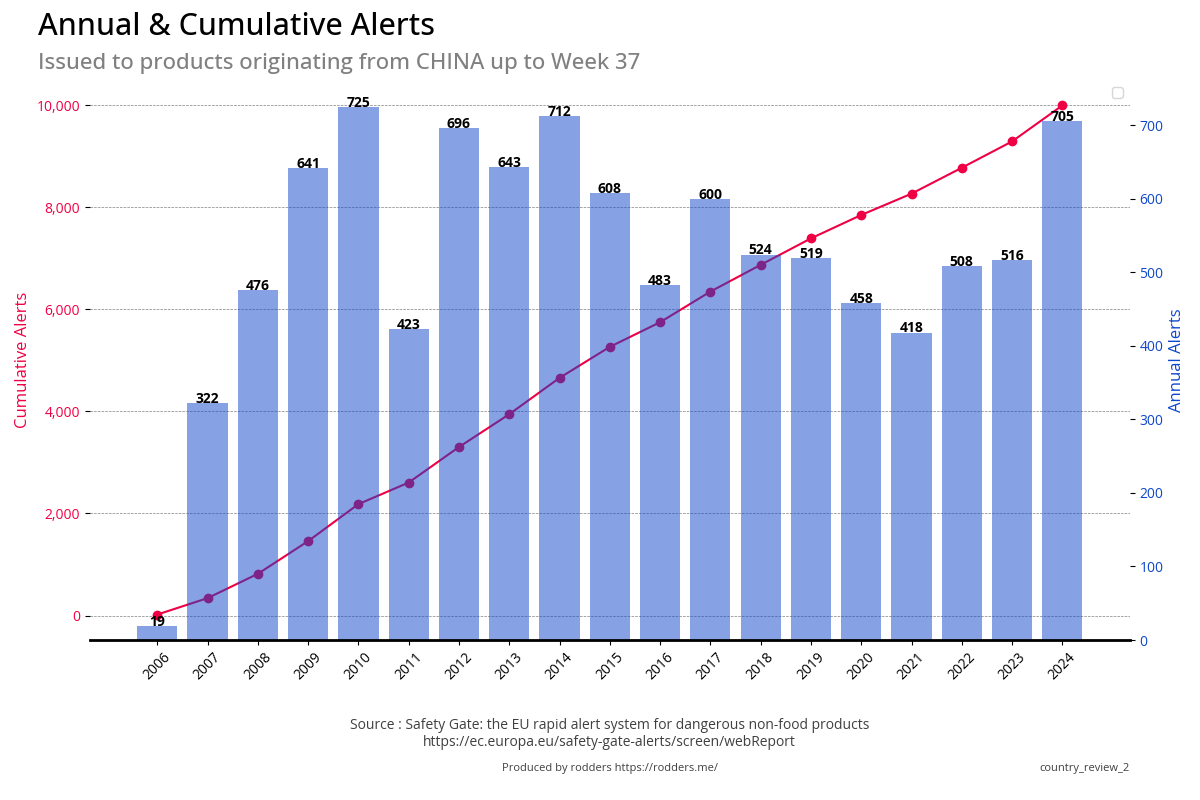
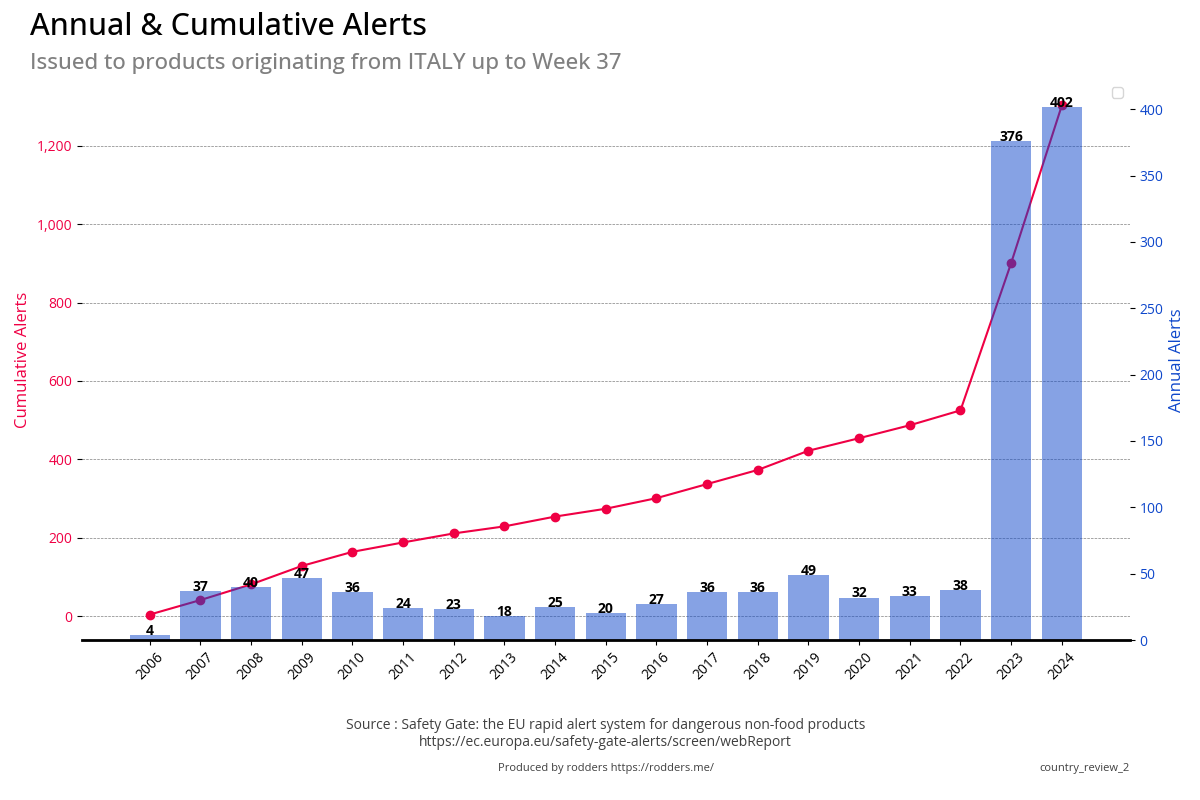
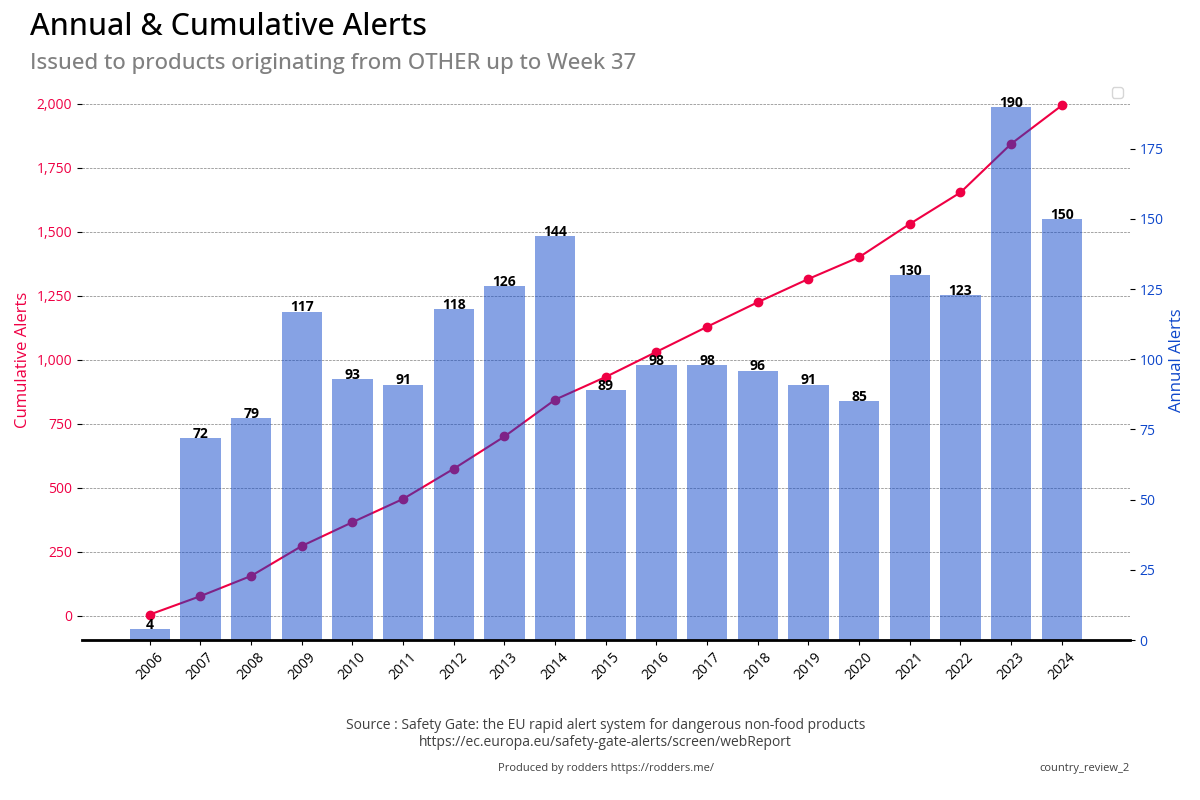
Over the last few years, the EU Safety Gate member states issue on average around 2,000
- 2,200 safety alerts per year.
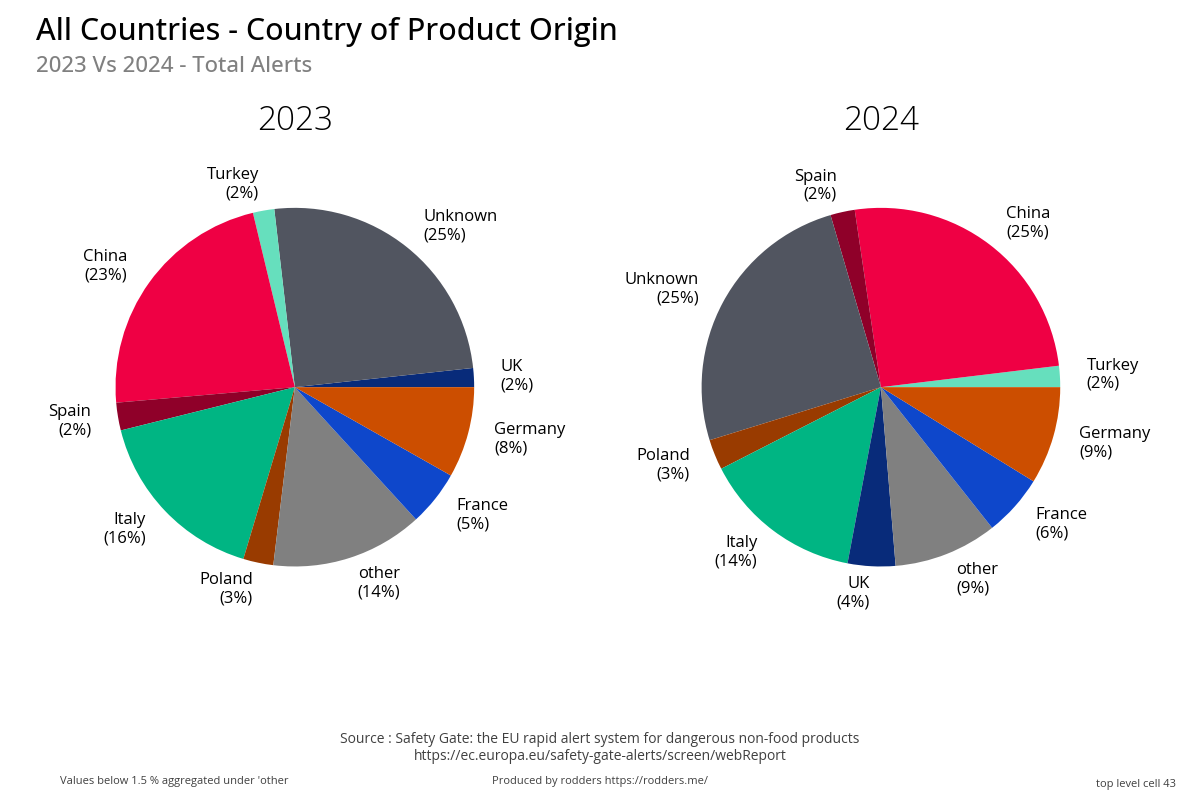
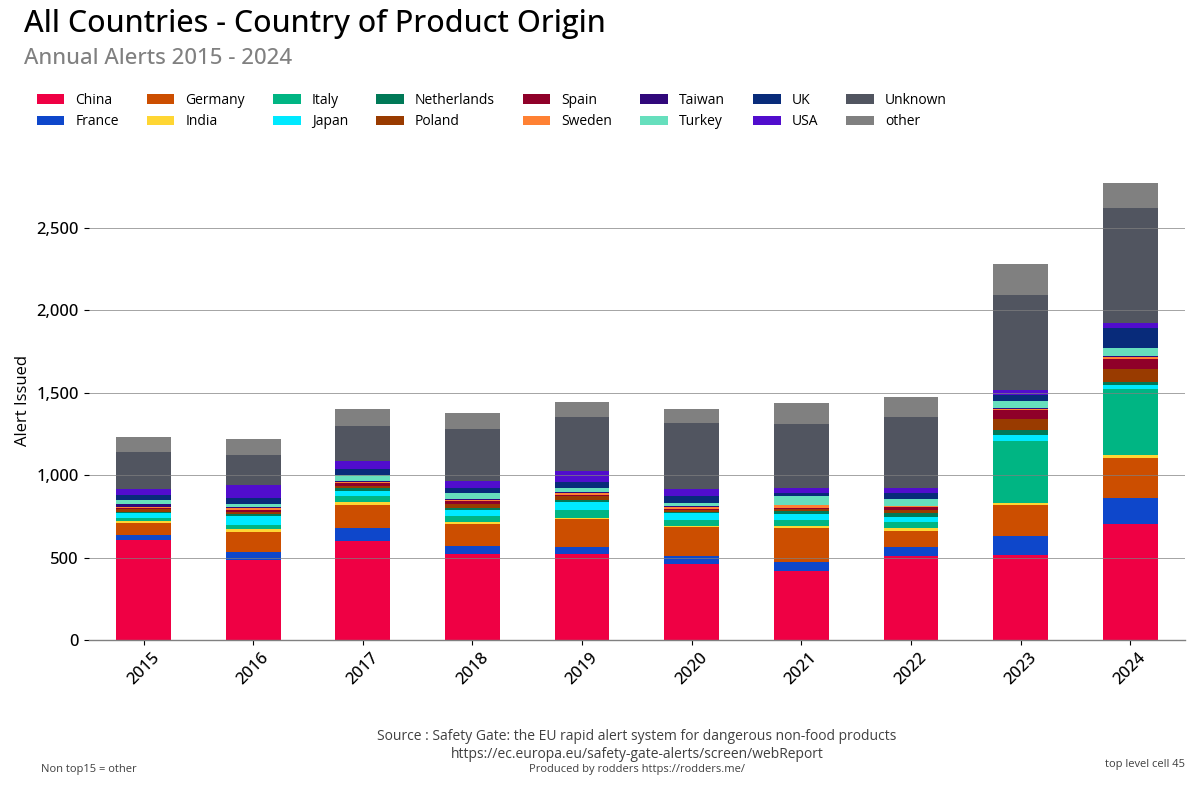
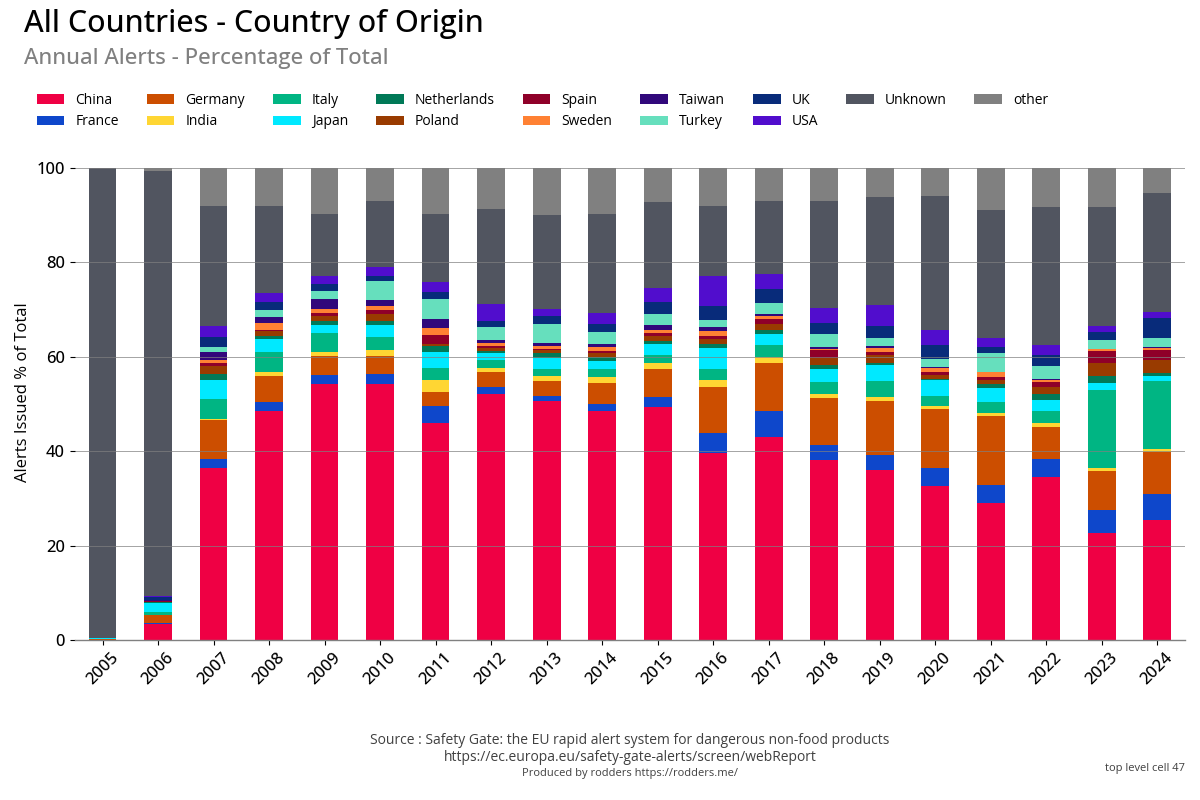
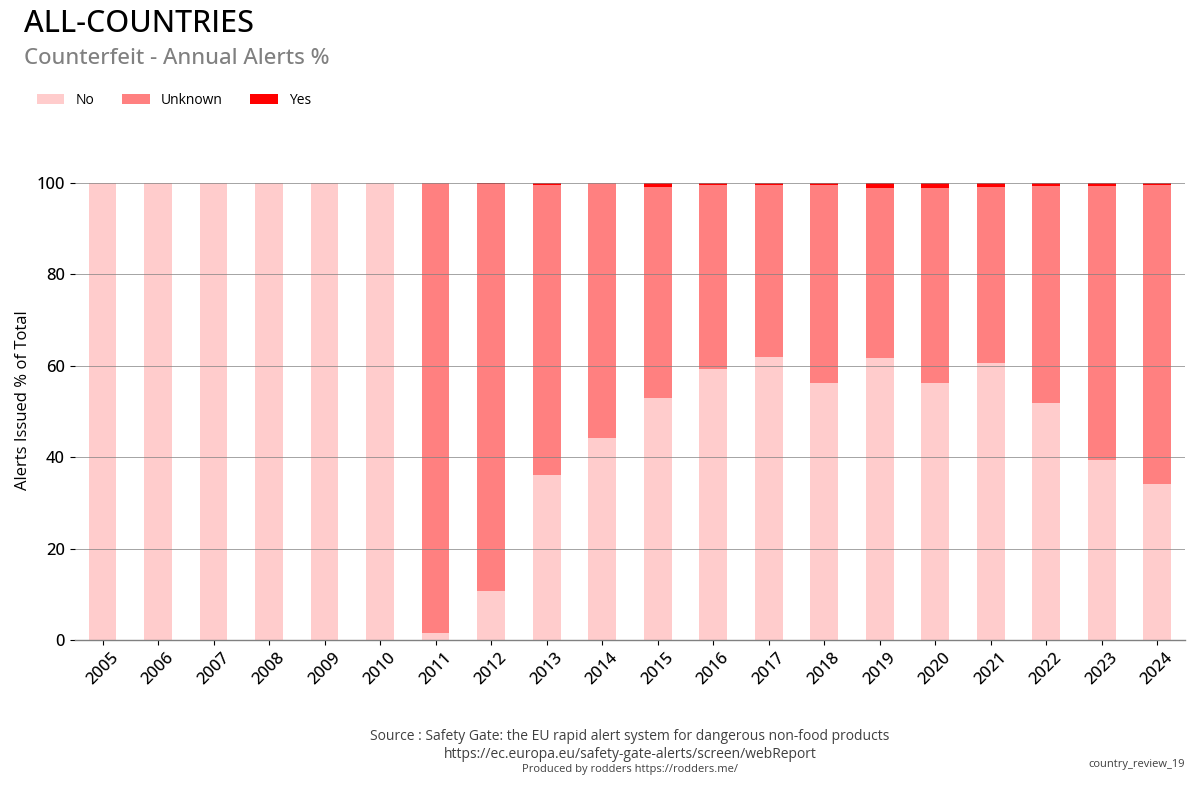
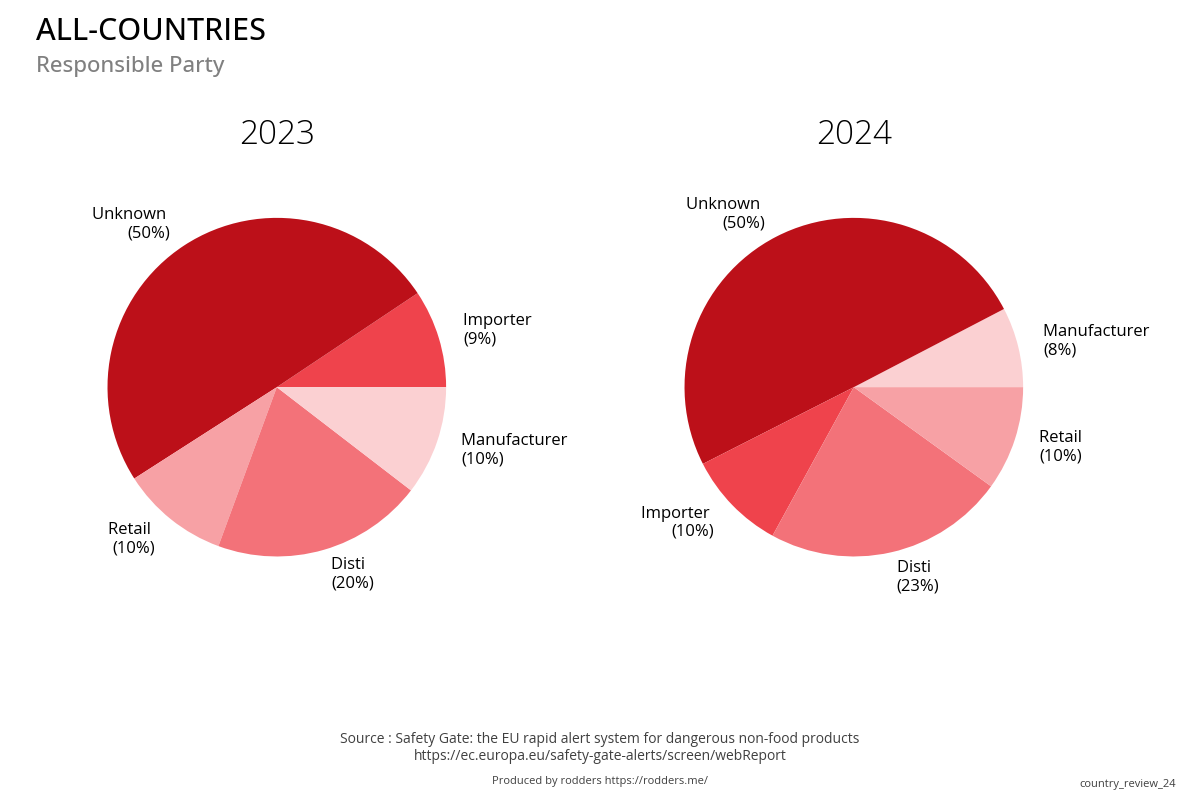
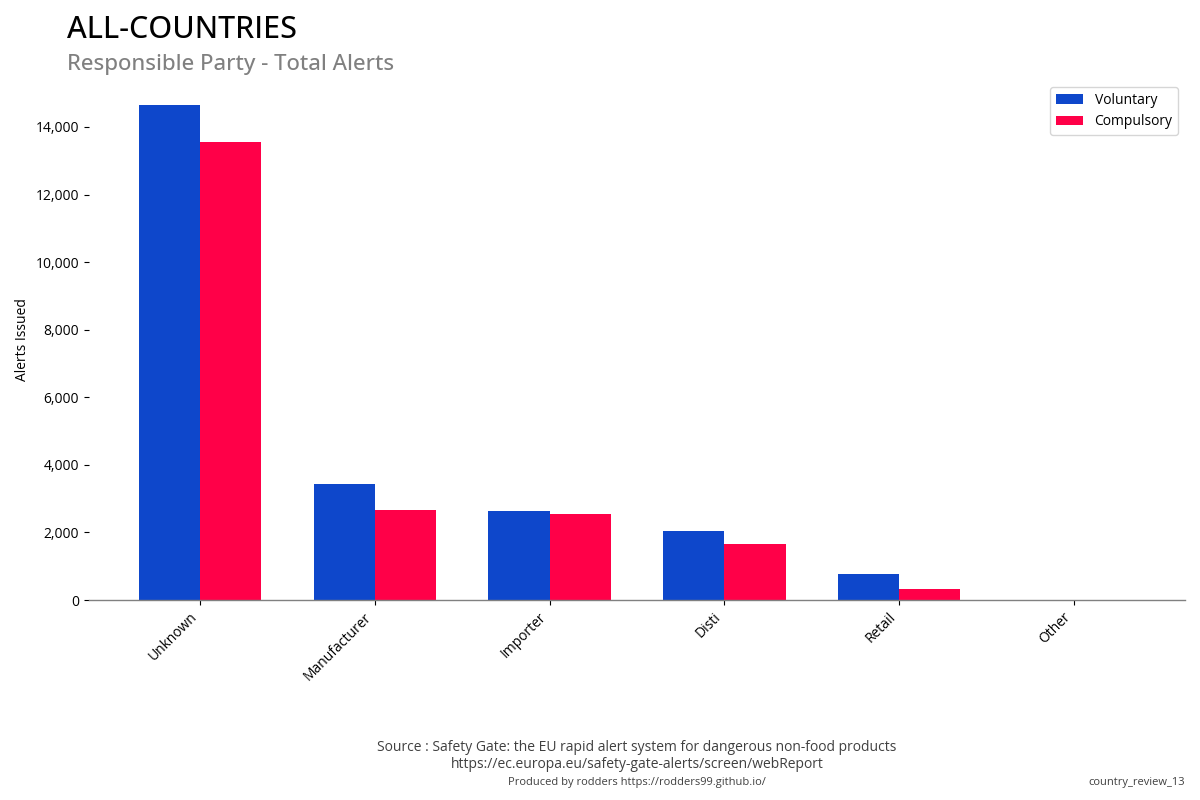
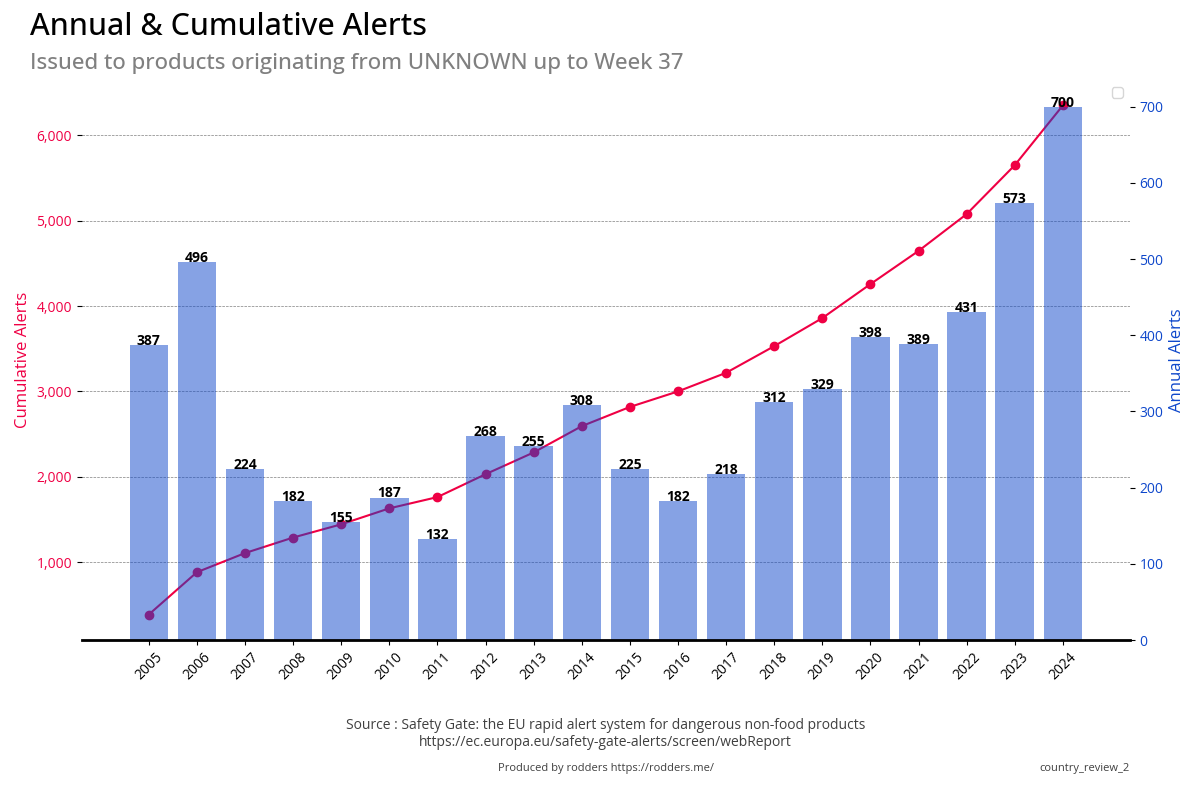
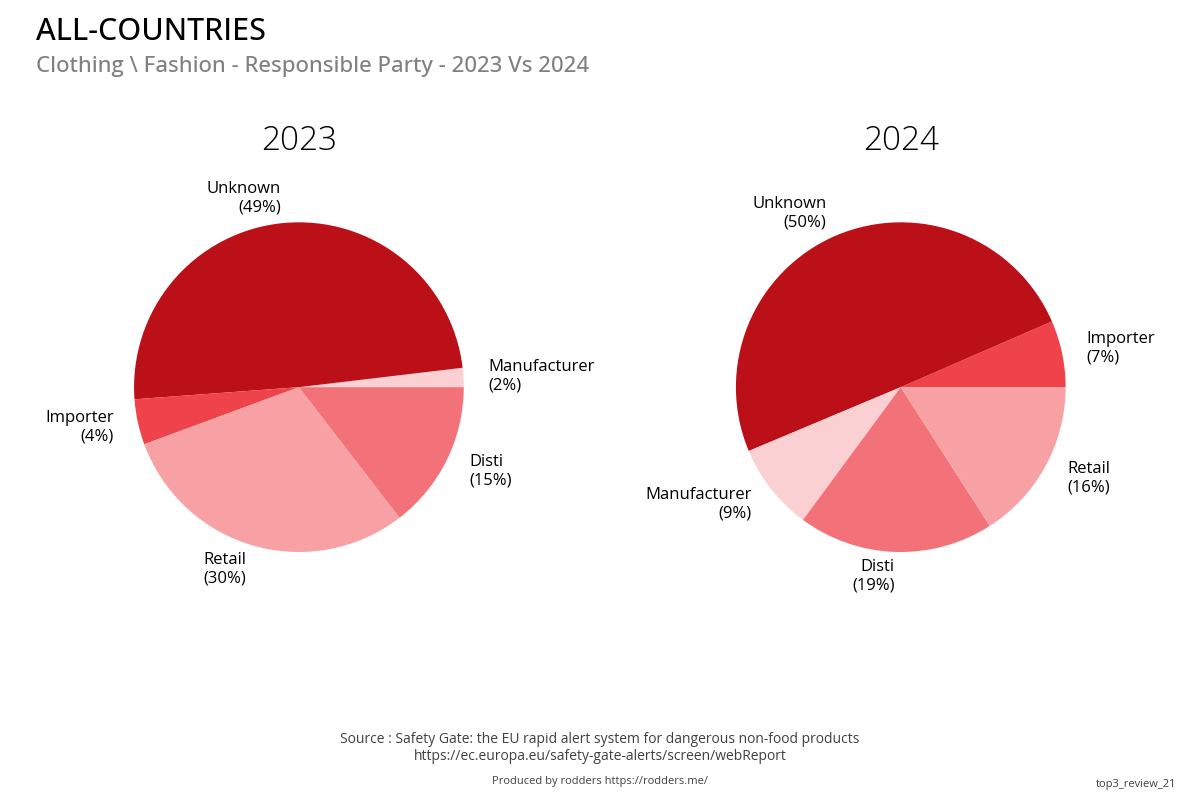
Around 25% of all alerts issued are for products where the Country of Origin is unknown.
On average China represents around 50% of Alerts issued from 2005 - 2024, however this has dropped considerably over the last few years.
Metric
2005
2006
2007
2008
2009
2010
2011
2012
2013
2014
2015
Count
559
831
1,274
1,465
1,577
1,854
1,520
1,873
2,008
2,236
1,851
% Change
0
49
53
15
8
18
-18
23
7
11
-17
Change
0
272
443
191
112
277
-334
353
135
228
-385
Metric
2016
2017
2018
2019
2020
2021
2022
2023
2024
2025
2026
Count
1,868
2,013
2,030
2,113
2,156
2,055
2,072
3,245
2,773
% Change
0
8
1
4
2
-5
1
57
-15
Change
0
145
17
83
43
-101
17
1,173
-472
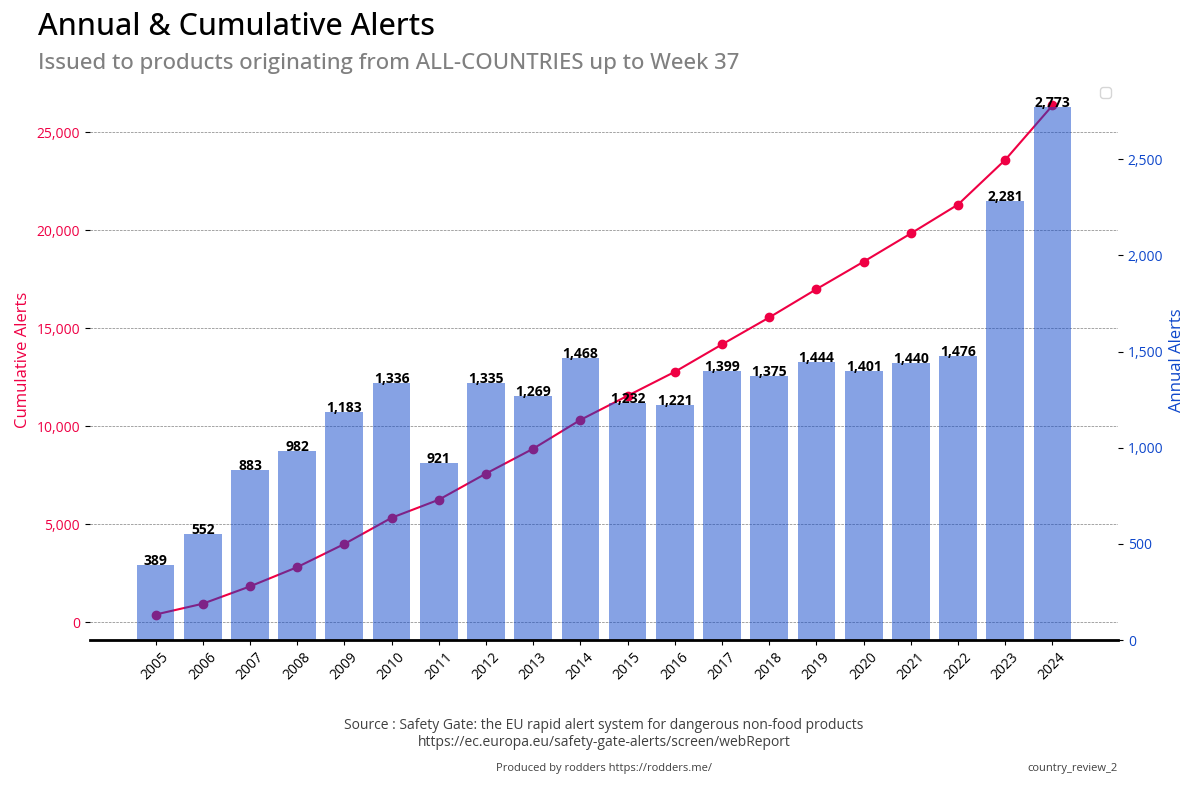
Comparing up to the same week number
Metric
2005
2006
2007
2008
2009
2010
2011
2012
2013
2014
2015
Count
389
552
883
982
1,183
1,336
921
1,335
1,269
1,468
1,232
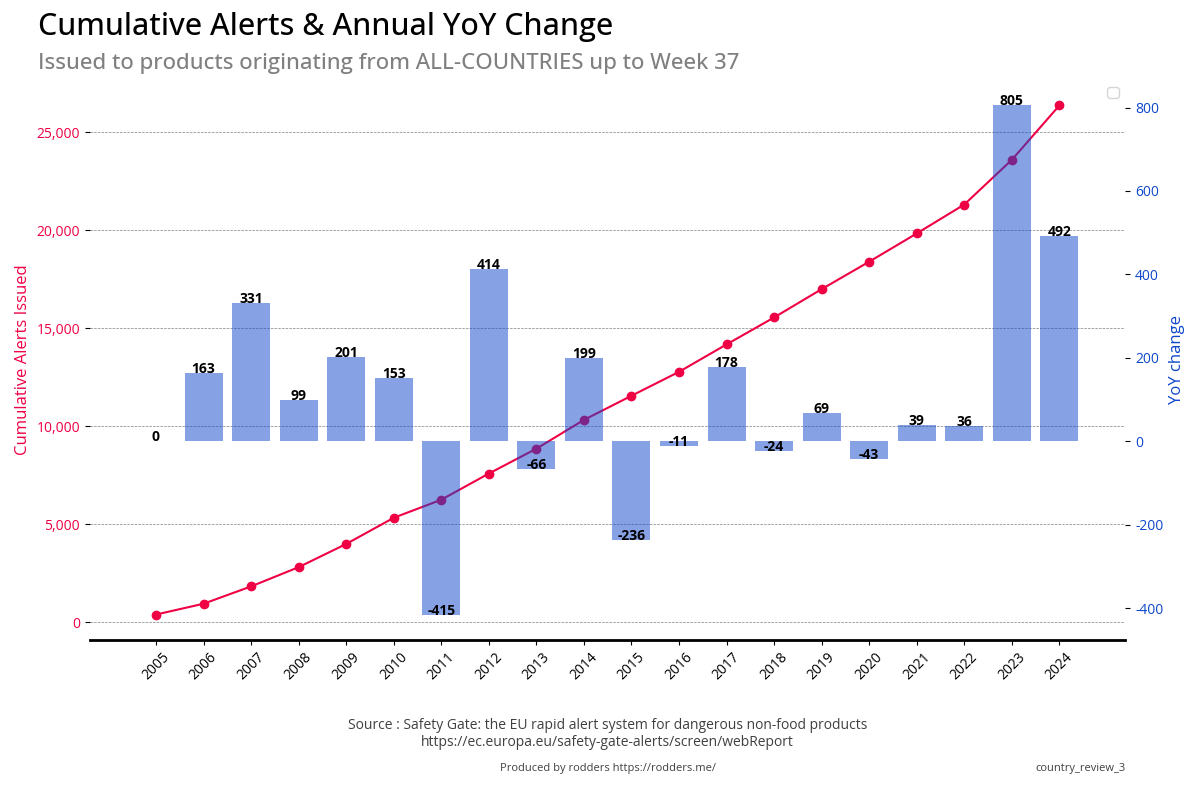
% Change
0
42
60
11
20
13
-31
45
-5
16
-16
Change
0
163
331
99
201
153
-415
414
-66
199
-236
Metric
2016
2017
2018
2019
2020
2021
2022
2023
2024
2025
2026
Count
1,221
1,399
1,375
1,444
1,401
1,440
1,476
2,281
2,773
% Change
0
15
-2
5
-3
3
2
55
22
Change
0
178
-24
69
-43
39
36
805
492
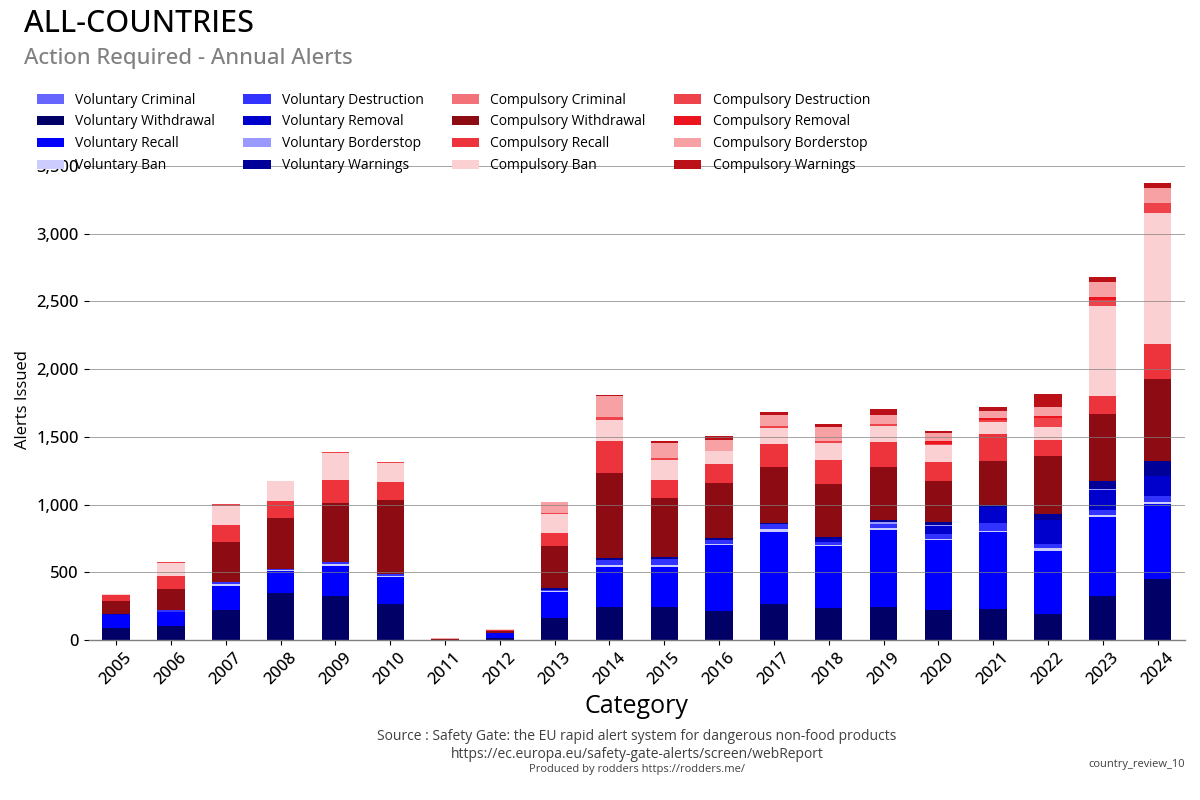
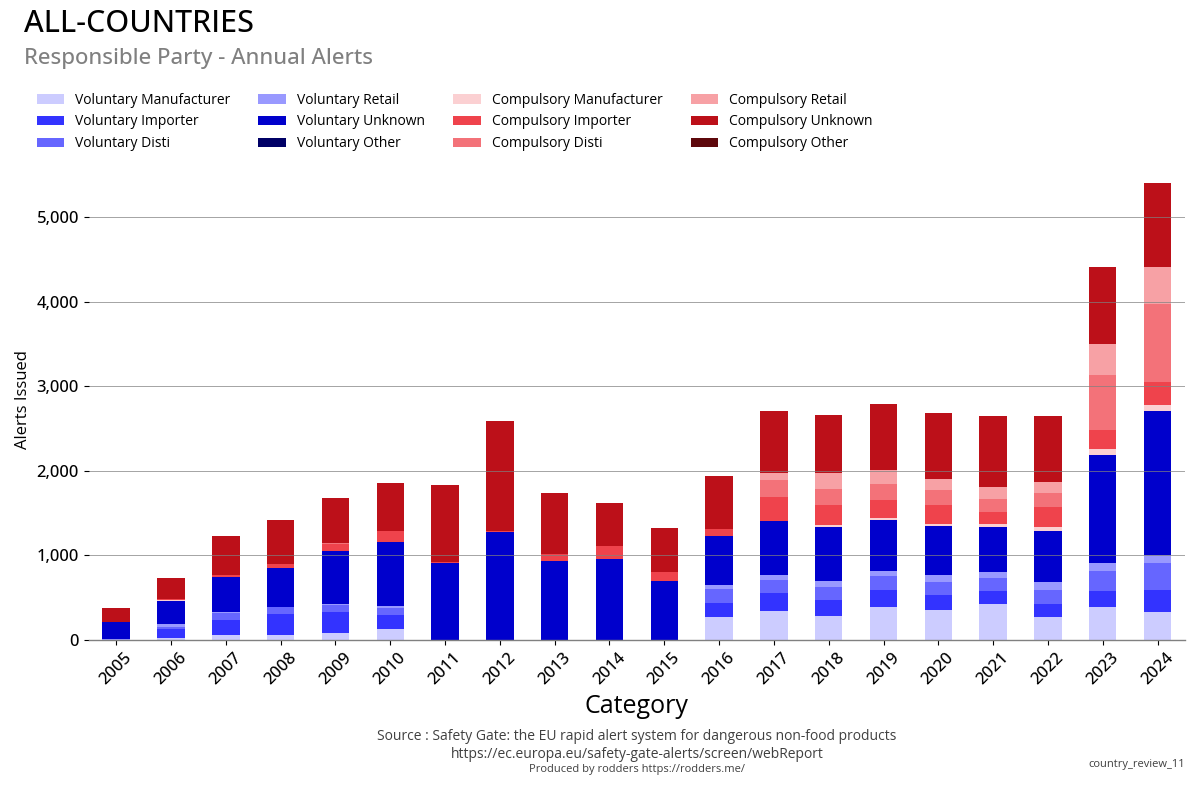
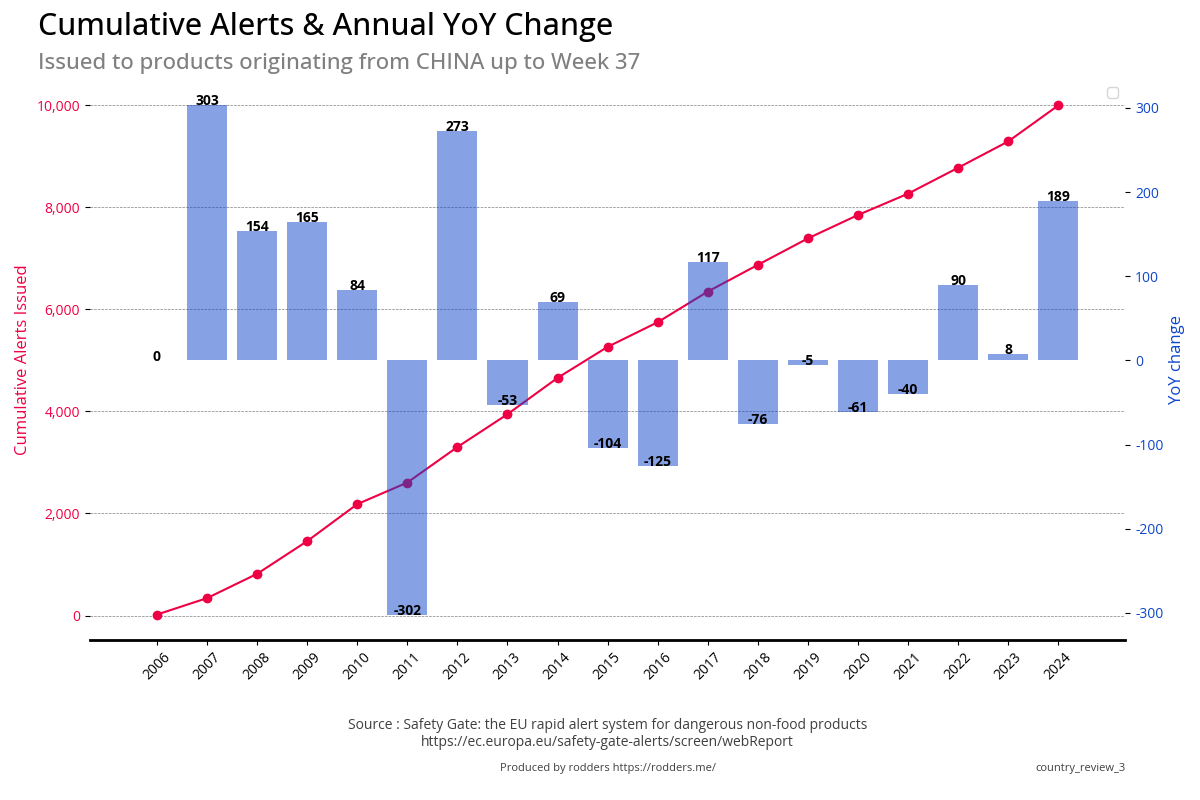
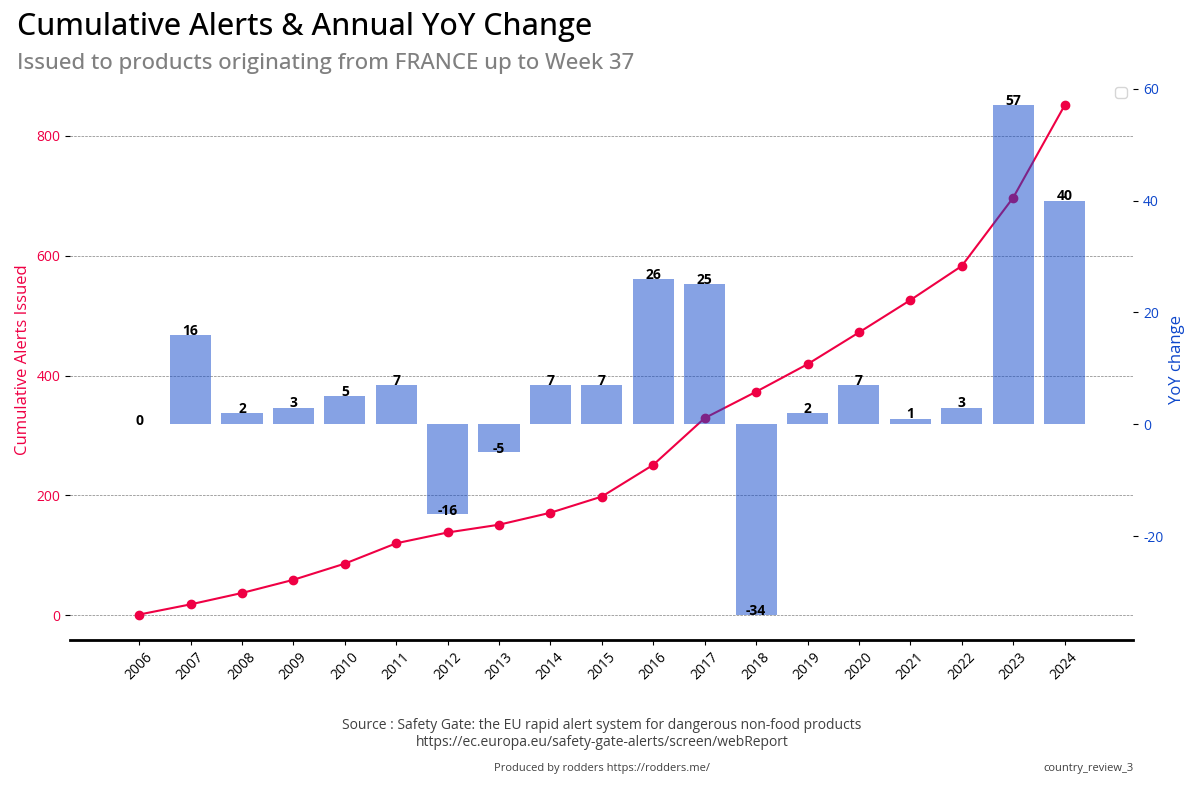
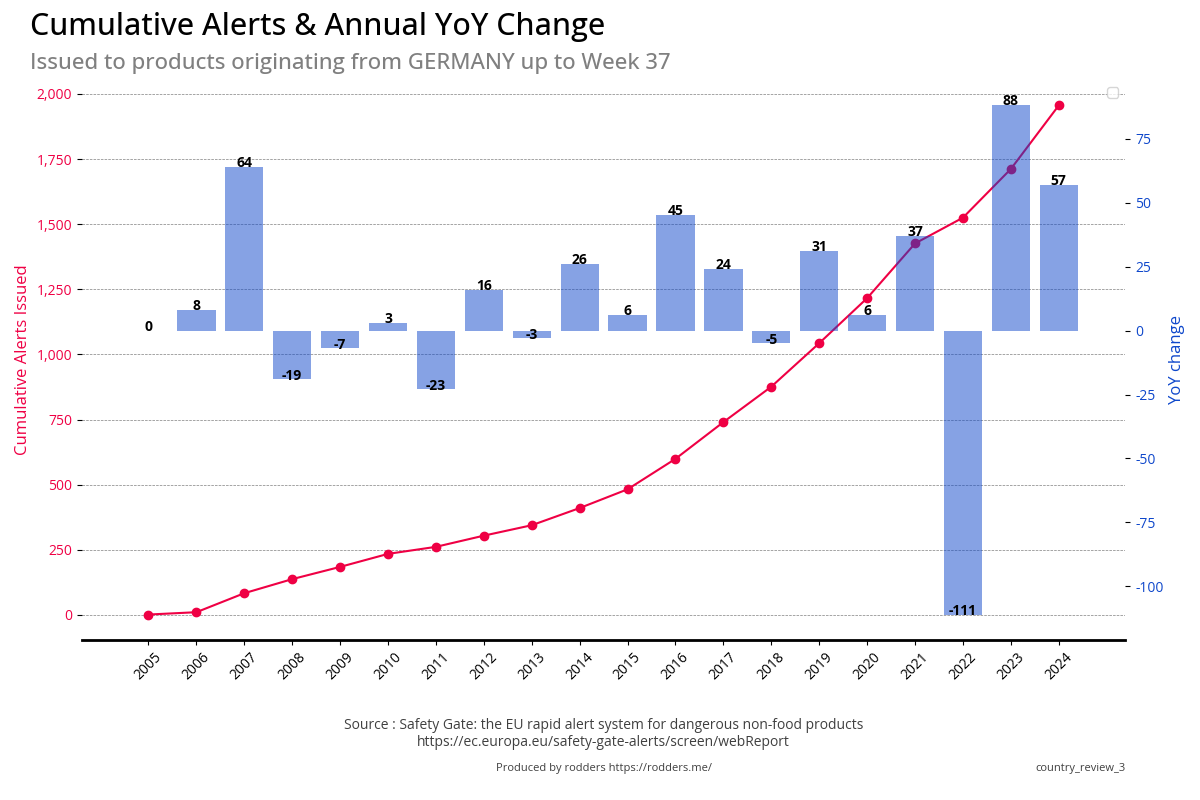
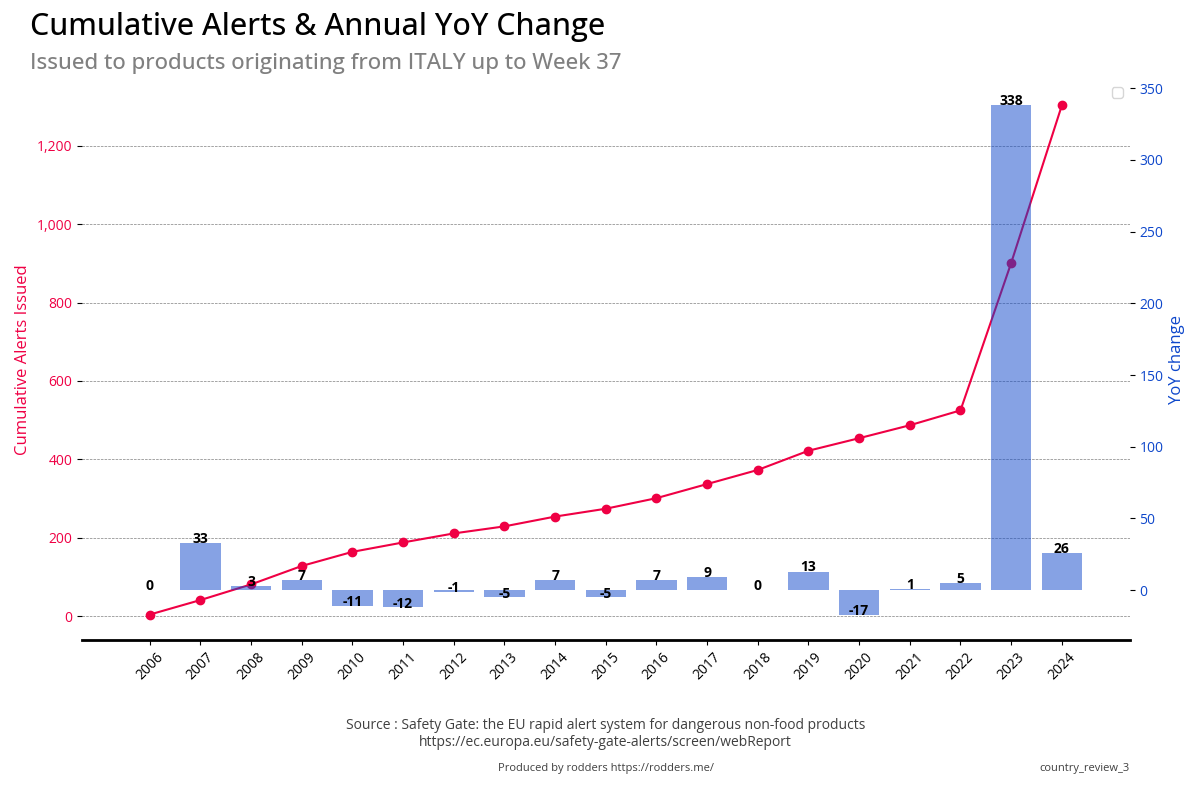
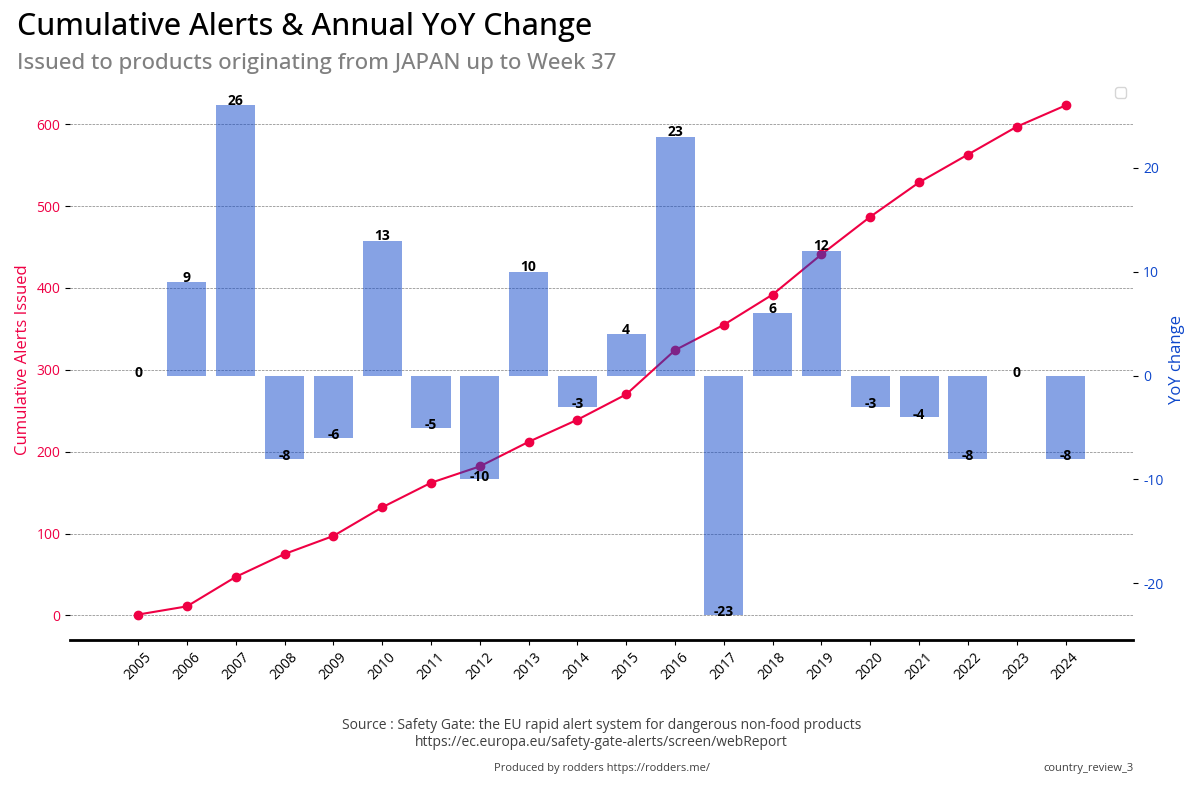
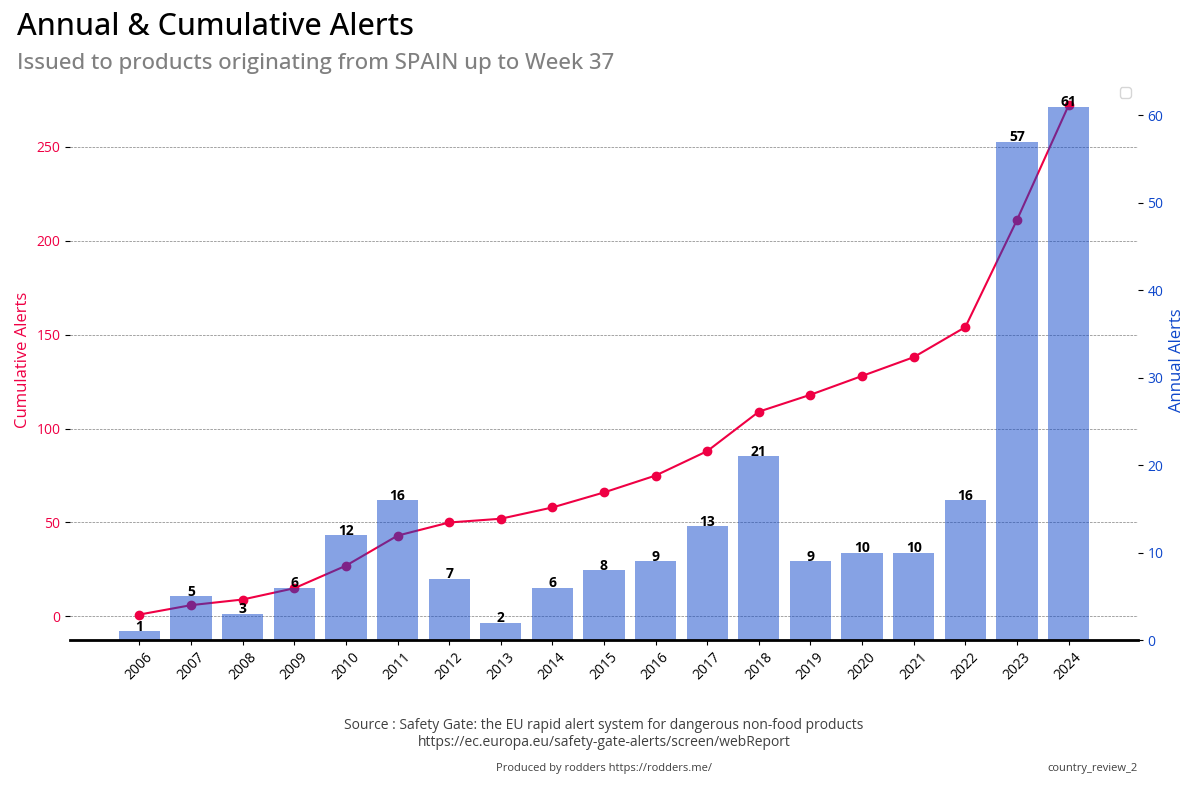
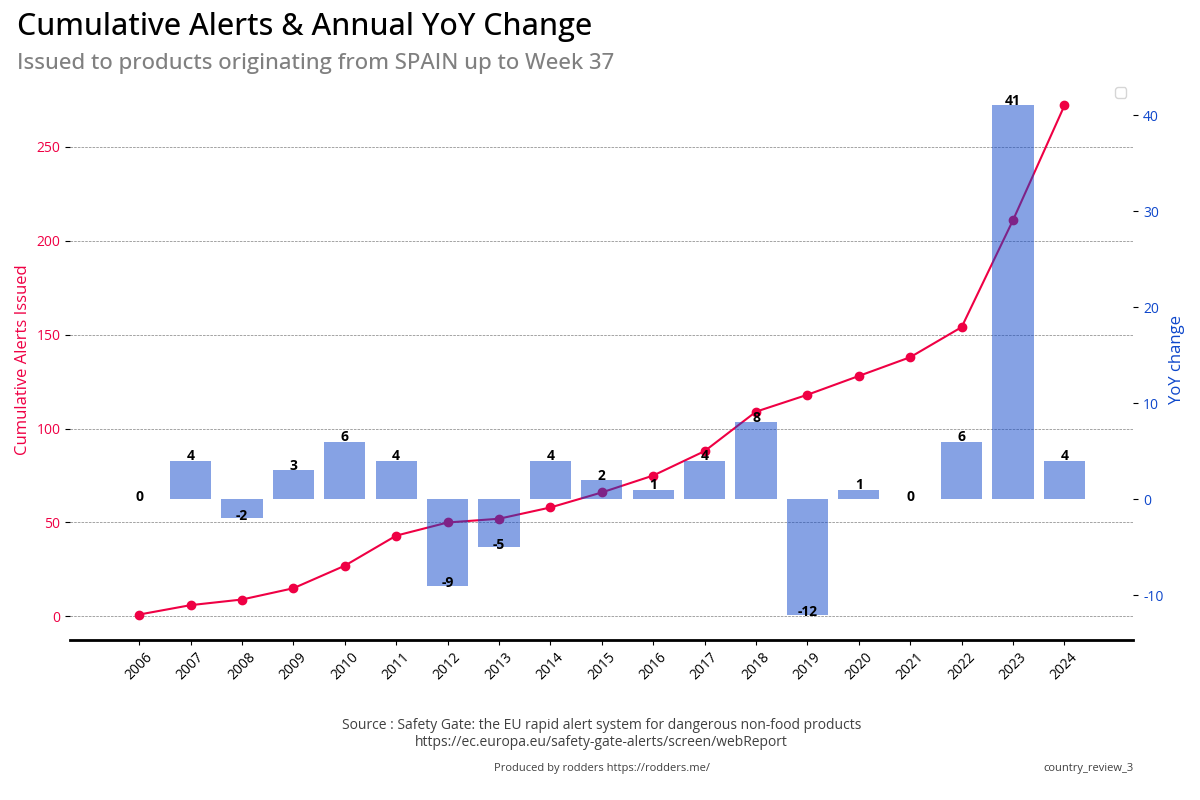
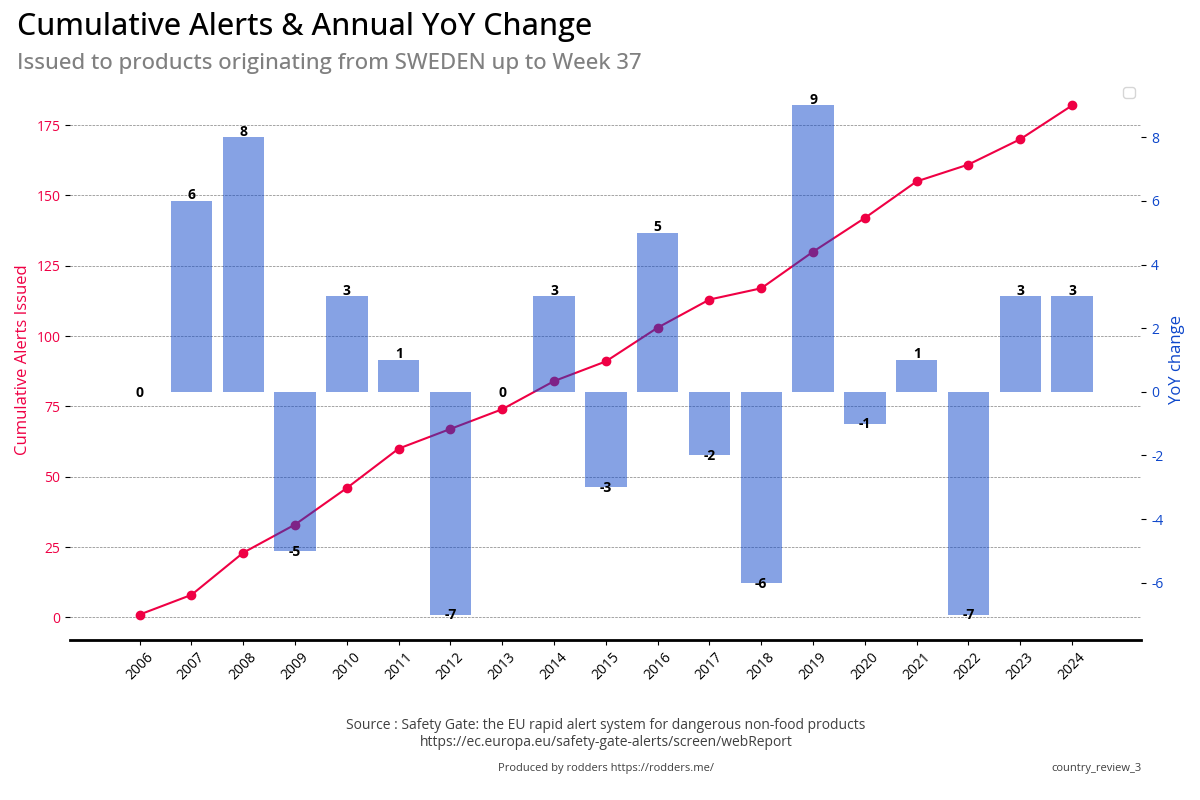
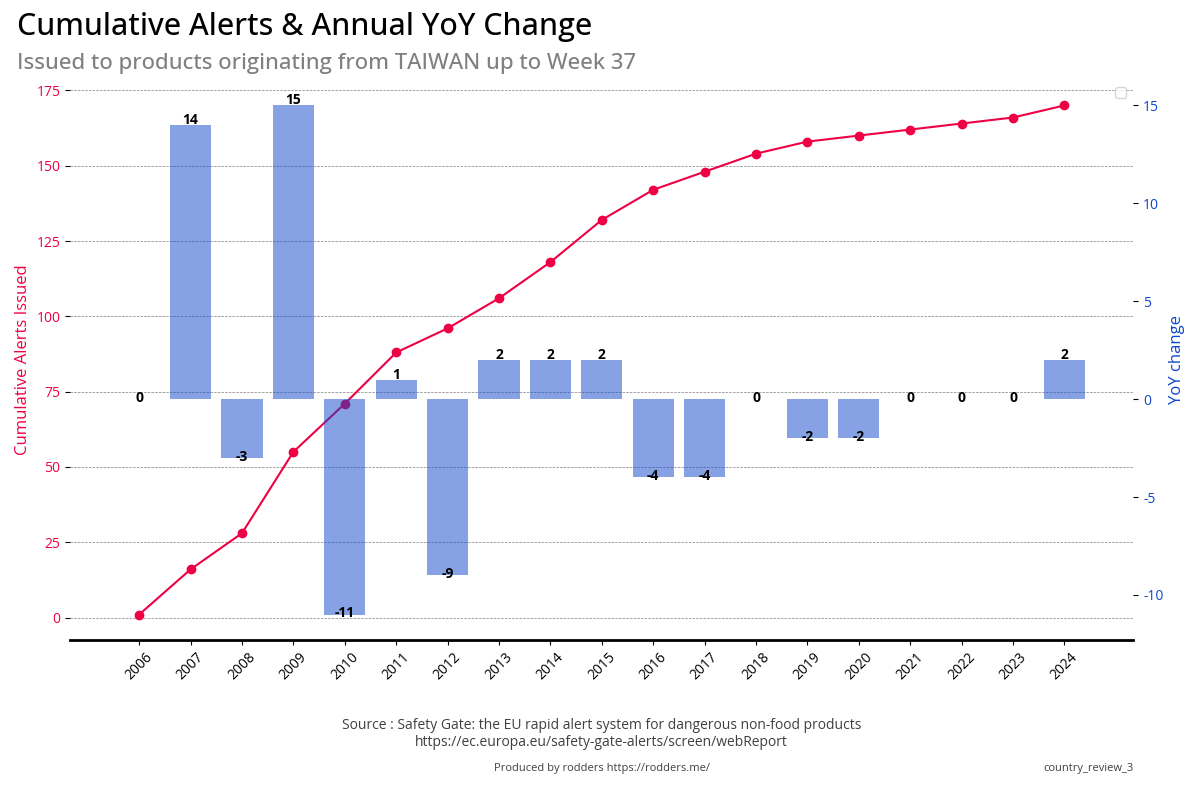
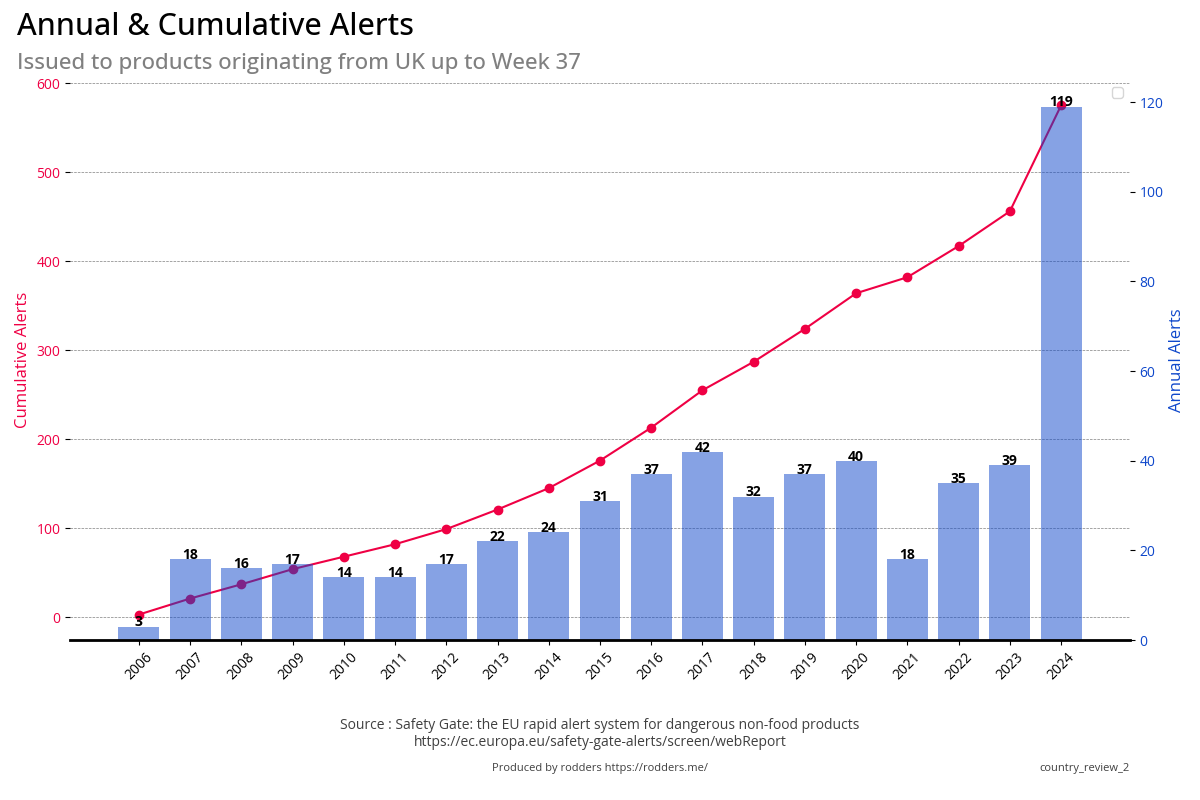
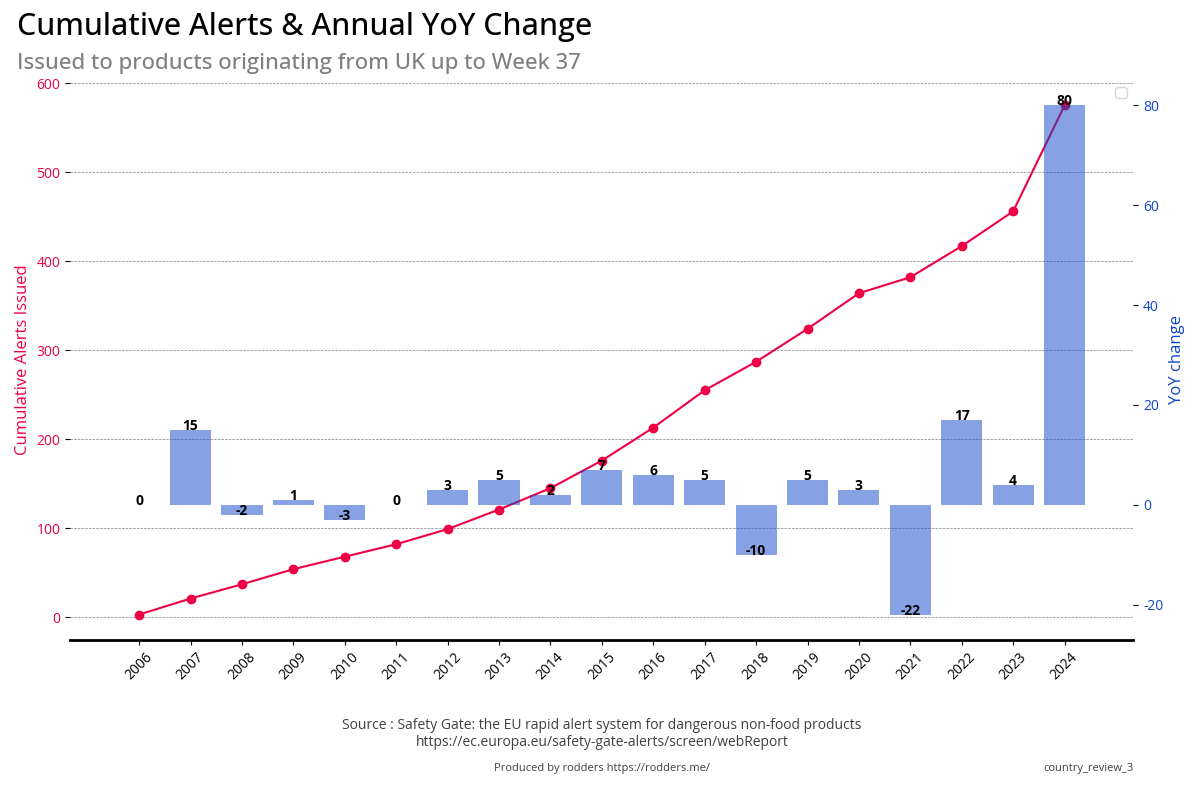
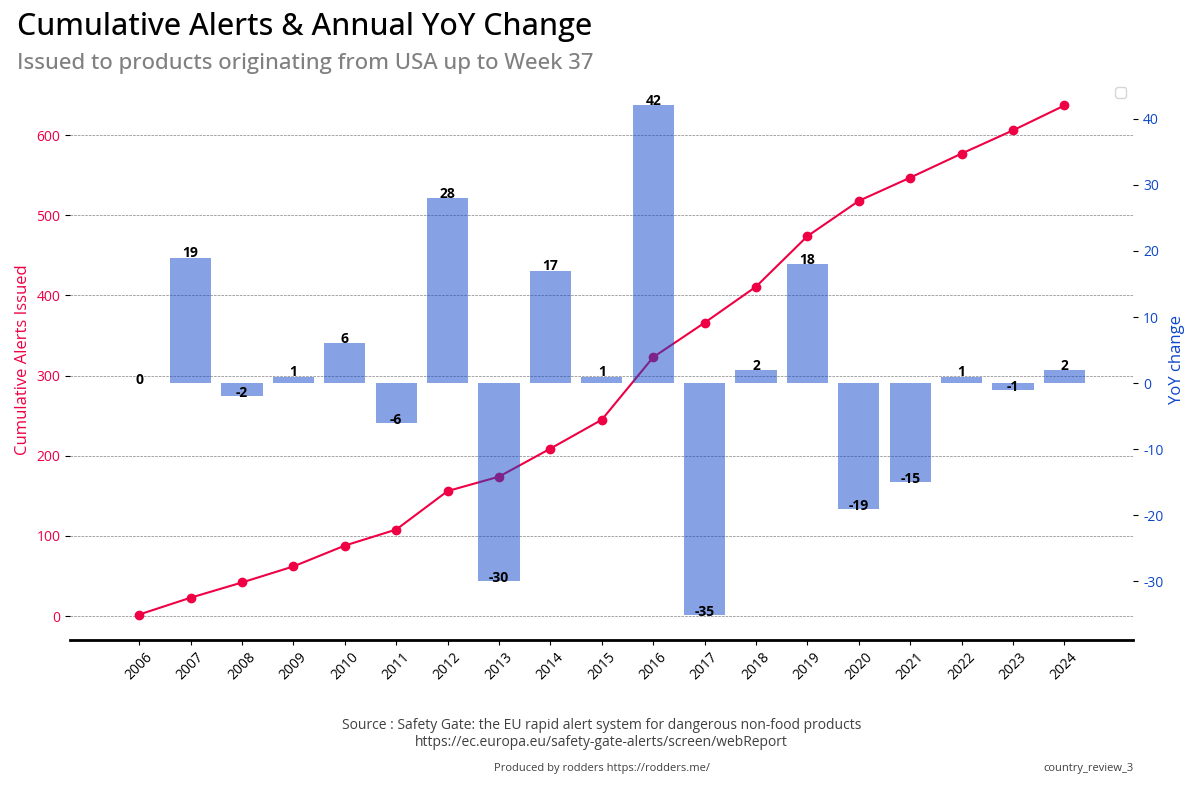
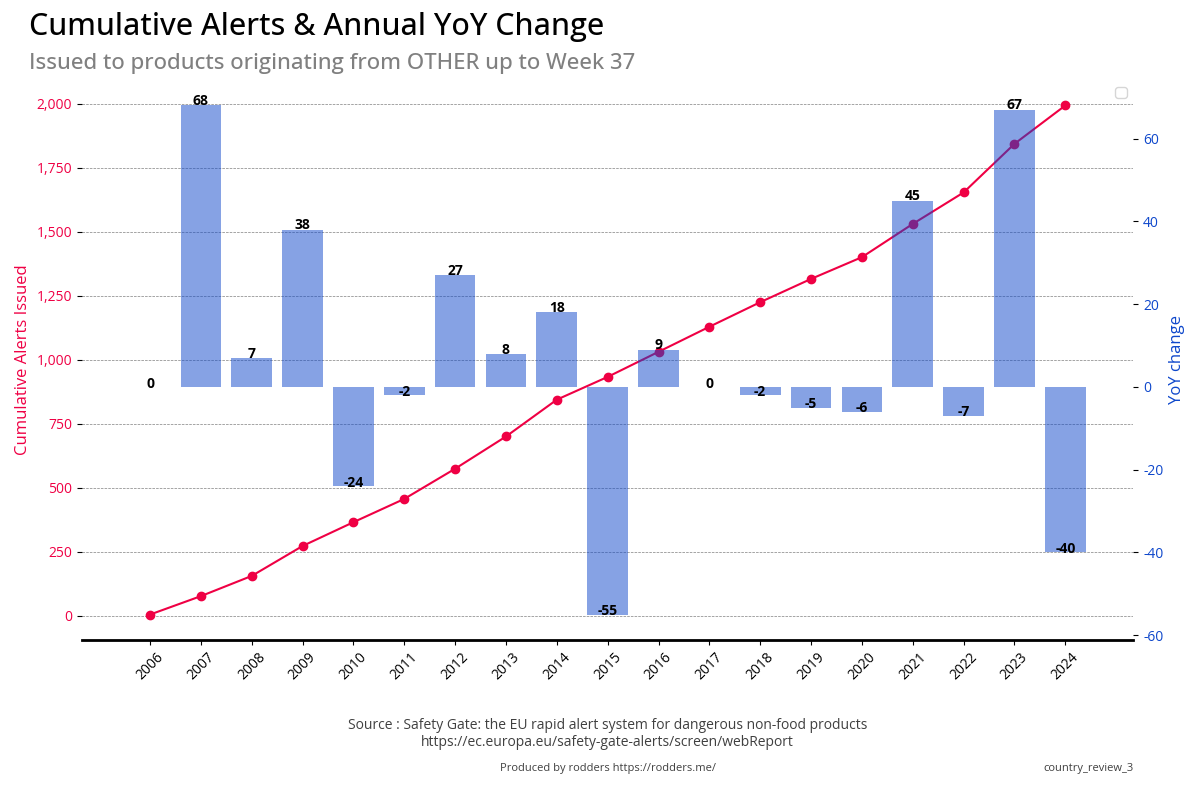
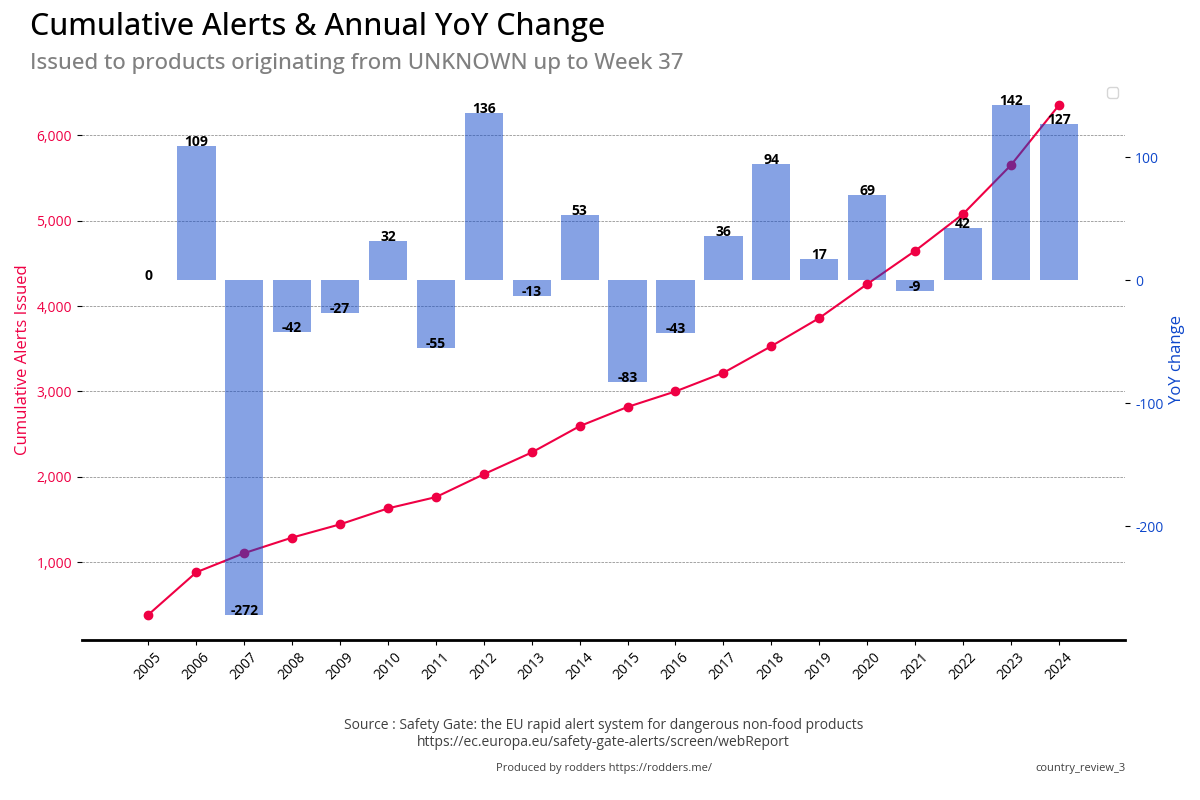
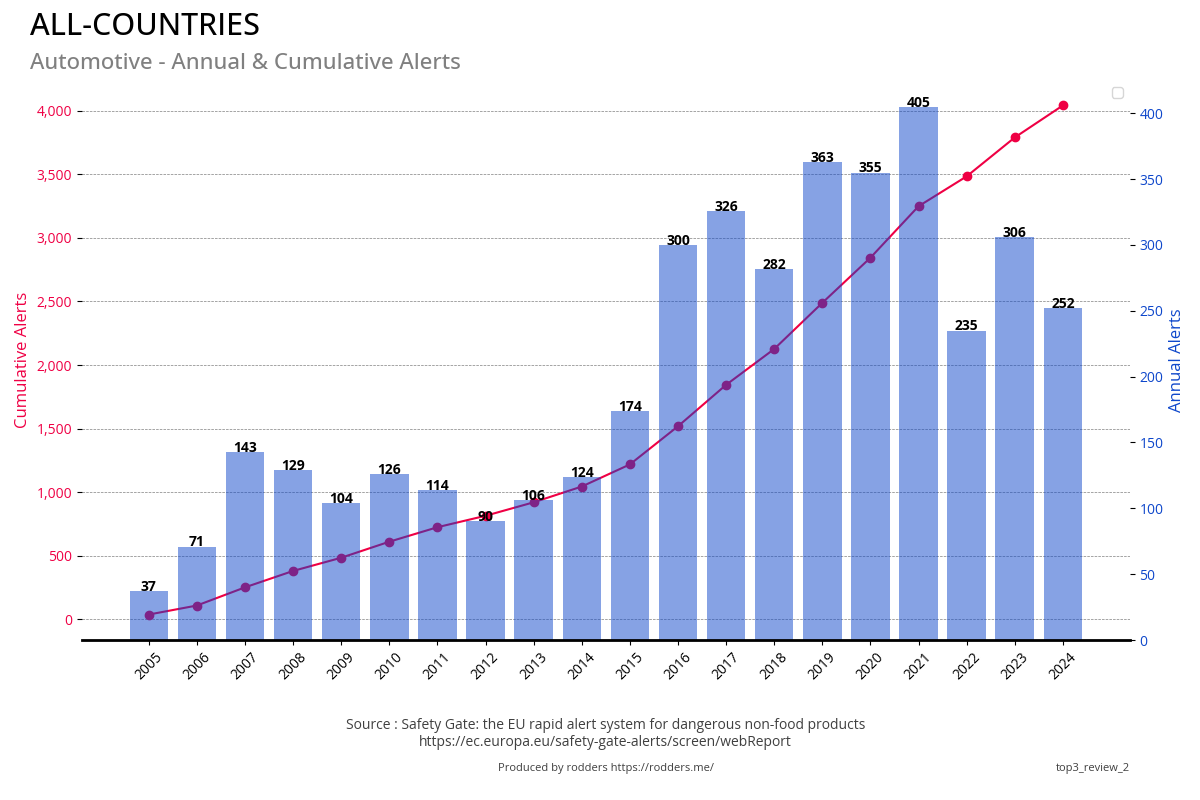
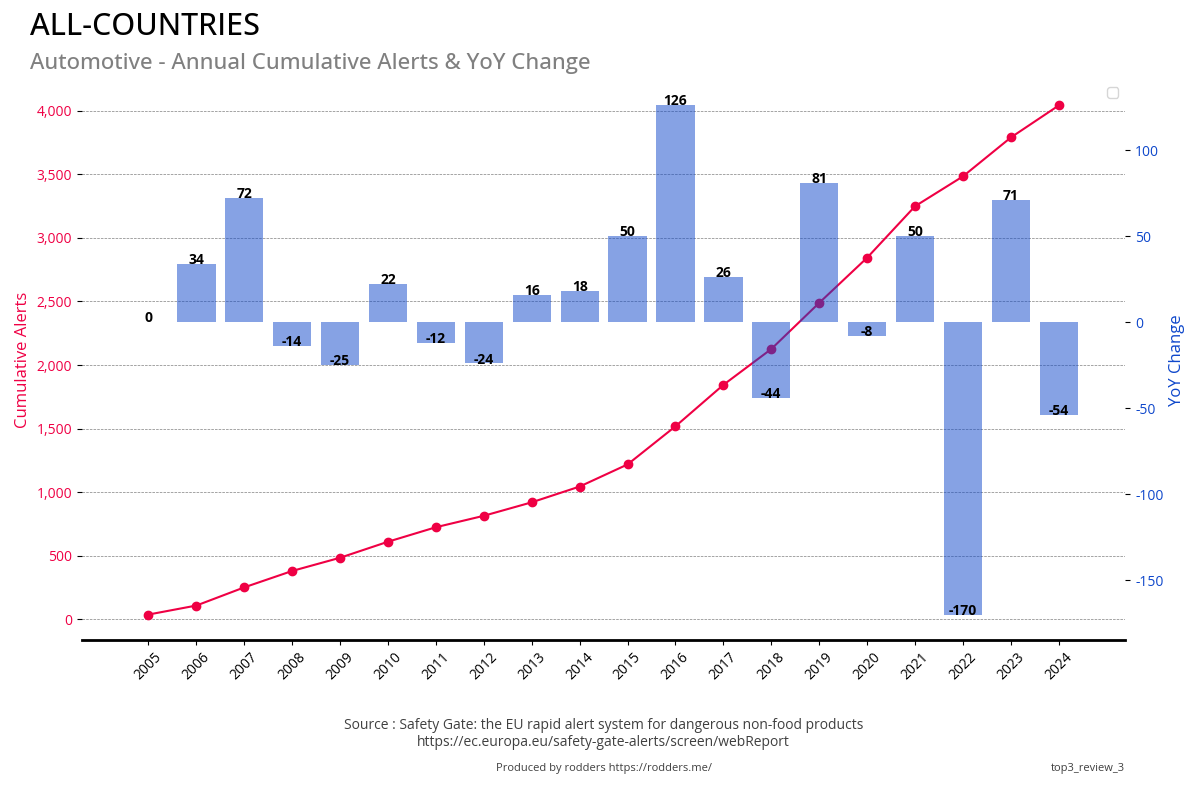
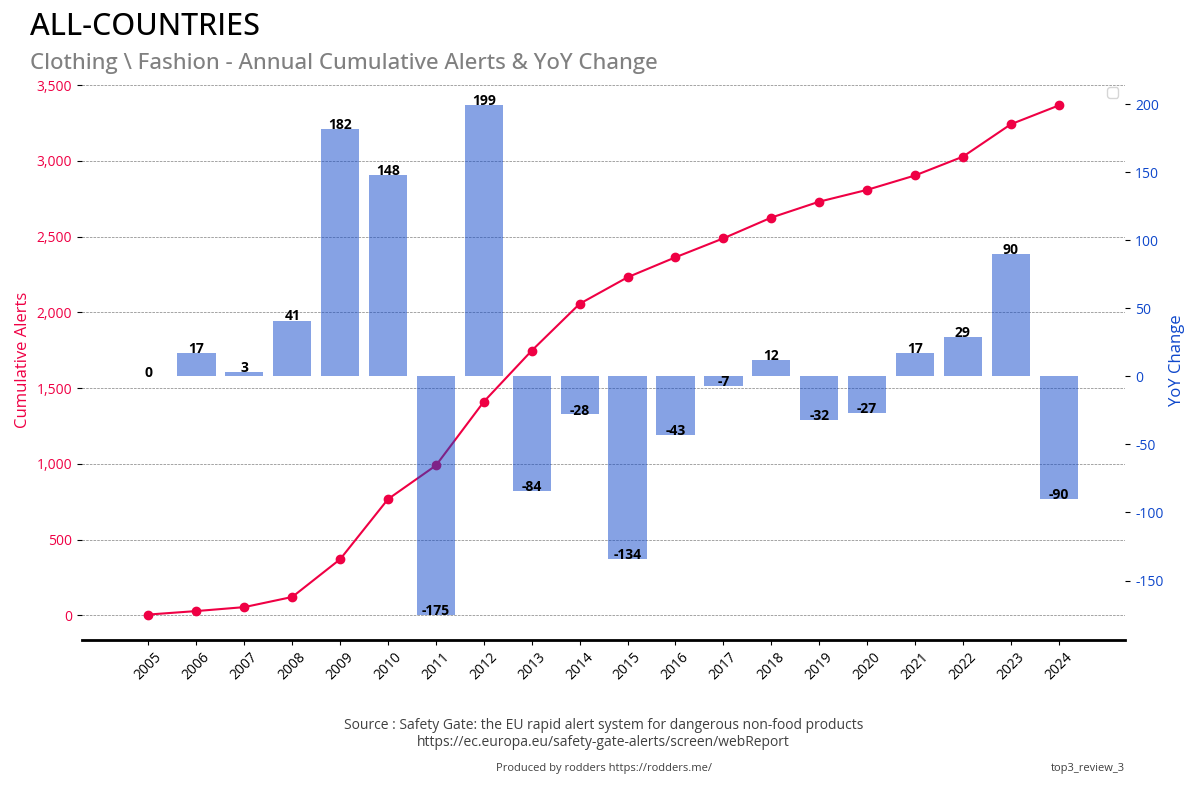
Annual Alerts Issued - YoY Change
2024 saw a 56% increase in the average number of alerts issued in a year, with the total alerts
issued increasing from 2,100 alerts in 2022 to 3,245 in 2024, an
increase of 1,173 over the previous year.
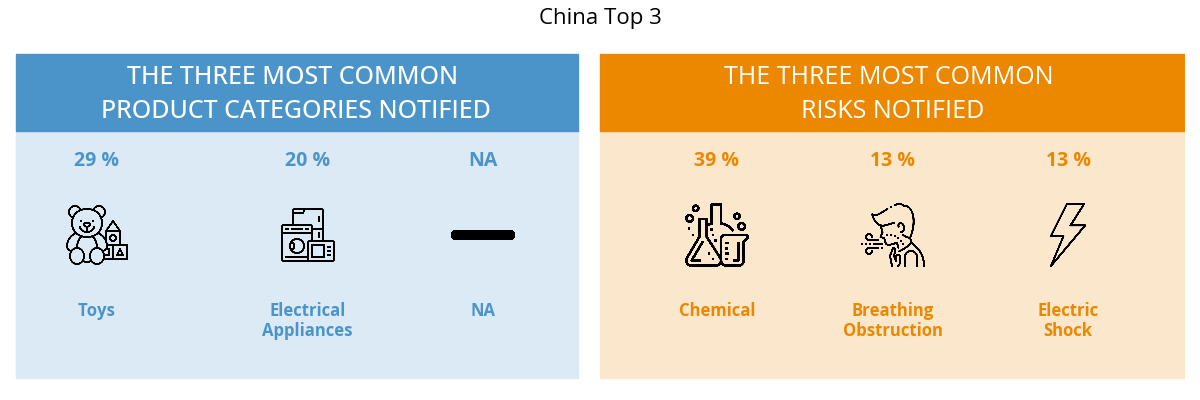
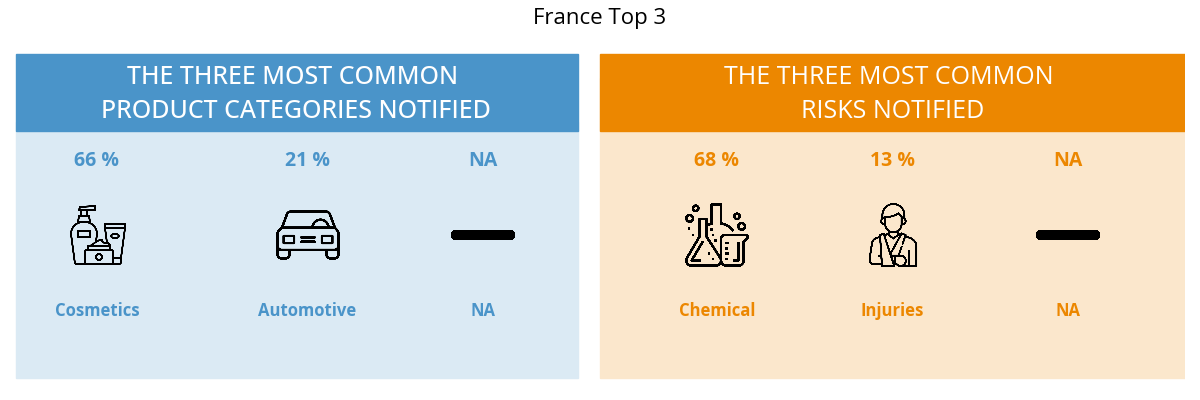
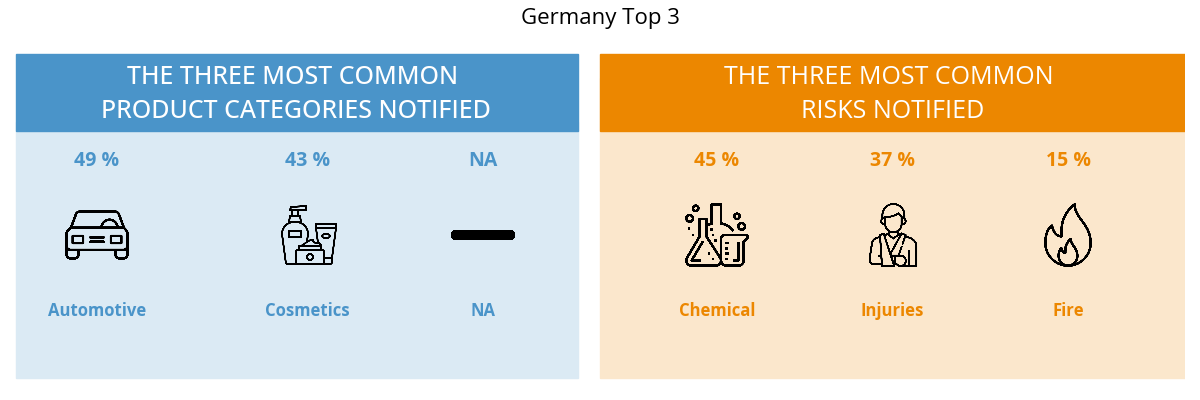
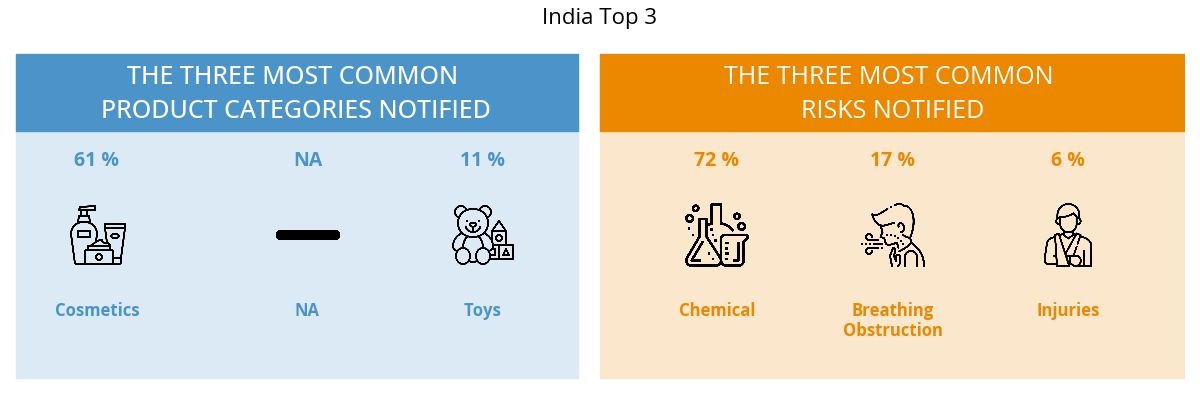
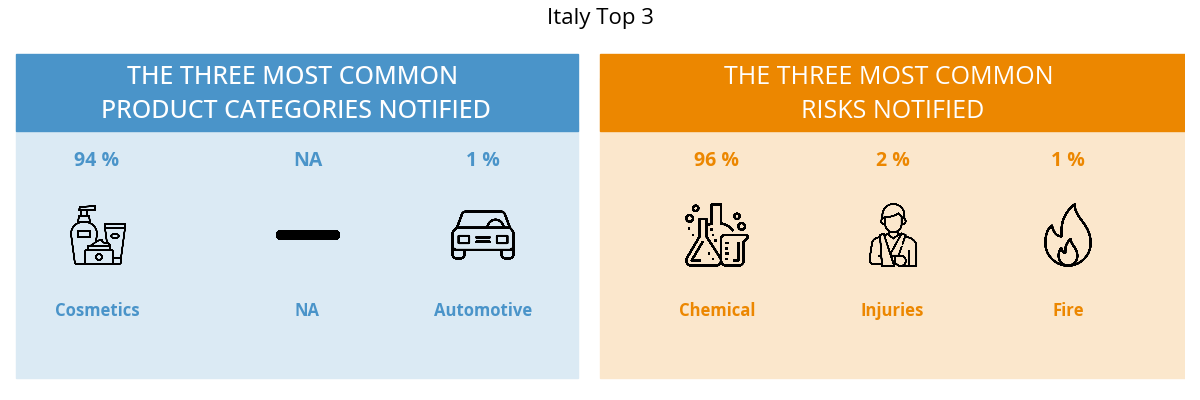
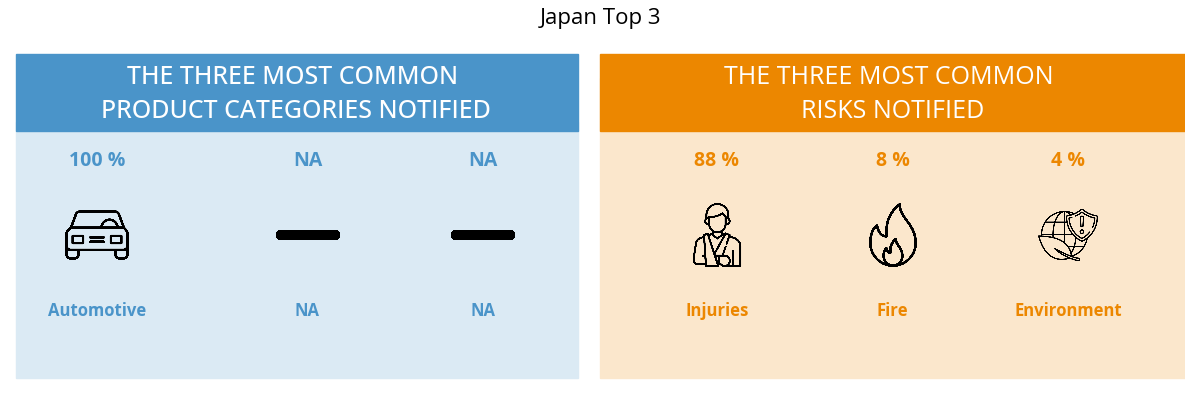
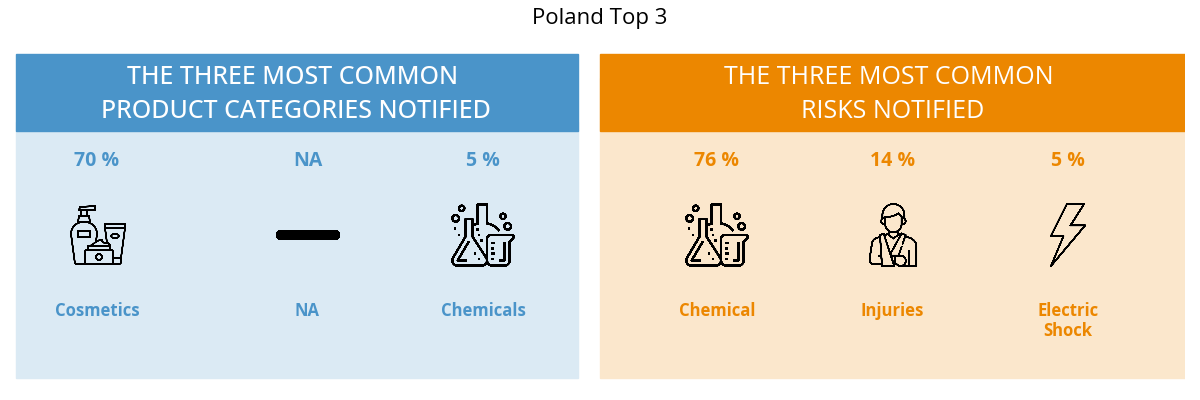
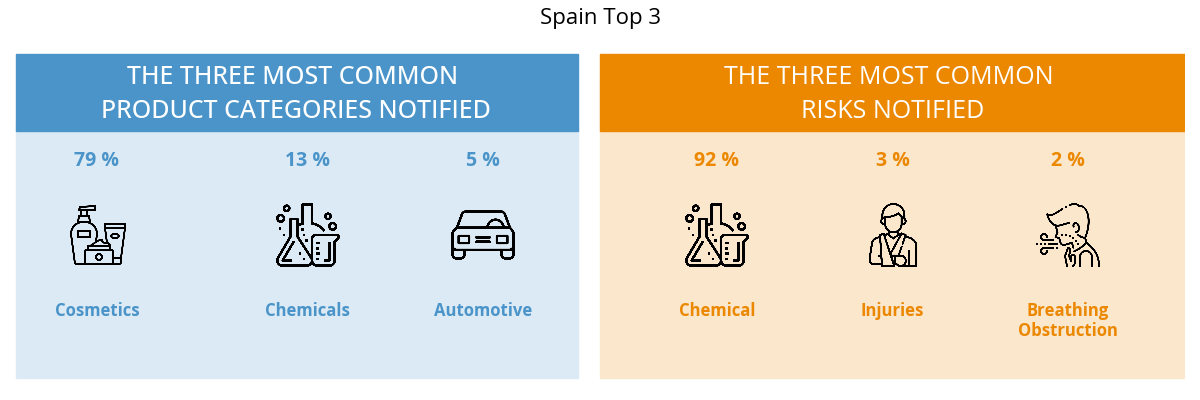
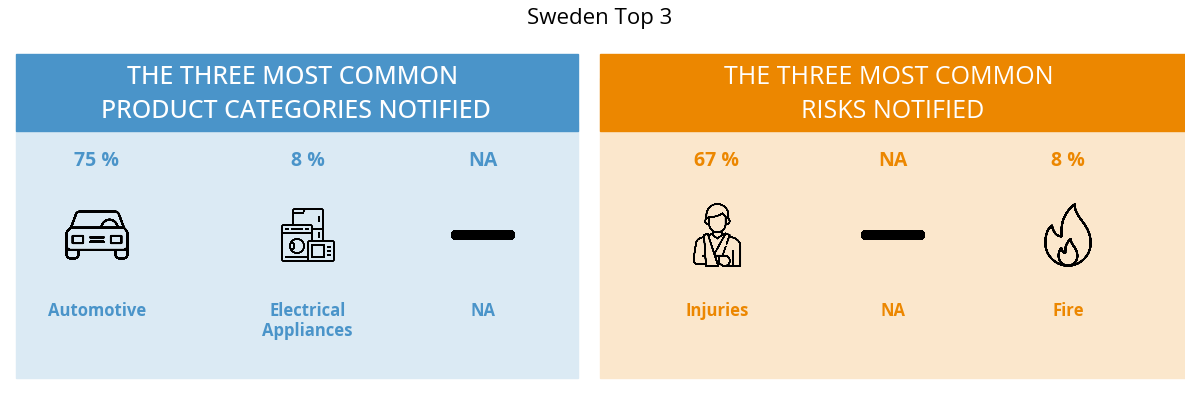
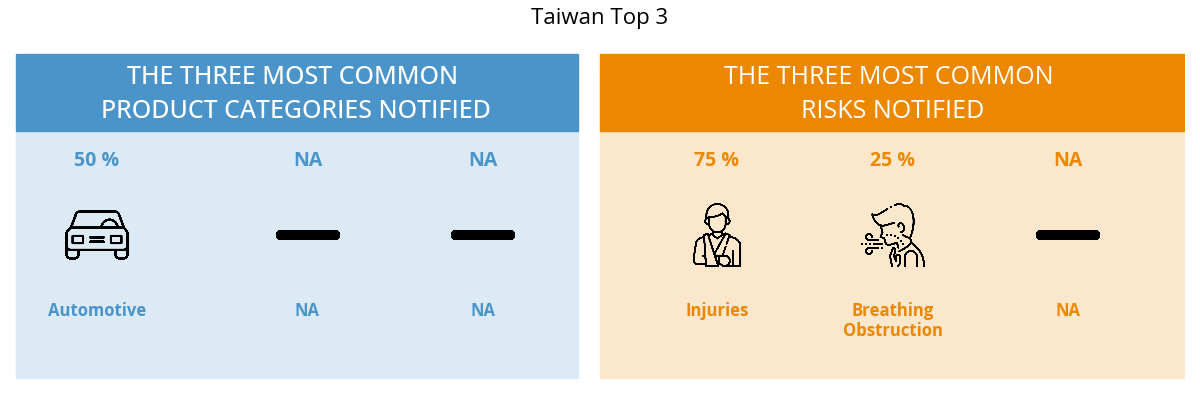
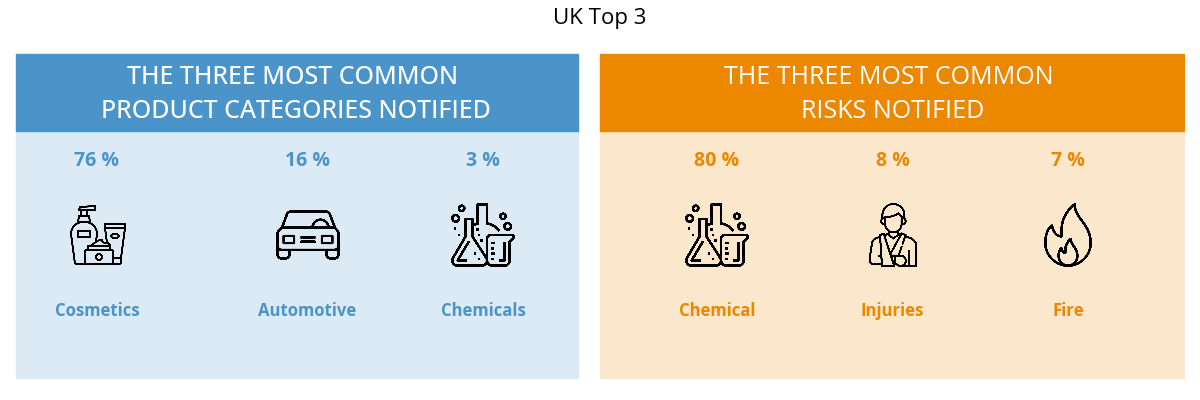
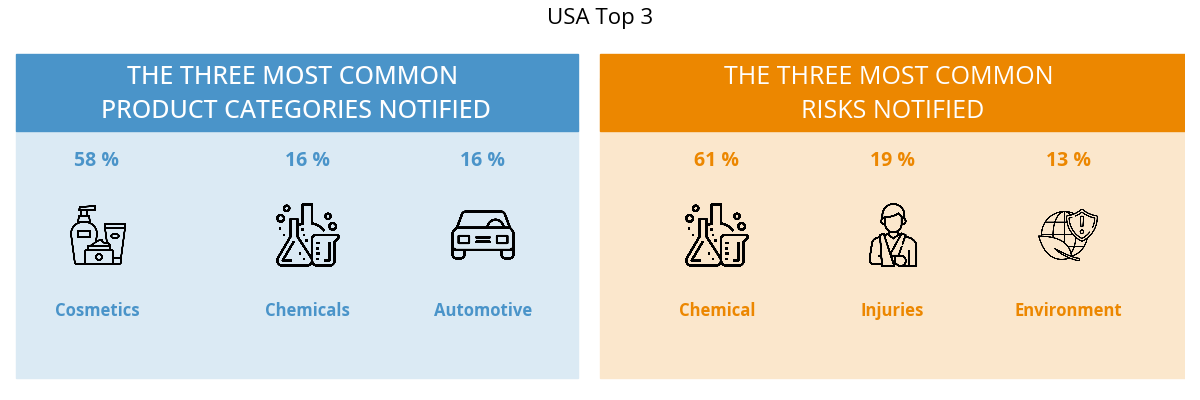
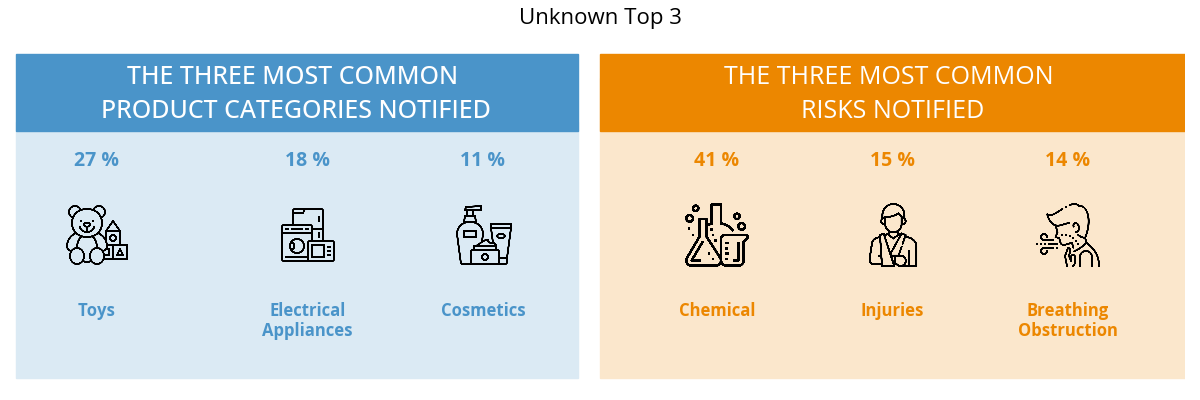
Programmatically created reproductions of the Top 3 Risk and Product categories by country visualisation in the official Fact sheet.
Safety_Gate_2024_Factsheet_EN.pdf
Cumulative, Annual and YoY change / Top3 Categories (Risk/Product)